
Abstract
Symptoms of depression and anxiety frequently co-occur, but traditional discrete-time models fail to capture their causal interactions. To explore the dynamic relationship between these symptoms, we applied two advanced methodologies—non-Gaussian direction of dependence analyses and continuous-time structural equation modeling—across two therapist-guided internet-based cognitive-behavioral therapy (iCBT) samples and two general-population cohorts (N = 22,530). Our findings revealed that in iCBT, neither depression nor anxiety exhibited causal dominance; instead, changes were driven by shared transdiagnostic processes. In the general population, depression showed unidirectional causal dominance over anxiety; stable symptom levels were sustained by shared time-invariant factors over multiple years. Overall, this large-scale study suggests that the interplay between depression and anxiety is primarily driven by shared transdiagnostic processes alongside the causal primacy of depression. These insights underscore the importance of non-Gaussian and continuous-time modeling in understanding mental-health comorbidities and advocate for transdiagnostic practices in treating both depression and anxiety.
The pervasive covariation among mental-health problems underscores the need to identify the primary causal processes driving their dynamics and treatment (Caspi et al., 2024; Forbes et al., 2024; Scheffer et al., 2024). Understanding these processes is crucial for advancing knowledge of symptom comorbidities and informing the development of treatments. This is particularly significant for depression and anxiety symptoms—the most prevalent mental-health issues worldwide (Jacobson & Newman, 2017; Saha et al., 2021). Experimental isolation of symptoms is challenging, making observational designs indispensable for exploring symptom dynamics. Earlier research has relied on discrete-time models to examine cross-lagged effects between the symptoms (Amendola et al., 2022; Lee & Vaillancourt, 2020; Long et al., 2018, 2019). Despite their widespread use, these models assume that temporal effects occur in discrete jumps and often fail to capture the continuously evolving nature of symptom dynamics, especially with sparse and arbitrarily timed sampling (Driver, 2024b; Rosenström et al., 2023). As a result, they are unlikely to reveal dominant causal processes between depression and anxiety. In this multisample cohort study, we use two causally informative methods to explore the dynamics between depression and anxiety symptoms during internet-based cognitive-behavioral therapies (iCBTs) and within the general population. Our causal triangulation framework integrates both non-Gaussian (i.e., nonnormal-distribution-based) and continuous-time modeling to advance the modeling of comorbid mental-health conditions, paving the way for more effective and targeted interventions.
Figure 1 provides an overview of the possible processes and mechanisms underlying the co-occurrence of depression and anxiety symptoms. Foundational theories of the human psyche have already posited that anxiety eventually culminates in depression if circumstances do not change (Bowlby, 1980; Darwin, 1872; Freud, 1936). These ideas inspired the helplessness-hopelessness theory, which suggests that anxiety arises from uncertainty about one’s ability to deal with important life outcomes (Alloy et al., 1990). Such experiences and expectations of helplessness are prone to produce hopeless certainty about inevitable negative life outcomes, resulting in depression (Alloy et al., 1990).
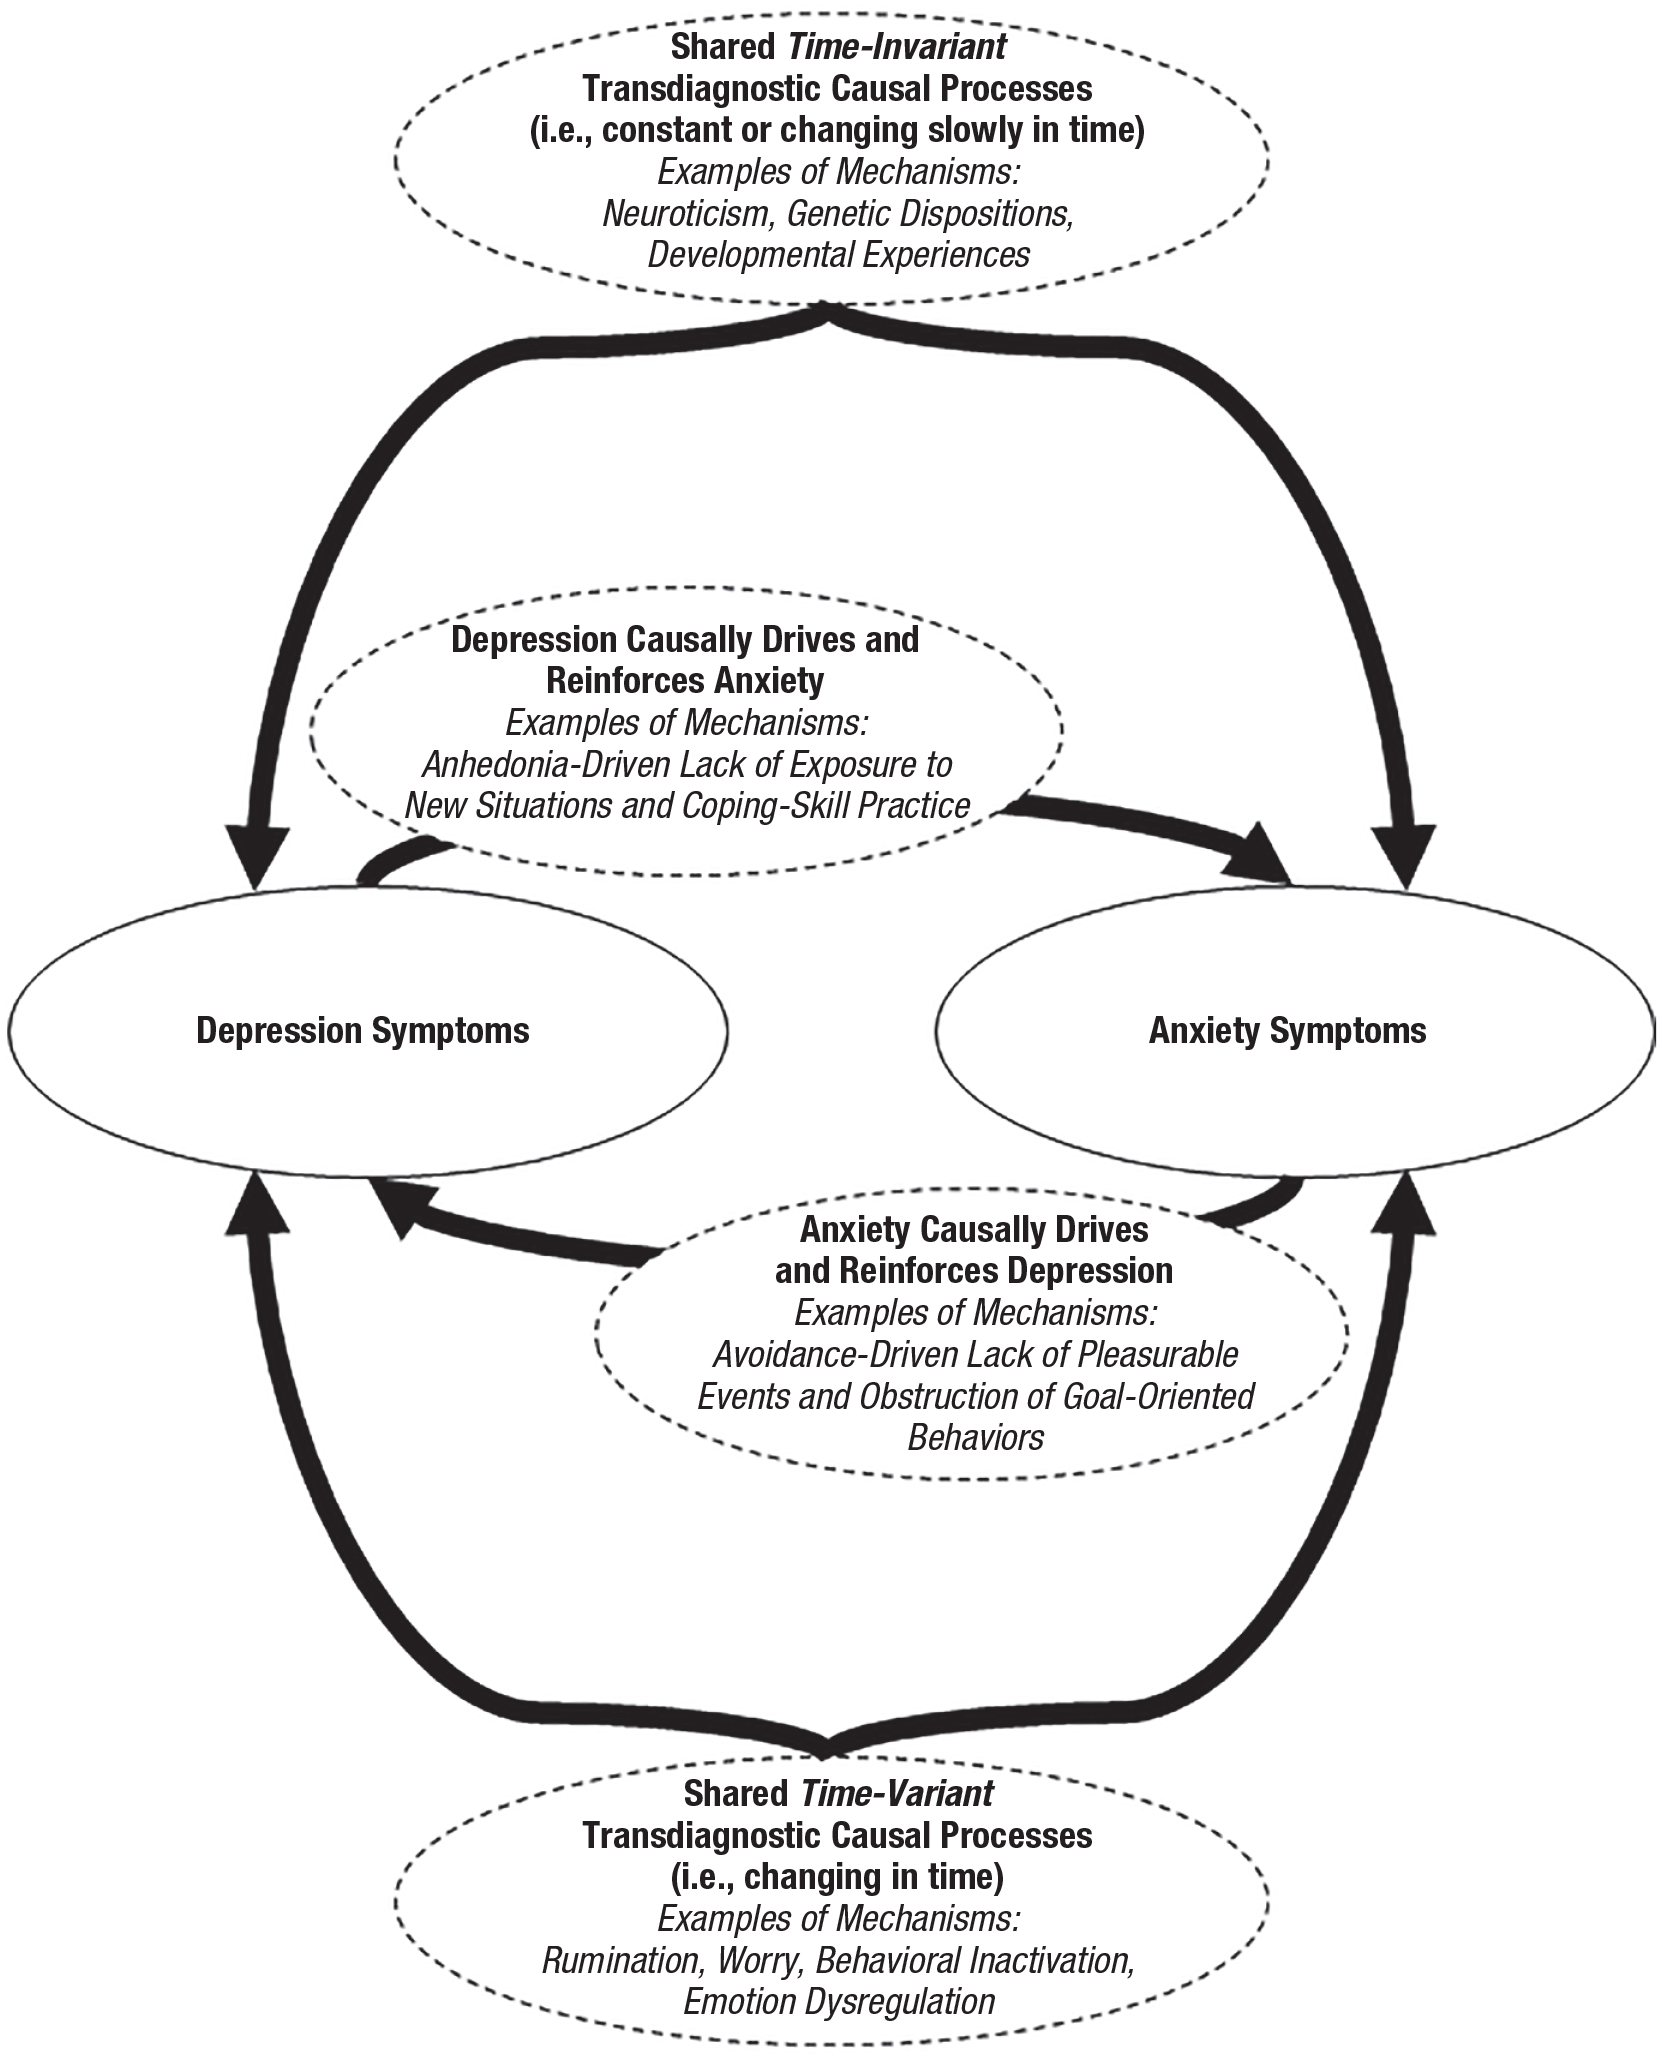
Conceptual overview of primary processes and possible mechanisms underlying co-occurrence of depression and anxiety symptoms.
More recent research has challenged the unidirectional view of anxiety preceding depression, stressing their bidirectional association. Meta-analyses have established the bidirectional associations in longitudinal designs (Jacobson & Newman, 2017; Saha et al., 2021). Depression may trigger anxiety through an anhedonia-driven lack of exposure to new situations and coping-skill practice (Demyttenaere & Heirman, 2020; Jacobson & Newman, 2017). This can intensify avoidance behavior and leave individuals vulnerable to anxiety when encountering new challenges. In turn, anxiety may lead to depression through the avoidance-driven absence of pleasurable events and hindered goal-oriented behaviors (Demyttenaere & Heirman, 2020; Jacobson & Newman, 2017).
However, various shared transdiagnostic processes may also explain the temporal associations between depression and anxiety. For instance, the Unified Protocol for Transdiagnostic Treatment of Emotional Disorders explicitly targets shared mechanisms of depression and anxiety, achieving results comparable with diagnosis-specific treatments (Carlucci et al., 2021; Longley & Gleiser, 2023). At the level of mechanisms, neuroticism, a personality trait describing sensitivity to negative emotions, is one of the shared time-invariant vulnerability factors underpinning both symptom sets (Barlow et al., 2021; Clark & Watson, 1991; Kotov et al., 2010). Other common-cause explanations include distal risk factors, such as genetic vulnerability (Levey et al., 2020; Rosenström et al., 2019) and adverse developmental experiences (Daníelsdóttir et al., 2024; Gardner et al., 2019), and proximate time-varying mechanisms, such as rumination, worry, behavioral inactivity, and emotion dysregulation (Olatunji et al., 2013; Sakiris & Berle, 2019; Stein et al., 2021).
Moreover, previous research on temporal associations between depression and anxiety symptoms has had methodological limitations that may have led to spurious findings. Most studies have focused solely on nontreatment contexts and predominantly used traditional cross-lagged panel models (e.g., Amendola et al., 2022; Long et al., 2018). These models are problematic because they cannot distinguish temporal effects within individuals from confounding time-invariant vulnerabilities (Falkenström et al., 2022; Hamaker et al., 2015; Lucas, 2023; Oud & Delsing, 2010). Although some adolescent studies have addressed this issue by decomposing within- and between-persons variances, they have overlooked measurement errors in symptom measures (Lee & Vaillancourt, 2020; Long et al., 2019). Ignoring measurement error can bias the estimated effects, leading to inaccurate conclusions (Driver, 2024b; Kröger et al., 2016; Lucas, 2023; Schuurman & Hamaker, 2019). Unlike random variations and publication biases, these statistical biases remain also uncorrected in meta-analytical research (Jacobson & Newman, 2017; Saha et al., 2021).
Finally, researchers have focused on modeling the dynamics between depression and anxiety as discrete-time phenomena. However, the symptoms or their absence represent dynamic phenomena that evolve continuously rather than in the discrete steps assumed by traditional discrete-time models (Driver, 2024b; Frank et al., 2017; Rosenström et al., 2013). The lagged discrete-time associations over specific intervals encapsulate the total effects of continuous moment-to-moment dynamics, not the direct causal effects (Driver, 2024b; Oud & Delsing, 2010). Depending on the chosen interval, discrete-time effects can deviate considerably from the actual causal effects; the apparent dominance of temporal effects between symptoms can shift across different time scales, the effects can change signs, and even large effects can be “detected” without any direct causal links (Driver, 2024b; Oud & Delsing, 2010; Rosenström et al., 2023). Thus, whenever the modeled time interval does not match the genuine causal dynamics, discrete-time models face challenges in accurately capturing temporal effects (Driver, 2024b). Consider an analogy: If John passes a torch to Jane and then Jane passes it to Tim but only the time points in which the torch is with John and then Tim are observed, a discrete-time model would overlook Jane’s crucial role in the causal chain. This issue is further complicated by the fundamental difficulty of specifying the time interval for comorbidity dynamics given the poor temporal resolution of prevailing theories about the timescale at which these processes unfold (Wright & Woods, 2020).
Current Study
In this study, we advanced the understanding of mental-health comorbidities by modeling the dynamics between depression and anxiety symptoms during two therapist-guided iCBTs for (a) depression and (b) generalized anxiety disorder and in two general-population cohorts. The iCBT cohorts included full populations of patients with structured symptom assessments before, during, and at the end of the treatment. These assessments offered valuable information on time for modeling the dominant causal processes driving symptom codynamics. In addition, we expanded the generalizability of our findings to typical nontreatment designs. This was done by modeling symptom codynamics in the general population using multiyear follow-up data from the nationally representative Midlife in the United States Study (MIDUS; Radler, 2014) and The Irish Longitudinal Study on Ageing (TILDA; Whelan & Savva, 2013).
We used two causally informative statistical methodologies: (a) non-Gaussian direction of dependence analyses (Hyvärinen & Smith, 2013; Rosenström et al., 2023) and (b) continuous-time structural equation modeling (Driver et al., 2017; Driver & Voelkle, 2018). These independent methods enabled us to address the conceptual and methodological challenges in the available literature. By relying on different assumptions, the methods provided us with a framework that approximated the ideal of causal triangulation (Hammerton & Munafò, 2021; Lawlor et al., 2016).
Built on the foundations of statistical blind-source-separation and independent-component analysis (Hyvärinen et al., 2001; Jutten & Herault, 1991), distribution-based non-Gaussian methods have become widely used to infer causal direction from observational data (Wiedermann et al., 2020). These methods are increasingly popular in psychopathology and psychotherapy research given their potential to advance understanding of complex psychological processes (Falkenström, 2023; García-Velázquez et al., 2020).
A key advantage of the non-Gaussian direction of dependence analyses is its minimal assumptions about the dynamics involved. This method can elucidate the dominant causal process between two variables by leveraging the fact that where correlation does not allow one to infer causation, higher statistical moments may do so; full non-Gaussian distributions do not fit competing directional causal flows like correlations do (Hyvärinen & Smith, 2013; Rosenström et al., 2023). Discrete-time models assume that temporal effects occur only in distinct time steps, whereas non-Gaussian analyses provide a more defensible causal estimate by capturing the dominant directionality between changes in two variables throughout the entire modeled interval (Rosenström et al., 2023). This approach accounts for various causal dynamics occurring between measurements, thus allowing for the inference of the primary causal process within the interval. Because they focus on estimating the primary causal process within the whole interval, non-Gaussian analyses also sidestep the challenge of changing (i.e., nonstationary) symptom dynamics (Schumacher et al., 2023). This makes them particularly well suited for modeling dynamic processes during psychotherapies, in which nonlinearity and discontinuity may manifest as sudden gains and losses (Olthof et al., 2020).
The non-Gaussian analyses enabled us to test hypotheses about the primary causal process between depression and anxiety symptoms. Specifically, we examined whether (a) depression predominantly drives anxiety, (b) anxiety predominantly drives depression, (c) the symptom influence is symmetrically bidirectional, or (d) symptoms are affected by shared unobserved transdiagnostic processes. Note that the method cannot distinguish between balanced, symmetrical bidirectional causation and shared transdiagnostic processes or provide insights into the specific transdiagnostic processes. To address these issues, our causal triangulation framework integrated non-Gaussian analyses with continuous-time structural equation modeling.
Similar to non-Gaussian analyses, the potential of continuous-time structural equation modeling—which draws on differential, integral, and stochastic calculus—is increasingly attracting attention in mental-health research (Coppersmith et al., 2023; Moggia et al., 2023). Its key advantage lies in the ability to capture a wide array of theoretical mechanisms through the estimation of continuous-time stochastic differential equations for timed panel-data observations (Driver, 2024a, 2024b; Driver et al., 2017; Oud & Delsing, 2010). When continuous-time assumptions hold, the model can distinguish even balanced bidirectional symptom influences from transdiagnostic confounding effects. The central assumptions for this estimation are that modeled stochastic effects are stationary, time-invariant confounders are accounted for by modeling stable individual differences, and there are no unobserved time-varying confounders (Driver, 2024a, 2024b; Driver et al., 2017; Oud & Delsing, 2010).
By estimating infinitesimal direct effects between the symptoms, we gained nuanced insights into their causal dynamics while eliminating biases associated with the discrete-time assumptions. Unlike typical cross-lagged panel models, continuous-time models also allowed us to consider several alternative transdiagnostic explanations. First, they enabled us to distinguish stable individual differences from temporal effects, accounting for time-invariant confounders. Second, these models allowed us to account for measurement errors, mitigating the risk of spurious findings. Finally, we were able to incorporate progress in treatment sessions as a time-varying confounder contributing to symptom co-dynamics.
These advancements may each seem only a small incremental improvement, but correct causal inference requires all important sources of bias to be eliminated. Only the integration across models in triangulation may be more akin to summing up the evidence and detecting areas of further interrogation. This process adds robustness to causal inference, which would otherwise remain brittle.
Transparency and Openness
The study was not preregistered. The Ethics Committee of HUS Helsinki University Hospital (HUS/1861/2020 and HUS/3150/2020) and the national Findata data-permit authority (THL/4810/14.02.00/2020 and THL/1303/14.06.00/2023) approved our access to the iCBT data registry in a pseudonymized form on a secure platform. The iCBT data sets are accessible via HUS with appropriate permissions. The MIDUS (Brim et al., 2016; Ryff et al., 2012, 2017) and TILDA (Kenny, 2014, 2018a, 2018b) data sets were openly available. For R scripts regarding all analyses and reported statistics, see https://osf.io/crsmh/. We report how we determined our sample size, all data exclusions, all manipulations, and all measures in the study.
This study was conducted in accordance with the Sixth World Medical Association Declaration of Helsinki. The research protocol on iCBT data sets was reviewed and approved by the ethical review board of HUS Helsinki University Hospital, and research permission was granted by the Findata (decision numbers above). The Findata and the HUS ethical review board relinquished the requirement for informed consent in accordance with the local laws and regulations on the secondary use of social and health-care registries.
Method
Samples and Procedures
iCBT for depression
Our first registry-based iCBT cohort included all 6,675 patients (69.7% women; age: M = 37.06 years, SD = 11.98, range = 17–83) who underwent a therapist-guided iCBT targeted for mild to moderate depression at HUS Helsinki University Hospital between March 2019 and April 2022. Physicians referred patients to the iCBT. The inclusion criteria of the iCBT for depression were a diagnosis of mild (F32.0) or moderate (F32.1) depression episode according to the 10th revision of the International Classification of Diseases (ICD-10); age over 15 years; the possibility of using a computer, smartphone, or tablet; phone number and email address; online banking credentials or mobile authentication; motivation to work independently assessed by the referring physician; and proficiency in Finnish. The exclusion criteria included acute suicidality, cognition-impairing neuropsychiatric conditions, bipolar disorder, and substance abuse. Among the patients, 8.6% were unemployed, 2.9% were retired, 17.8% were students, 13.8% were engaged in manual labor, 32.2% were in the lower working class, 16.1% were in the higher working class, and 3.4% were entrepreneurs. For 5.2% of the patients, their social-class information was unavailable. The great majority of patients were of Baltic-Finnic origin (99.4% had Finnish as their primary language). Although more than half (54.9%) resided within the municipalities of the HUS district, our patient population had a broad geographical spread; patients hailed from 219 out of Finland’s 309 municipalities. This underscored the national reach of our patient base.
The HUS-iCBT for depression comprises seven sessions. The sessions primarily focus on identifying, challenging, and modifying negative thought patterns; activating patients behaviorally; providing psychoeducation; and enhancing self-appreciation. Patients are supported by an online therapist, either a psychologist or a nurse, trained in delivering the iCBT. The therapist monitors the patient’s progress and answers questions through messages delivered on an online platform. The exact timing of patients’ sessions varied; reports of depression symptoms were collected in four sessions (first, third, fifth, and last), and reports of anxiety symptoms were collected in three sessions (first, third, and last). Yet the continuous-time structural equation models allowed us to use all data reliably. We derived the time information in weeks since the beginning of the treatment using exact dates.
iCBT for generalized anxiety disorder
Our second registry-based iCBT cohort included all 6,699 patients (78.8% women; age: M = 34.81 years, SD = 11.18, range = 18–83) who underwent a therapist-guided iCBT for generalized anxiety disorder at HUS between March 2019 and August 2022. Again, the patients were referred to the iCBT by their physician. The inclusion criteria for the iCBT for generalized anxiety disorder were a diagnosis of generalized anxiety disorder (F41.1) according to ICD-10; age over 15 years; the possibility of using a computer, smartphone, or tablet; phone number and email address; online banking credentials or mobile authentication; motivation to work independently assessed by the referring physician; and proficiency in Finnish. The exclusion criteria included acute suicidality, a personality disorder that hinders cooperation and commitment to treatment, cognition-impairing neuropsychiatric conditions, and substance abuse. Among the patients, 7.7% were unemployed, 3.6% were retired, 19.4% were students, 12.7% were engaged in manual labor, 32.1% were in the lower working class, 17.0% were in the higher working class, and 2.8% were entrepreneurs. For 4.7% of the patients, their social-class information was unavailable. Most patients were of Baltic-Finnic origin (99.6% had Finnish as their primary language). Moreover, although 57.9% resided within the municipalities of the HUS district, the patient population had a broad geographical spread (patients from 209 out of Finland’s 309 municipalities), underscoring the national reach.
The HUS-iCBT for generalized anxiety disorder includes 12 sessions. The sessions primarily focus on exploring, challenging, modifying, and accepting one’s thought patterns related to worrying and feelings of uncertainty (Ritola et al., 2022). Similar to iCBT for depression, patients are supported by a trained online therapist (i.e., a psychologist or a nurse) who monitors the patient’s progress and answers questions. Again, the continuous-time structural equation models allowed us to use all data reliably, although the exact timing of patients’ sessions varied; reports of depression and anxiety symptoms were collected in the first, sixth, and last sessions. We derived the time information in weeks since the beginning of the treatment using exact dates.
MIDUS cohort
The MIDUS cohort is a nationally representative sample of noninstitutionalized, English-speaking adults in the United States (N = 3,087; 51.5% women; age: M = 46.96 years, SD = 13.12, range = 20–74). We used all available MIDUS data on depression and anxiety symptoms from the first three measurement waves. Each wave occurred approximately 10 years apart, providing a long-term view of symptom development. Wave I was collected from 1995 to 1996 (Brim et al., 2016). Wave II was collected from 2004 to 2006 (Ryff et al., 2012). Finally, Wave III was collected from 2013 to 2014 (Ryff et al., 2017). Among the participants, 11.5% had the highest education level of a high school diploma or lower, including those with a General Educational Development certificate; 27.8% were high school graduates; 31.0% had completed some college coursework but did not obtain a degree; and 29.7% had earned a college degree or higher in Wave I. Regarding ethnicity, 83.6% identified as White, 6.5% identified as Black or African American, 0.7% identified as Native American or Alaskan, 1.1% identified as Asian or Pacific Islander, 0.7% identified as multiracial, and 2.6% identified with other racial or ethnic groups. For 4.8%, ethnic information was not reported. We determined the time in years since the first measurement using the exact month and year. 1 For more information about MIDUS, see https://midus.wisc.edu/.
TILDA cohort
TILDA cohort is a nationally representative sample of the Irish population ages 49 and over (N = 6,253; 58.5% women; age: M = 63.53 years, SD = 9.49, range = 49–80). We used all available TILDA data on depression and anxiety symptoms from the first three measurement waves with 1- to 3-year time intervals. Wave I was collected from October 2009 to February 2011 (Kenny, 2014). Wave II was collected from April 2012 to January 2013 (Kenny, 2018a). Wave III was collected from March 2014 to October 2015 (Kenny, 2018b). Among the participants, 3.4% had the highest education level of some primary school or lower; 27.2% had completed primary school; 22.8% had intermediate, junior, or group certificate (or equivalent); 17.0% had leaving certificate (or equivalent); 15.5% had diploma or certificate; 8.6% had a primary degree; and 5.5% were postgraduates or higher in Wave I. Among them, 91.0% were born in Ireland. Regarding religious affiliation, 88.6% identified as Roman Catholics, 3.1% belonged to the Anglican Church of Ireland/Episcopalian, 2.6% were Methodists, 0.6% were Presbyterians, 1.1% identified with other Christian denominations, 1.0% adhered to other religions, and 5.3% had no religion. We calculated the time in years since the first measurement by looking at the ages reported at each wave. For more information about TILDA, see https://tilda.tcd.ie/.
Measures
Depression and anxiety symptoms in iCBTs
In both iCBTs, depression symptoms were assessed using the sum score of the Patient Health Questionnaire-9 (Kroenke et al., 2001). Patients rated the frequency of experiencing nine symptoms (e.g., “Little interest or pleasure in doing things”) over the past 2 weeks using a 4-point Likert scale (0 = not at all, 3 = nearly every day). In turn, anxiety symptoms were assessed using the sum score of the Overall Anxiety Severity and Impairment Scale (Norman et al., 2006). Patients rated five items (e.g., “How often have you felt anxious?”) regarding the frequency, intensity, and interference of anxiety over the past week using a 5-point Likert scale (range = 0–4); higher scores indicate greater anxiety.
Depression and anxiety symptoms in MIDUS cohort
Depression symptoms were assessed using the sum score of four depression items from the Negative Affect Scale (Mroczek & Kolarz, 1998). Participants were asked to rate, on a 5-point Likert scale (1 = all the time, 5 = none of the time), the extent to which they experienced feelings of being (a) so sad that nothing could cheer them up, (b) hopeless, (c) as if everything was an effort, and (d) worthless over the last 30 days. Likewise, anxiety symptoms were measured through the sum score of two anxiety items from the Negative Affect Scale (Mroczek & Kolarz, 1998). Using the same 5-point Likert scale, participants indicated how frequently they felt (a) nervous and (b) restless or fidgety during the preceding 30 days. The scales were reversed and transformed to range from 0 to 4.
Before our primary analyses, we evaluated the construct validity of our depression and anxiety scales in the MIDUS data set using confirmatory factor analyses. For a detailed description of these analyses and their results, see Supplemental Material 1 in the Supplemental Material available online. In summary, the confirmatory factor analyses supported the presence of two distinct dimensions—depression and anxiety—rather than a one-dimensional negative-affect structure. Both depression and anxiety scales also indicated temporal invariance across the measurement waves. These findings supported the construct validity of the depression and anxiety scales in the MIDUS sample.
Depression and anxiety symptoms in TILDA cohort
Depression symptoms were assessed using TILDA scale of depression based on the Center for Epidemiological Studies Depression Scale–8 (O’Halloran et al., 2014). Participants rated the frequency of experiencing eight symptoms (e.g., “I felt depressed”) during the past week using a 4-point Likert scale (0 = rarely or none of the time [less than one day], 3 = all of the time [5–7 days]). To summarize the overall level of depression symptoms, TILDA uses a cumulative scoring system that groups the total points from all eight items into a 5-point scale: 1 (0–4 points), 2 (5–9 points), 3 (10–14 points), 4 (15–19 points), and 5 (more than 19 points). In turn, anxiety symptoms were assessed using TILDA scale of anxiety based on the Hospital Anxiety Scale (Zigmond & Snaith, 1983). Participants rated how well seven items on anxiety symptoms (e.g., “feel tense or wound up”) currently described their feelings using a 4-point Likert scale (range = 0–3); higher scores indicate greater anxiety. To summarize the overall level of anxiety symptoms, TILDA employs a cumulative scoring system that groups the total points from all seven items into a 4-point scale: 1 (0–4 points), 2 (5–9 points), 3 (10–14 points), 4 (more than 15 points).
Statistical Analyses
Non-Gaussian direction of dependence analyses
In our non-Gaussian direction of dependence analyses, we used the linear non-Gaussian structural vector autoregression model, which offers an advantageous approach for exploring dominant causal relationships between depression and anxiety symptoms (Hyvärinen et al., 2010; Rosenström et al., 2023). Unlike Gaussian models, this model can detect causal directionality between two variables within a specific interval when the variable distributions deviate from normal. This capability is particularly attractive because real-world data frequently deviate from strict normality, and the model can be efficiently used even with relatively minor deviations from the Gaussian (Rosenström et al., 2023; Talkkari & Rosenström, 2024). In our data, the Anderson-Darling normality tests revealed deviations from Gaussian distributions in both depression and anxiety symptoms across iCBTs and population follow-ups (ps < .001).
Figure 2a illustrates our non-Gaussian framework and the associated inferential process. For a detailed description of the model, including its equations, see Supplemental Material 2 in the Supplemental Material. In our primary non-Gaussian model for iCBTs, we estimated the autoregressive and cross-lagged effects of depression and anxiety symptoms from the first session on those at the last session. Moreover, we estimated the baseline-adjusted instantaneous (i.e., during-treatment) effect of depression on anxiety during the last session, or vice versa, to assess their relative causal dominance. This same model was also estimated between the other sequential measurements on both symptom sets, from the first session to midtherapy and from the middle to the last sessions. These additional analyses enabled the exploration of changes in the symptom codynamics during different iCBT phases (Schumacher et al., 2023). The same modeling strategy was applied in MIDUS and TILDA cohorts with three measurement waves focusing on the intervals between Waves I and III, Waves I and II, and Waves II and III. Finally, we conducted pooled analyses for both clinical and population data, combining data sets from the iCBT cohorts and those from the general-population cohorts.
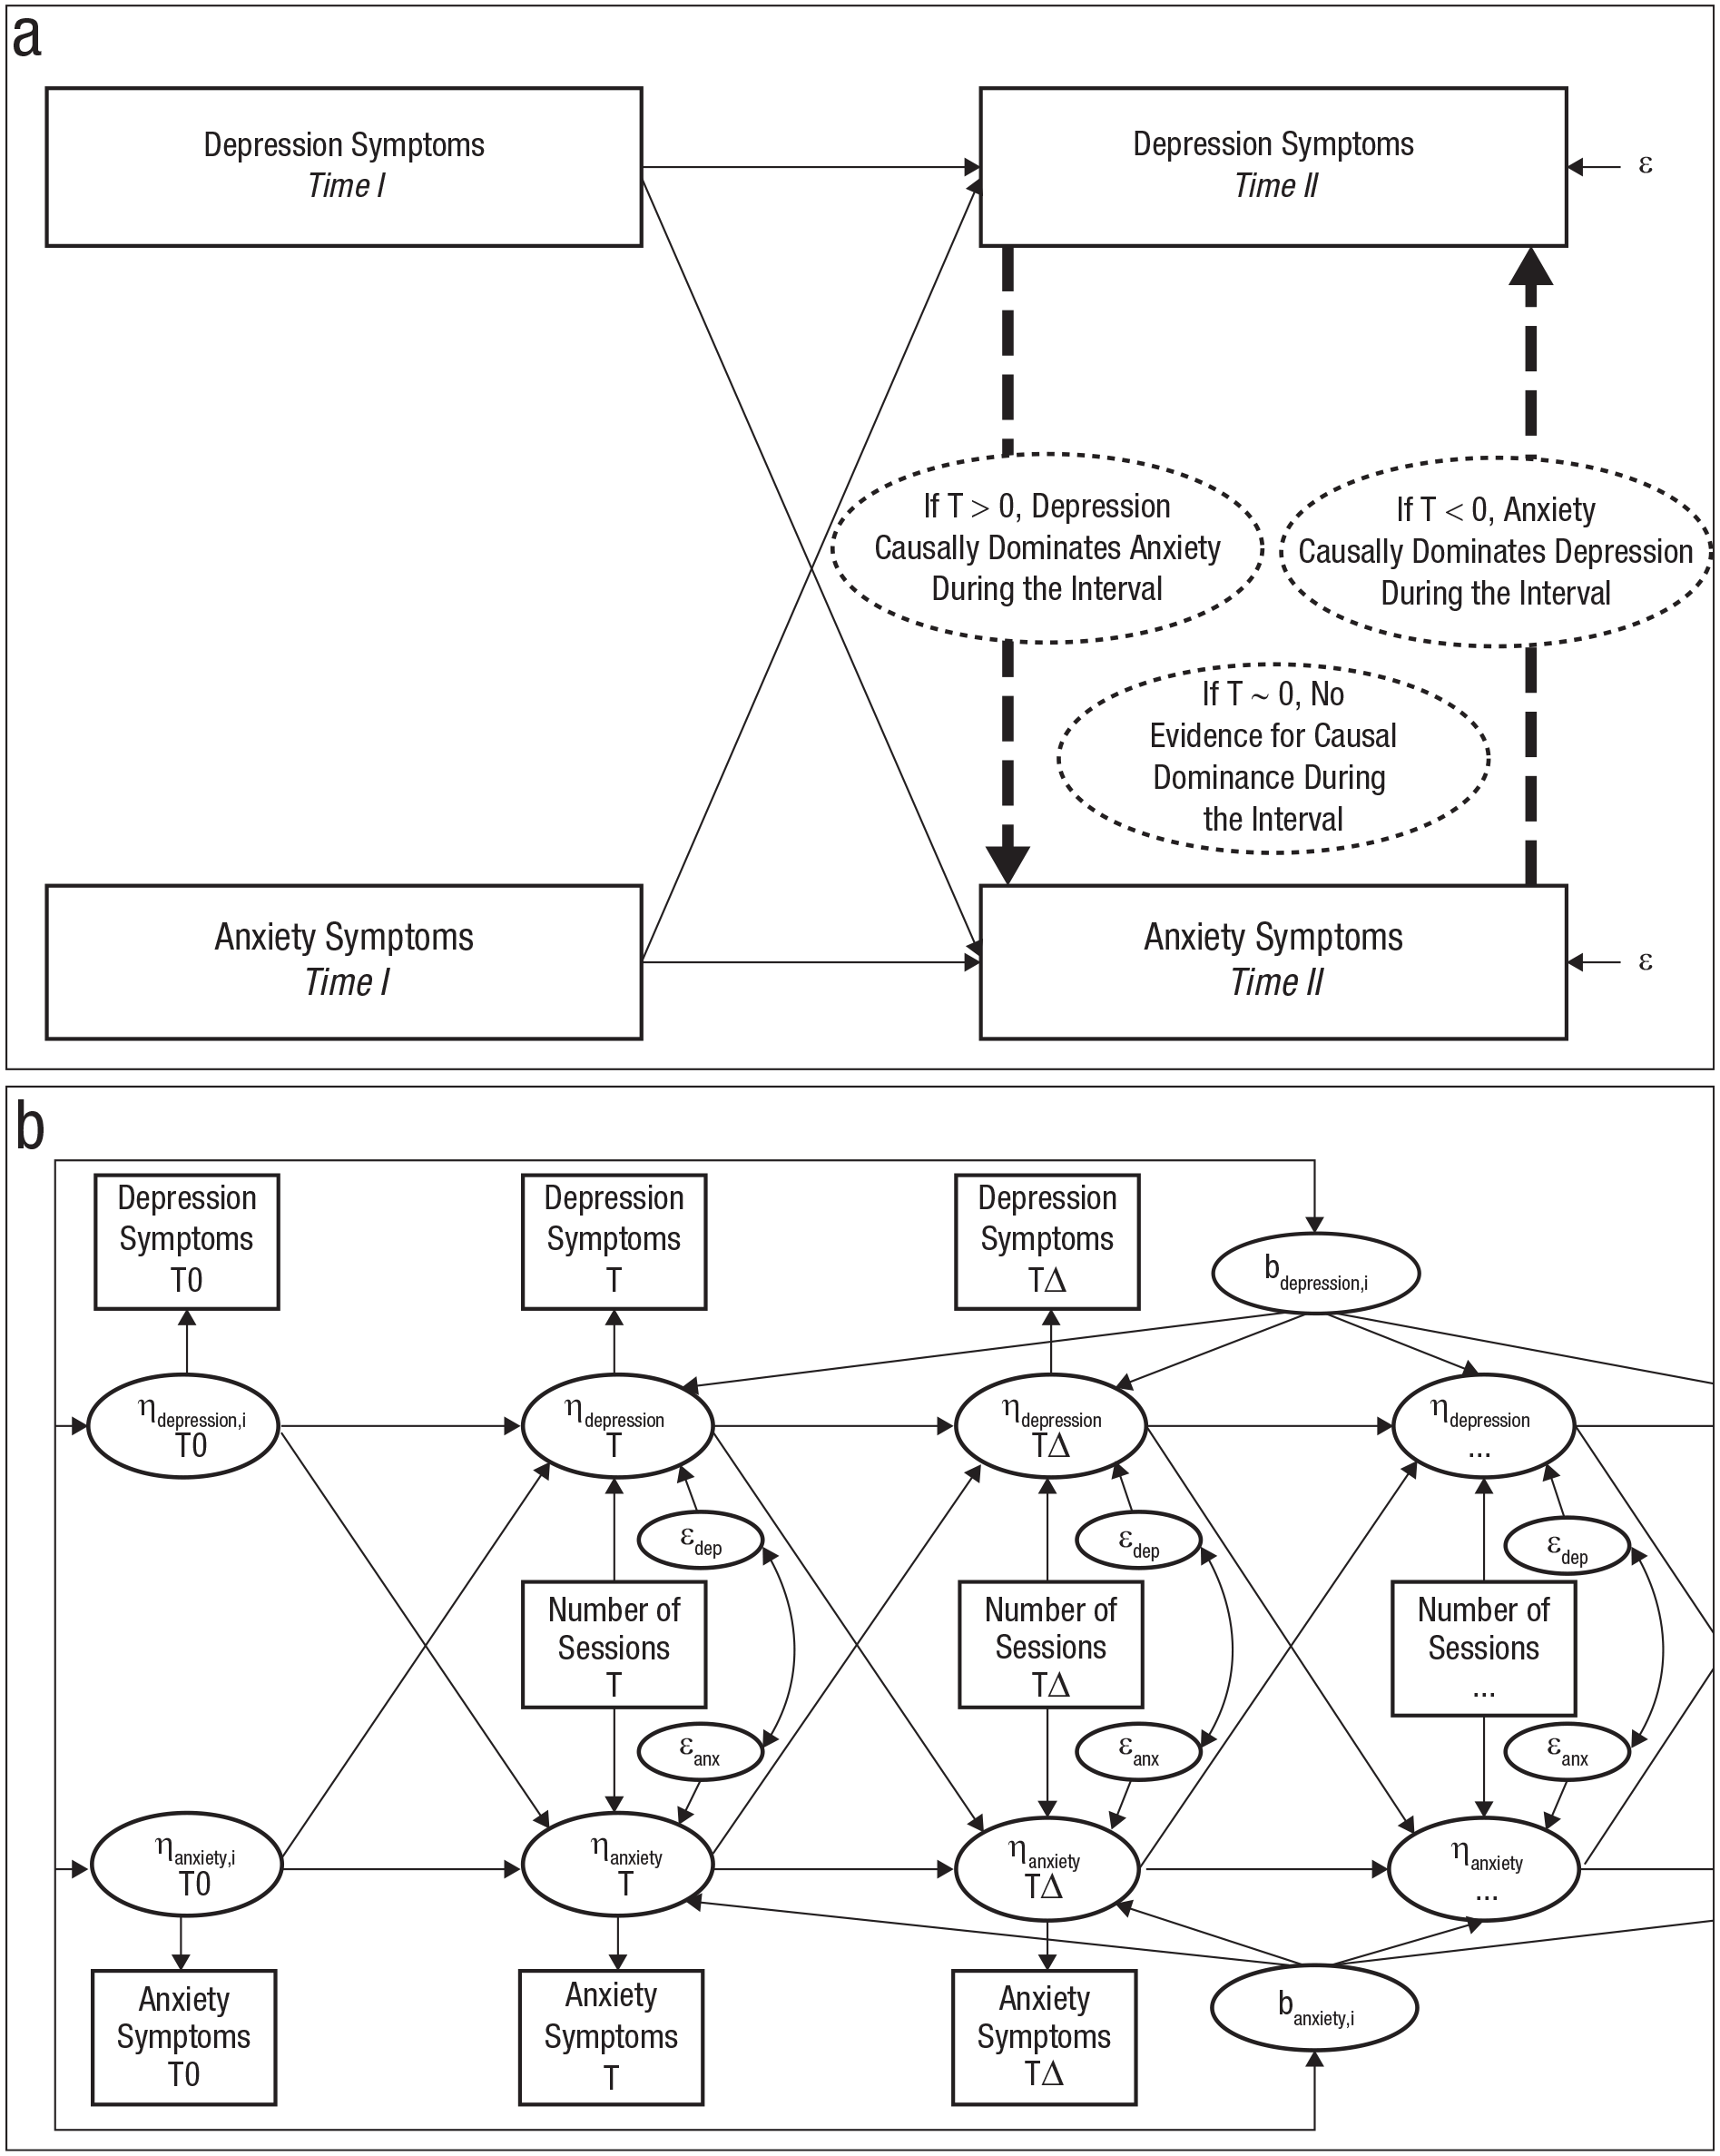
Graphical illustration of (a) non-Gaussian structural vector autoregression model and (b) continuous-time vector autoregressive model. In Fig. 2a, the bold dashed arrows refer to either the instantaneous (i.e., the unobserved during-therapy) effect of depression on anxiety symptoms or that of anxiety on depression. The direction of the instantaneous effect was based on the results of the T statistic. In Fig. 2b, all arrows refer to the effects or associations that are assumed to be time-invariant (i.e., stationary), meaning that they remain the same across the follow-up period. The subscript i indicates individual differences (i.e., random effects) in the initial values at T0 and in continuous-time symptom intercepts (i.e., bdepression and banxiety). Thus, the arrows between the initial values and intercepts indicate their between-persons-level correlations/covariances. Progress in treatment sessions was included as a time-varying covariate only in the internet-based cognitive-behavioral-therapy models. The measurement errors of the manifest variables of depression and anxiety are not shown for visual simplicity. T = time.
The primary focus in all our non-Gaussian analyses was on the instantaneous effect, which has a time lag of zero. This effect provides an estimate of the causal directionality of change between depression and anxiety symptoms throughout the entire modeled interval (Rosenström et al., 2023). The direction of the instantaneous effect was inferred using a T test statistic (not the Student’s t) based on a proven mathematical fact: Whenever a linear causal relationship holds between the two variables and at least one involved variable has a non-Gaussian distribution, the dominant causal variable is less dependent on the regression residuals it induces (Rosenström et al., 2023; Shimizu et al., 2011; Skitovich, 1954). Crucially, instead of correlation, we refer to general statistical dependency as indicated, for instance, by the information-theoretic mutual information (Rosenström et al., 2023). A positive T statistic indicates that changes in depression causally drive changes in anxiety, whereas a negative T statistic indicates reverse causality (Rosenström et al., 2023). A T statistic that does not differ from zero suggests bidirectional causality or confounding transdiagnostic processes.
Simulation-based research has demonstrated the effectiveness of non-Gaussian analyses, even with relatively modest sample sizes, by showing their robustness against issues such as measurement errors, ordinal-valued approximations for continuous variables, and confounding (García-Velázquez et al., 2020; Hyvärinen & Smith, 2013; Rosenström et al., 2023; Rosenström & García-Velázquez, 2020). Specifically, in situations involving time-varying confounding and correlated initial values, the linear non-Gaussian structural vector autoregression model has proven robust and accurate in T-statistic-based inference for determining the directionality of instantaneous effects in sample sizes of 200 or higher (Rosenström et al., 2023). We conducted further simulations to assess the robustness of the T statistic for time-invariant confounders. As shown in Table S3 in Supplemental Material 3 in the Supplemental Material, these simulations indicated that the T statistic showed high power in correctly detecting the directionality of even small instantaneous effects in data sets comparable in size with ours. Likewise, when no dominant causal variable was present, the T statistic accurately identified the absence of causal dominance. Overall, the available simulation evidence underscores the accuracy and robustness of the non-Gaussian structural vector autoregression model in providing defensible estimates of the primary causal process between depression and anxiety symptoms in our iCBT and population cohorts.
We estimated linear non-Gaussian structural vector autoregressive models with 5,000 bootstrapped replications using R software (Rosenström et al., 2023). Before the analyses, depression and anxiety symptoms were scaled in wide-data format within each measurement point. We used the maximum entropy approximation of the likelihood ratio estimator, recognized for its superior performance in simulations using multiple competing non-Gaussian estimators (Hyvärinen & Smith, 2013; Rosenström et al., 2023).
Continuous-time structural equation models
Next, we compared four continuous-time vector autoregressive models across the iCBT cohorts, general-population cohorts, and pooled data sets. By explicitly accounting for time-invariant and certain time-varying confounders, measurement errors, and the continuously evolving nature of symptom dynamics, these models complemented the non-Gaussian analyses while addressing the limitations of discrete-time models. Furthermore, continuous-time models enabled us to use precise time stamps for each data point, allowing for variations in measurement timing to be accurately modeled. Thus, these analyses provided more nuanced estimates of the several underlying processes, enhancing the scientific defensibility of our causal triangulation framework.
Figure 2b depicts the fourth and most complex iCBT model (omitting estimated measurement errors). Supplemental Material 4 in the Supplemental Material provides a detailed description of the estimated parameters in each model, with equations. In all models, we estimated population fixed effects for auto-effects (i.e., how symptoms influence themselves) and cross-effects (i.e., how symptoms influence each other). We also estimated fixed effects for diffusion variances (i.e., system noises) and covariances (i.e., system-noise correlation) involving the effects of unobserved time-varying transdiagnostic variables on symptom fluctuation and cofluctuation. Finally, we estimated fixed effects for continuous-time symptom intercepts, determining the population-level trajectories, and initial symptom levels.
Regarding the differences between models, in the first model, we estimated random effects for the initial symptom levels to model the participant heterogeneity. In the second model, we added random effects for continuous-time symptom intercepts to account for the multilevel nature of our data. This approach allowed us to distinguish the temporal within-persons effects between symptoms from unobserved, time-invariant confounders (Driver & Voelkle, 2018; Falkenström et al., 2022; Hamaker et al., 2015; Oud & Delsing, 2010). In the third model, we estimated the measurement errors of depression and anxiety scores, minimizing biases in the cross-effects (Driver, 2024b; Kröger et al., 2016; Lucas, 2023). In the final model for the iCBT cohorts, we controlled for progress in treatment sessions as a time-varying predictor when modeling the cross-effects (note that the sessions encoded 1 = Session I, 3 = Session III, 5 = Session V, 7 = Session VII in iCBT for depression and 1 = Session I, 6 = Session VI, 12 = Session XII in iCBT for generalized anxiety disorder were dated for each patient). This approach allowed us to separate treatment progress from calendar time and thereby account for the confounding effects of treatment progress on both depression and anxiety symptoms. In turn, in the final model for general-population cohorts, we addressed the high right skewness of both depression (skewness = 2.24–2.33) and anxiety (skewness = 1.05–1.33) scores in these cohorts by modeling a nonlinear relationship between the latent processes and symptom scores (Driver, 2024b; see more in Supplemental Material 4 in the Supplemental Material).
We estimated and compared continuous-time vector autoregressive models using the R package ctsem (Version 3.9.1; Driver et al., 2017). 2 To meet ctsem defaults, all variables were standardized across the long-format data, and progress in treatment sessions was further rescaled so that the first session had a value of zero (Driver & Voelkle, 2021). In estimation, we used the default optimization approach of ctsem, handling missing data with the full information approach. Moreover, the default priors of ctsem, developed for typical applications in the social sciences (Driver & Voelkle, 2018), were used to improve the model estimation, particularly in the general-population cohorts. Each model was run with at least three different seeds to ensure the sufficient stability of estimates.
Results
Descriptive Statistics
Supplemental Material 5 in the Supplemental Material presents the descriptive statistics for the depression and anxiety sum scores (i.e., means, standard deviations, skewness, kurtosis, Cronbach’s alphas) along with their correlations, mutual information, and the results of the paired Student’s t tests. For the iCBT patients with depression and generalized anxiety disorder, the relevant statistics are presented in Table S5A and Table S5B, respectively, in the Supplemental Material. For the MIDUS and TILDA cohorts, these statistics can be found in Table S5C and Table S5D, respectively, in the Supplemental Material.
Direction of Dependence Between Depression and Anxiety Symptoms
Figure 3 presents the results of the non-Gaussian structural vector autoregressive models on causal dominance between depression and anxiety symptoms. Regarding iCBTs, the results were highly consistent. The T statistics for instantaneous effects showed no evidence for the causal dominance of either depression or anxiety at the level of the whole treatment. A specific observation in the iCBT for generalized anxiety disorder implied that depression exerts causal dominance over anxiety between the middle and last sessions (β = 0.59). Analyses for pooled iCBT data replicated this pattern, suggesting a shift toward depression causally dominating anxiety from the midpoint to the end of treatment (β = 0.59). This indicated that changes in depression led to corresponding changes in anxiety. However, such dominance was not detected at the beginning or during the whole treatment. Hence, these results suggested that either bidirectional effects or shared transdiagnostic processes primarily drive the symptom codynamics during the iCBTs.
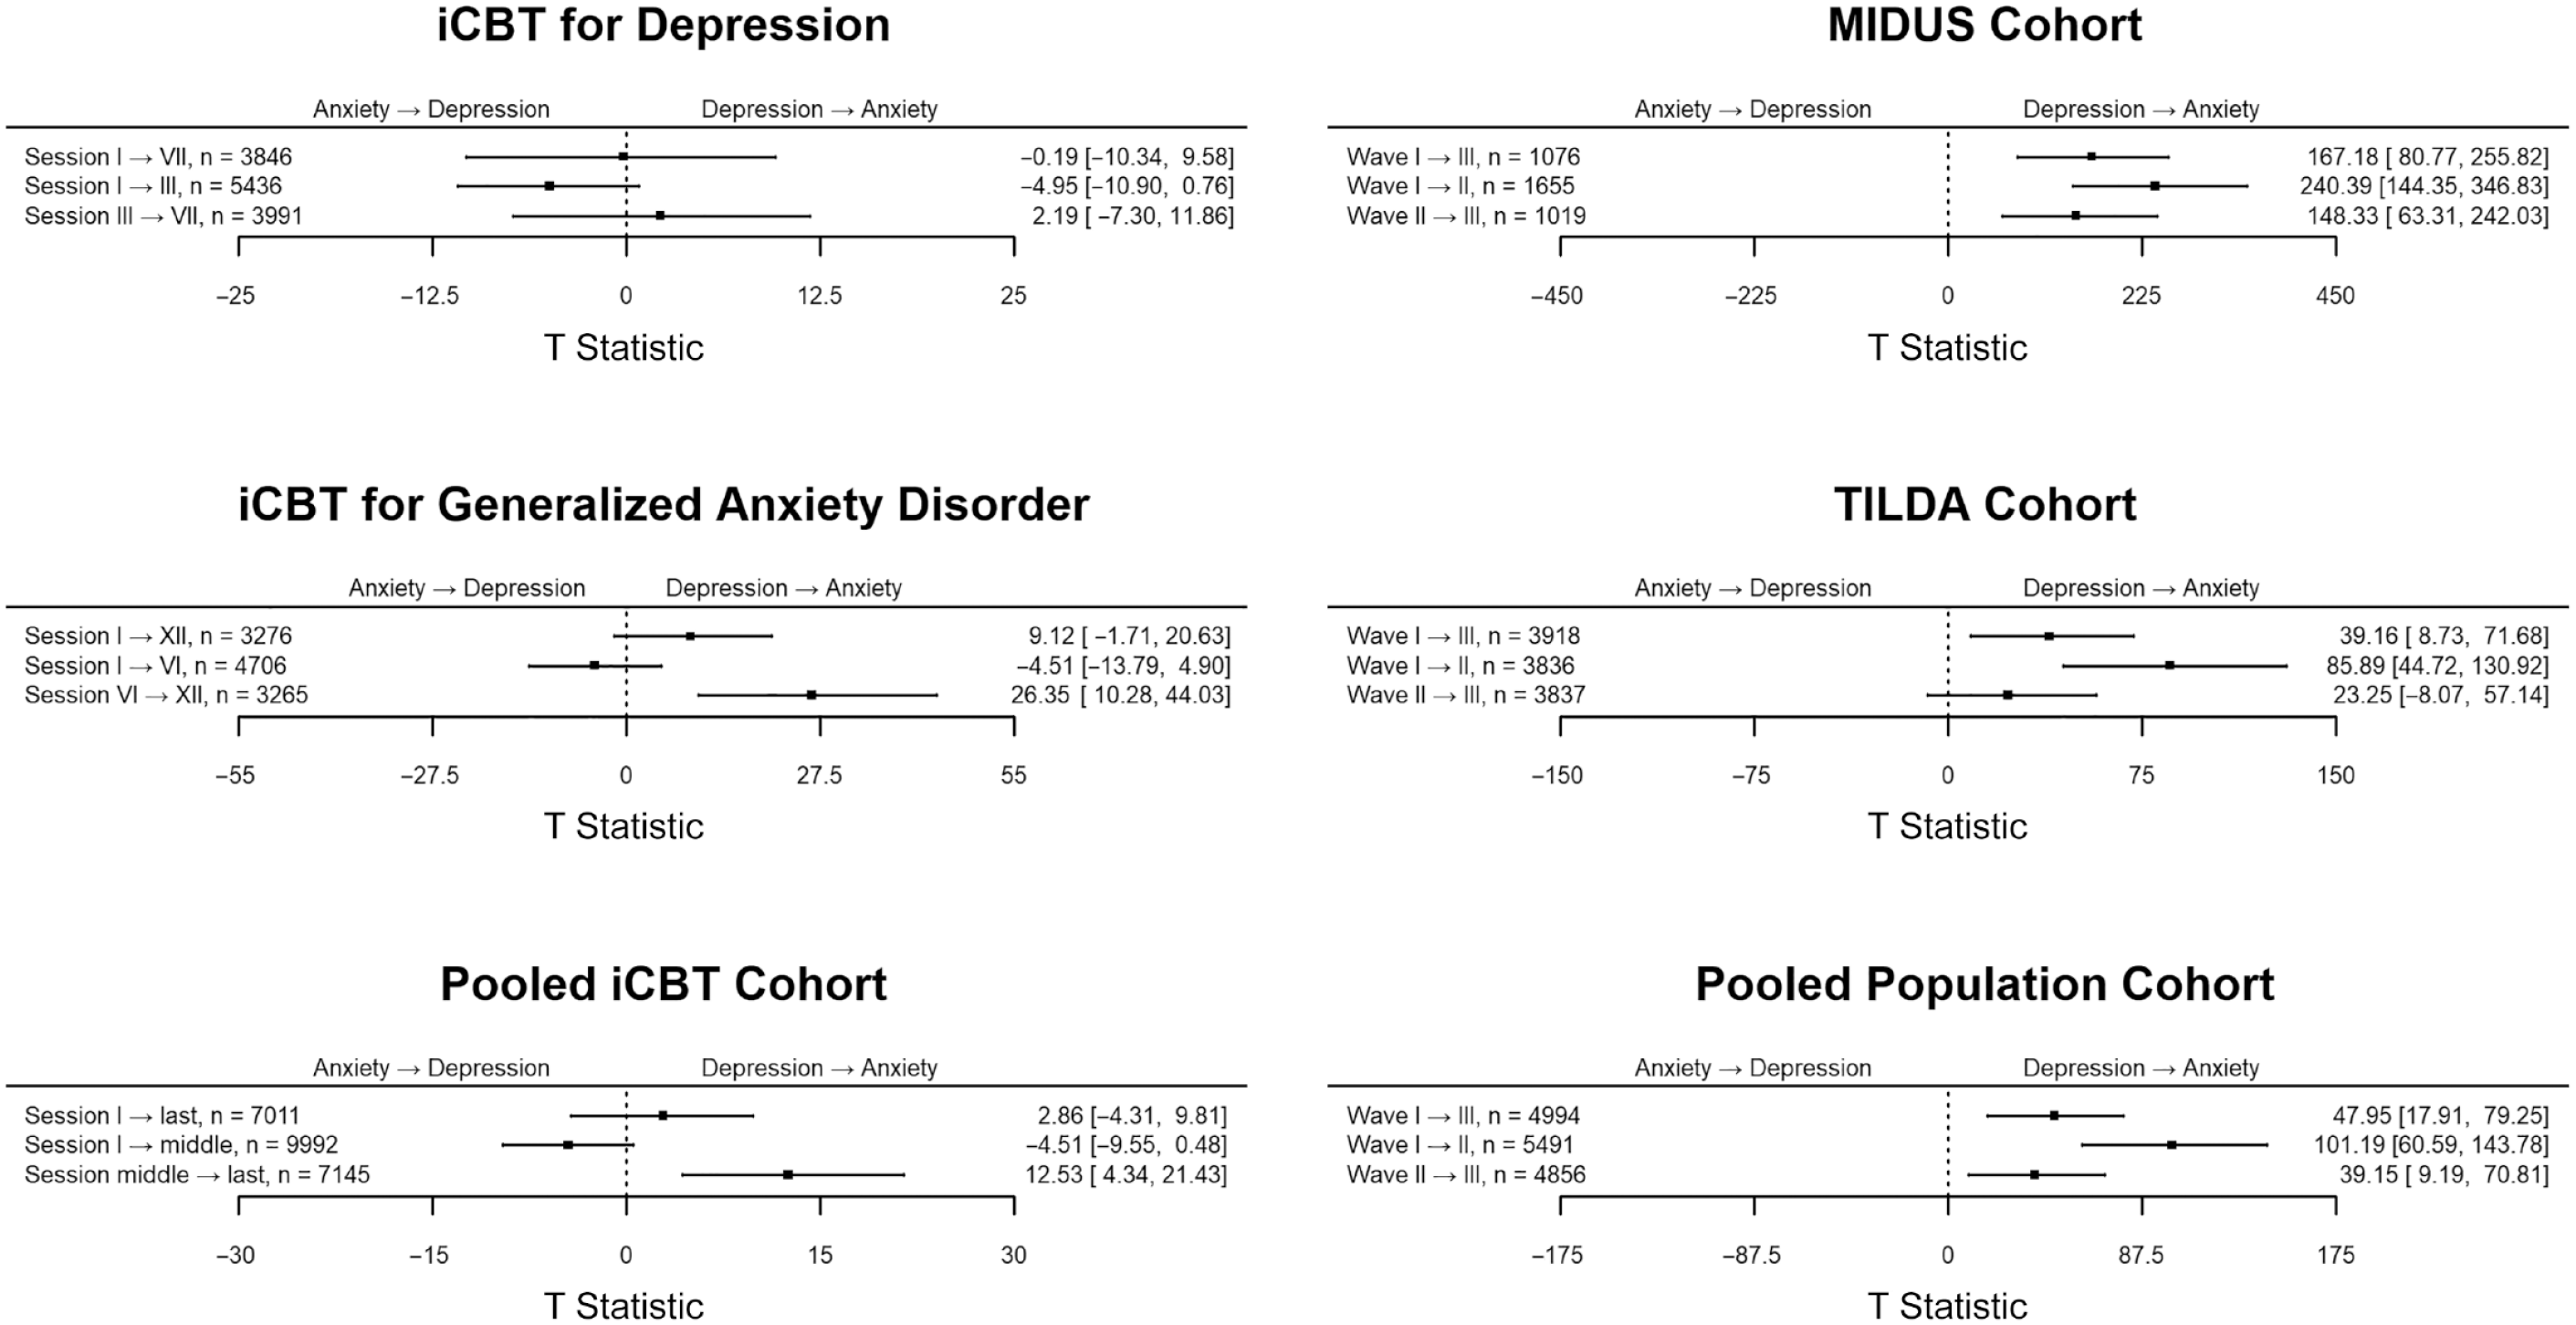
Results of non-Gaussian direction of dependence analyses on causal dominance between depression and anxiety symptoms: T statistic and 95% confidence interval based on 5,000 bootstrap resamples. T statistic > 0 indicates the causal dominance of depression over anxiety symptoms; T statistic < 0 indicates the reverse causal dominance of anxiety over depression symptoms. The original T statistics and their 95% confidence intervals have been multiplied by 103 to facilitate interpretations. The pooled internet-based cognitive-behavioral therapy (iCBT) cohort was formed by combining the individual iCBT data sets. The pooled population cohort was formed by linearly transforming the measurement scales of depression and anxiety symptoms to have the same theoretical maximum value and then combining the data sets.
Regarding the general-population cohorts, depression was consistently found to exert a causal dominance on anxiety throughout measurement waves (βs = 0.36–0.52). This suggested that changes in depression led to corresponding changes in anxiety. The sole deviation from this pattern occurred in TILDA cohort between Waves II and III, in which the T statistic did not deviate from zero. Overall, these results indicated that depression has a primary causal impact on anxiety rather than vice versa in the general population.
Continuous-Time Dynamics Between Depression and Anxiety Symptoms
Supplemental Material 6 in the Supplemental Material presents fit statistics of the four estimated continuous-time vector autoregressive models in iCBT and general-population cohorts. The model comparisons on iCBT cohorts conclusively demonstrated the importance of estimating continuous-time random intercepts, measurement errors, and associations of progress in treatment sessions with the symptoms. The model incorporating all these elements showed superior model fit regarding the highest posterior log-likelihood values and lowest Akaike information criterion. Likewise, in the general-population cohorts, we found superior model fit for the model estimating random intercepts, measurement errors, and nonlinearity between latent processes and symptom scores.
Table 1 presents the results of the best-fitting models for iCBT and general-population cohorts. All parameters for all estimated models are shown in Supplemental Material 7 in the Supplemental Material. When inspecting individual parameters in the iCBT cohorts, we consistently observed bidirectional cross-effects between depression and anxiety symptoms in simpler models that ignored measurement errors and progress in treatment sessions (Tables S7A, S7C, S7E in the Supplemental Material). However, after considering these model elements, both cross-effects shrunk toward zero in all iCBT cohorts, as shown in Table 1 and Figure 4. Only in the pooled iCBT cohort did the very small cross-effect of anxiety on increased depression remain significant with a 95% credible interval (CrI) excluding zero (see the top half of the pooled iCBT cohort in Fig. 4). These results indicated bias in unadjusted cross-effects and a lack of robust support for cross-effects in iCBT cohorts, thereby aligning with the non-Gaussian results.
Main Results of Best-Fitting Continuous-Time Vector Autoregressive Models
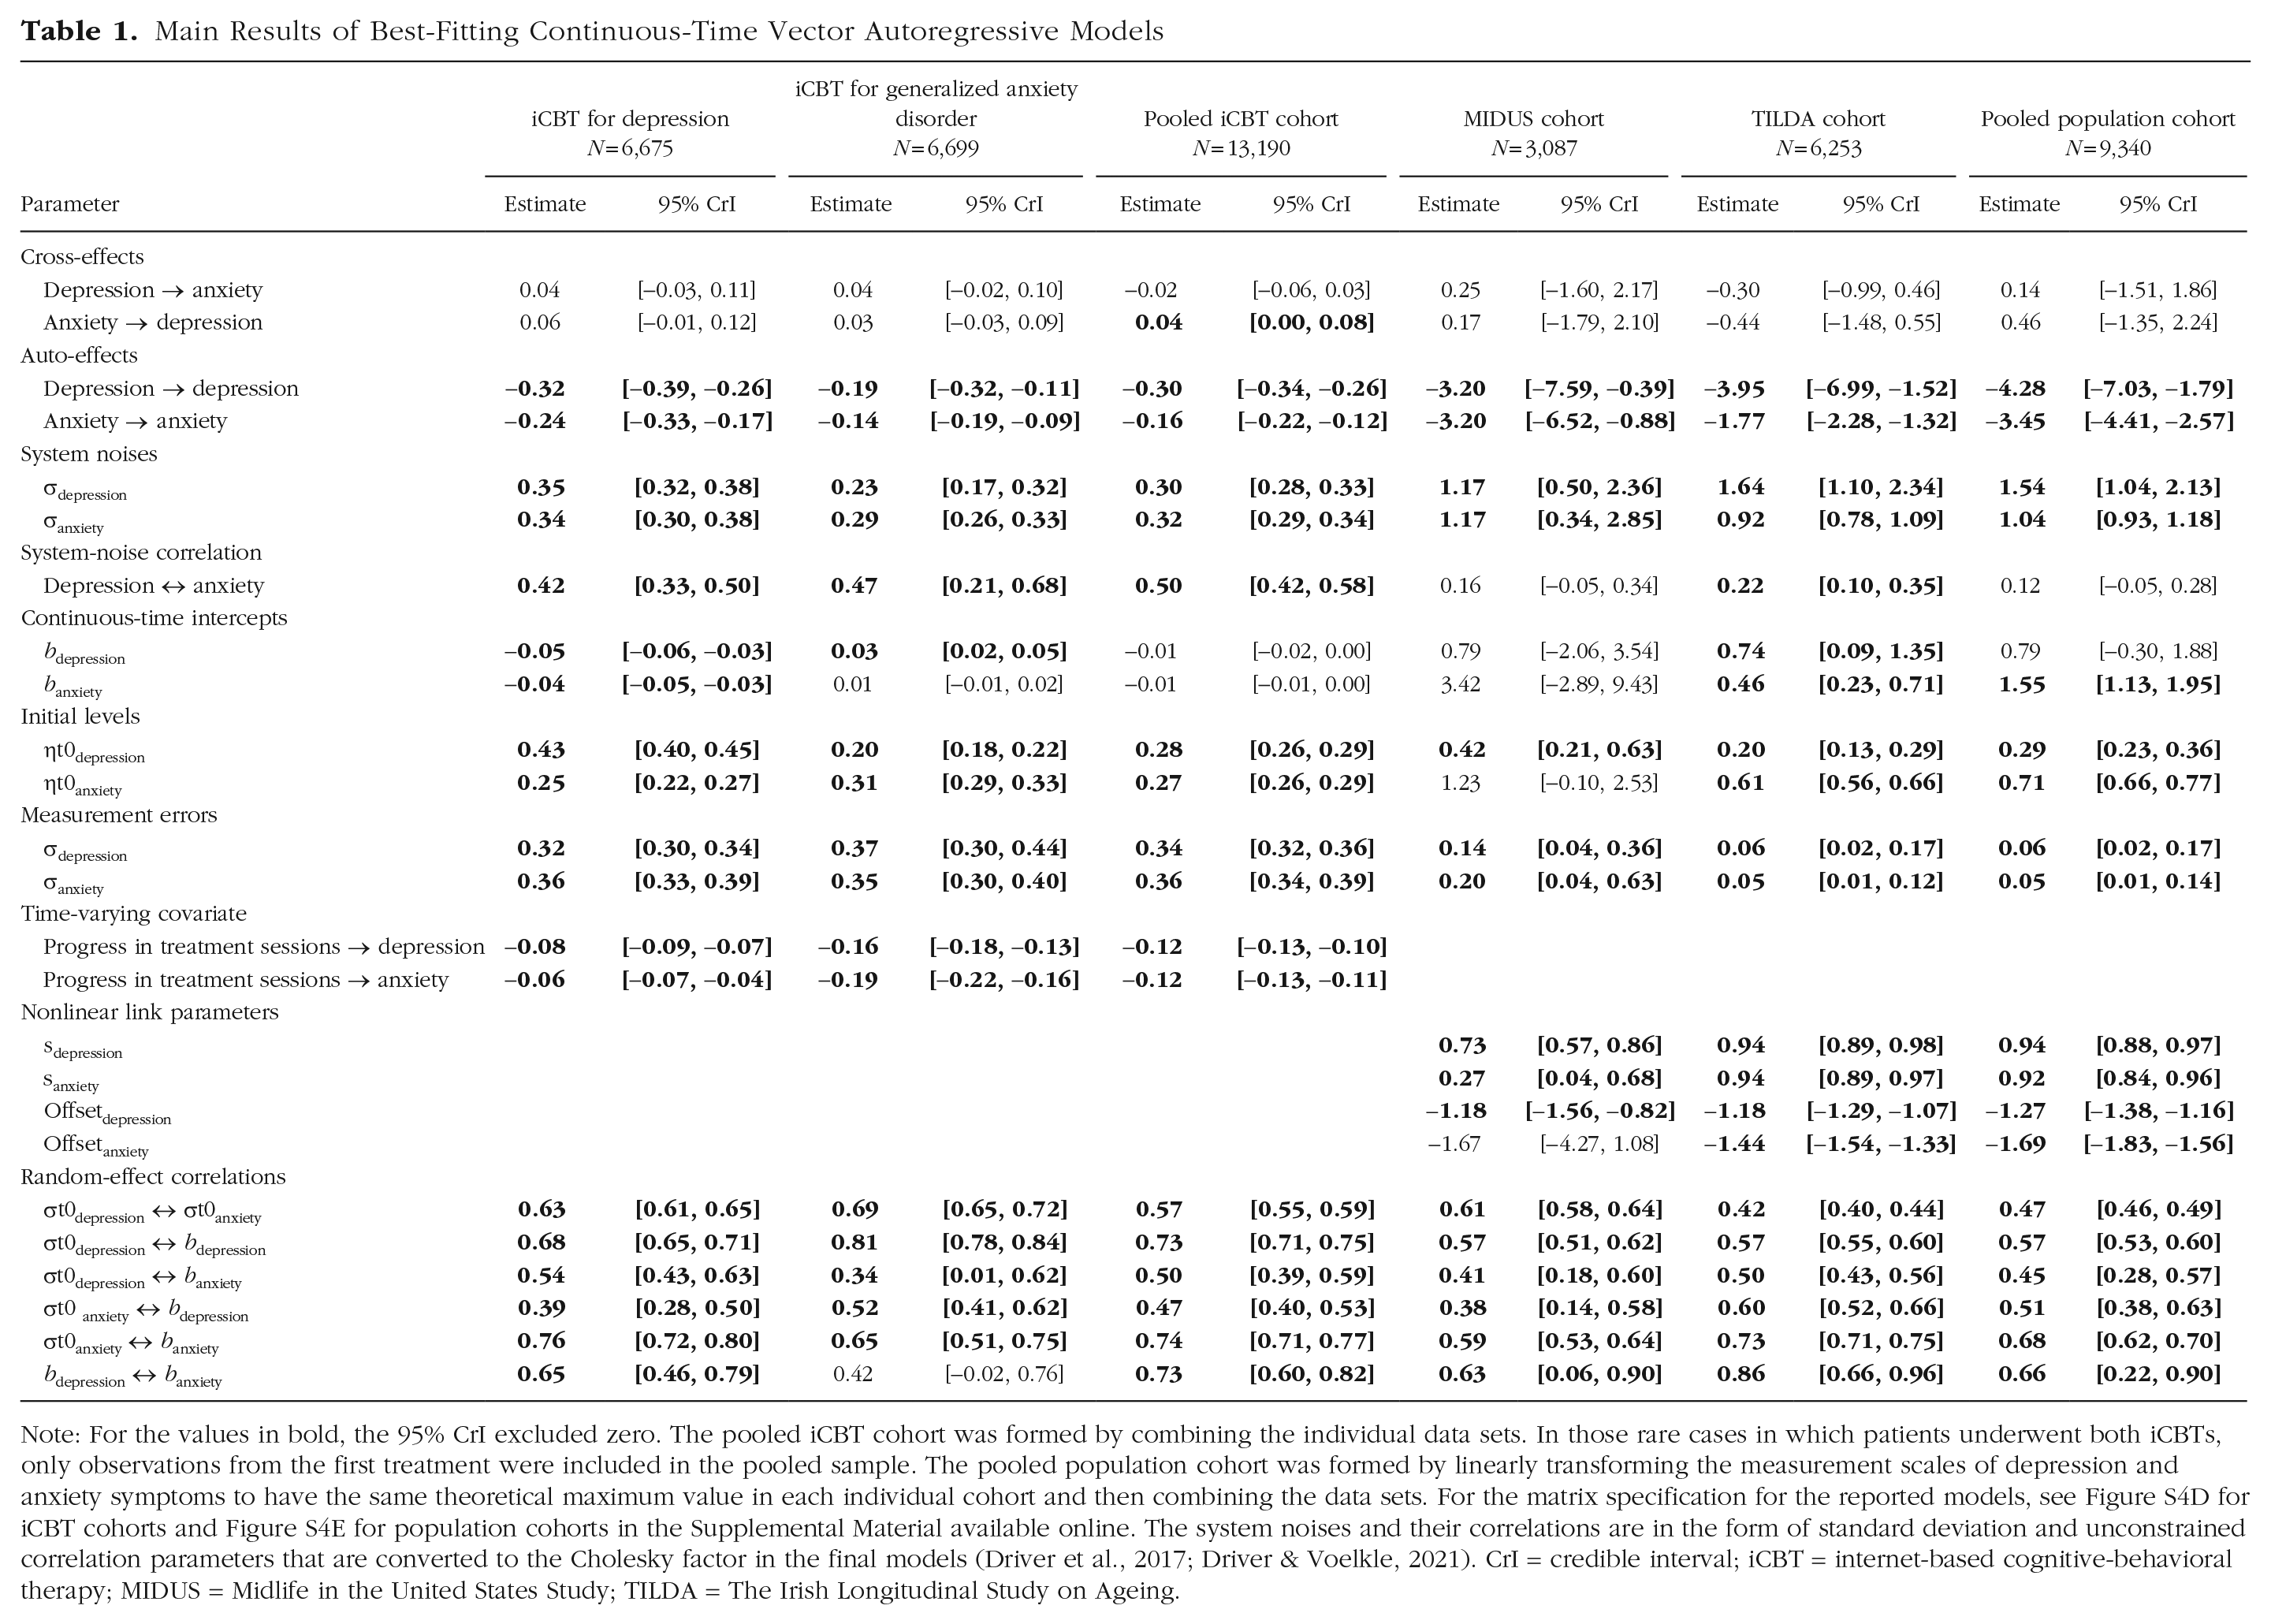
Note: For the values in bold, the 95% CrI excluded zero. The pooled iCBT cohort was formed by combining the individual data sets. In those rare cases in which patients underwent both iCBTs, only observations from the first treatment were included in the pooled sample. The pooled population cohort was formed by linearly transforming the measurement scales of depression and anxiety symptoms to have the same theoretical maximum value in each individual cohort and then combining the data sets. For the matrix specification for the reported models, see Figure S4D for iCBT cohorts and Figure S4E for population cohorts in the Supplemental Material available online. The system noises and their correlations are in the form of standard deviation and unconstrained correlation parameters that are converted to the Cholesky factor in the final models (Driver et al., 2017; Driver & Voelkle, 2021). CrI = credible interval; iCBT = internet-based cognitive-behavioral therapy; MIDUS = Midlife in the United States Study; TILDA = The Irish Longitudinal Study on Ageing.
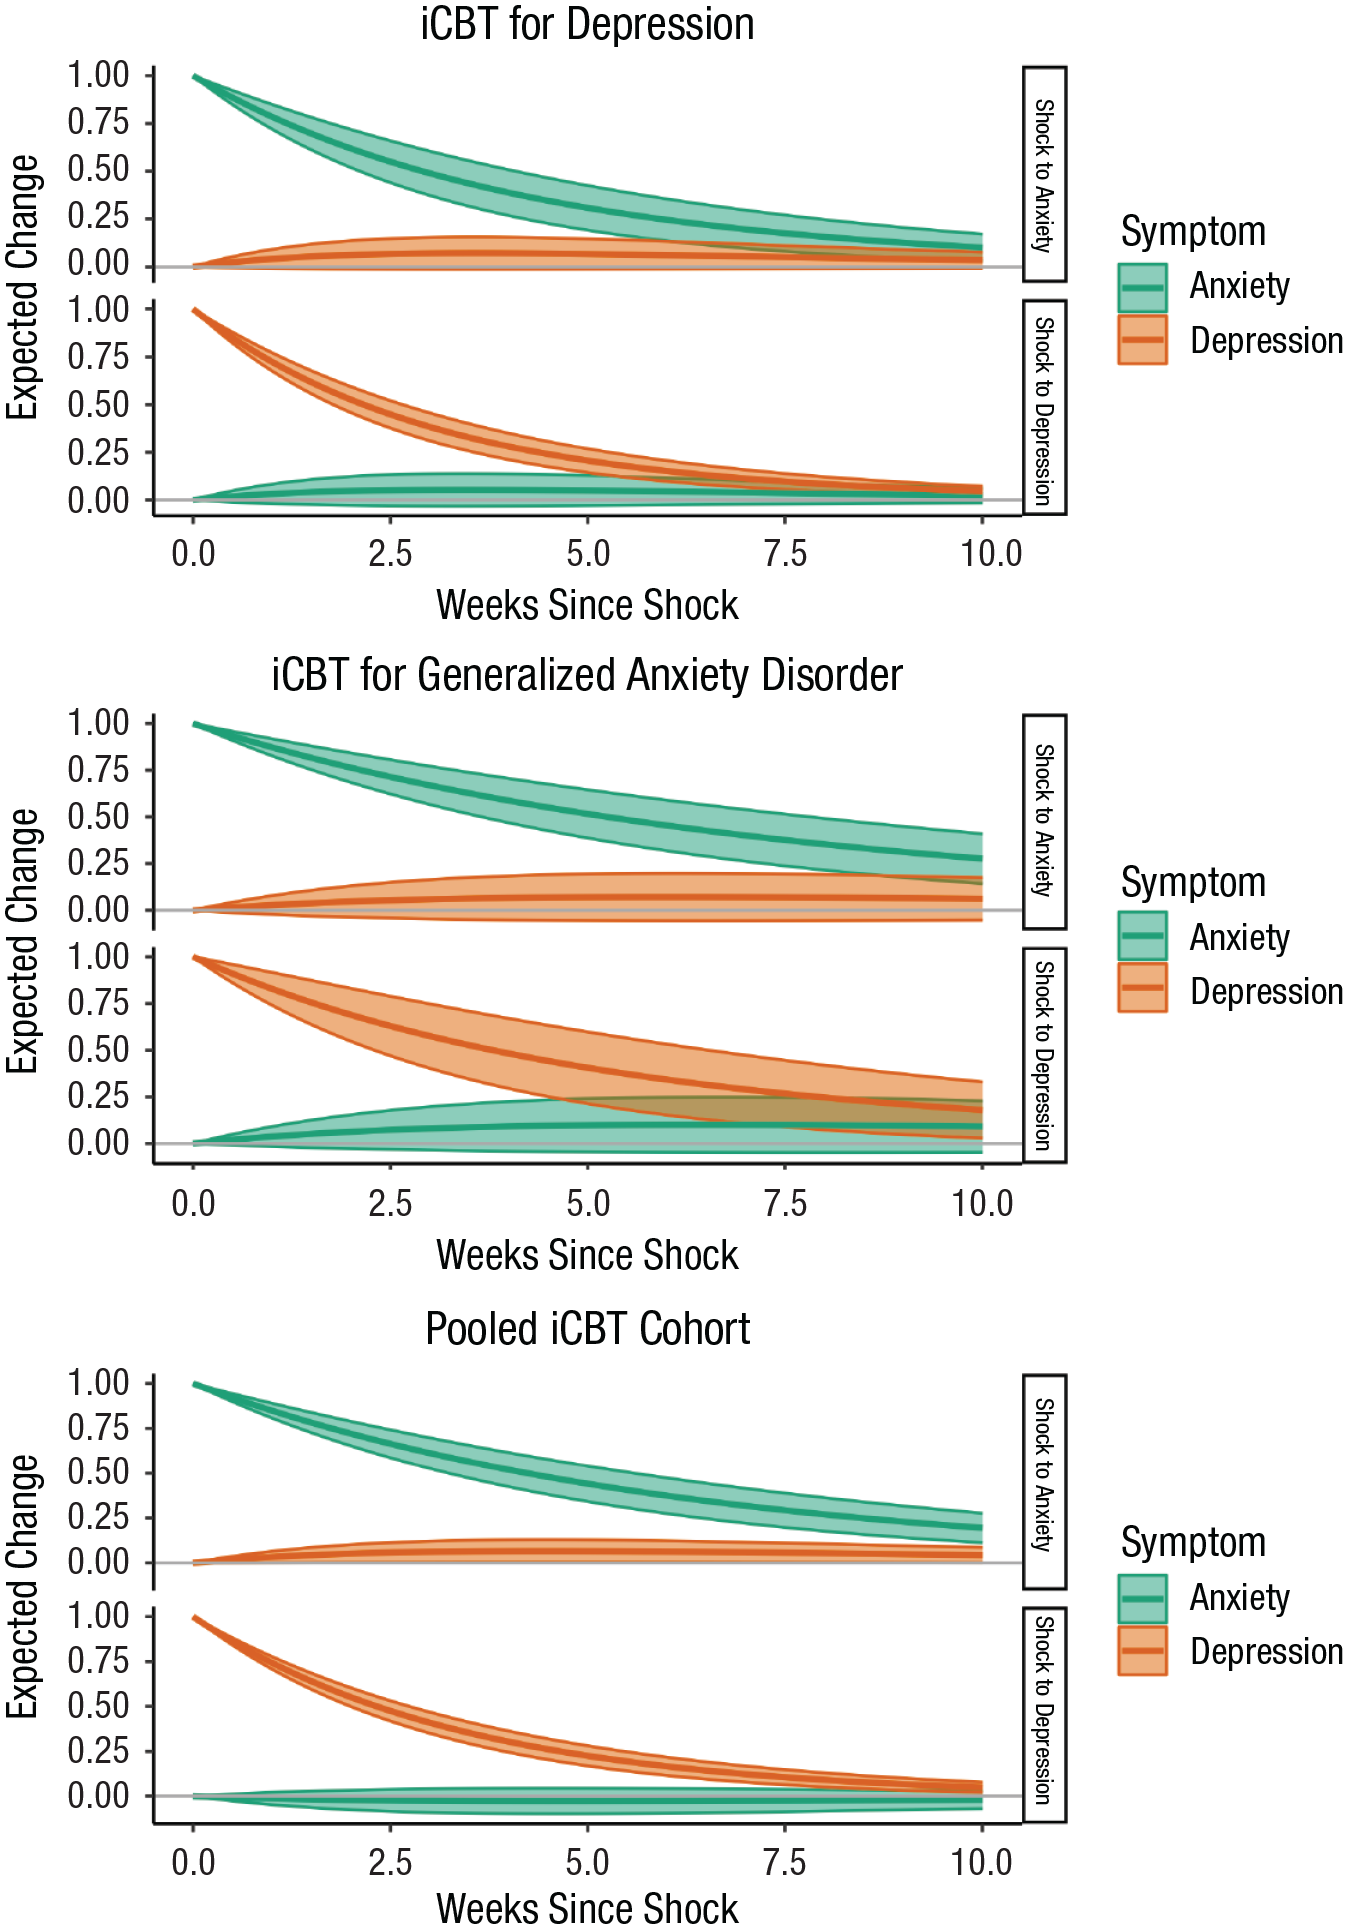
Visualizing cross-effects during treatment: how sudden independent shock on one symptom set affects another. Figures illustrate the hypothetical influence of anxiety on depression (top half of each iCBT cohort) and vice versa (bottom half of each iCBT cohort) if one of the symptom sets receives an independent shock that increases the symptom level by 1.00. The only cross-effect differing from zero according to its 95% credible interval is presented in the top half of the pooled iCBT cohort: Increased anxiety symptoms showed a very small cross-effect on increased depression symptoms. iCBT = internet-based cognitive-behavioral therapy.
Although no robust cross-effects were detected, progress in treatment sessions was associated with a decrease in both depression and anxiety symptoms across the iCBT cohorts. This finding refined our non-Gaussian results, suggesting that iCBT may be one specific shared transdiagnostic factor contributing to both symptoms. However, even after accounting for progress in treatment sessions, a strong correlation persisted between the system noises of depression and anxiety in the iCBT cohorts. This system-noise correlation suggested that unobserved time-varying processes or events influencing one symptom set during iCBTs also affect the other (Driver, 2024a). Alternatively, it might indicate that processes affecting one symptom set often occur concurrently with those affecting the other (Driver, 2024a).
The relationship between the system noises in the iCBTs is further illustrated in Figure 5, showing that when depression symptoms increased during treatment, anxiety symptoms increased in tandem but to a lesser extent and vice versa. The same interpretation applies to symptom reduction. Because of the system-noise correlation in the pooled iCBT cohort, the only observed cross-effect of anxiety on depression could equivalently reflect a condition in which processes causing changes in both depression and anxiety generate longer-term changes in depression than typical depression-triggering processes (Driver, 2024a).
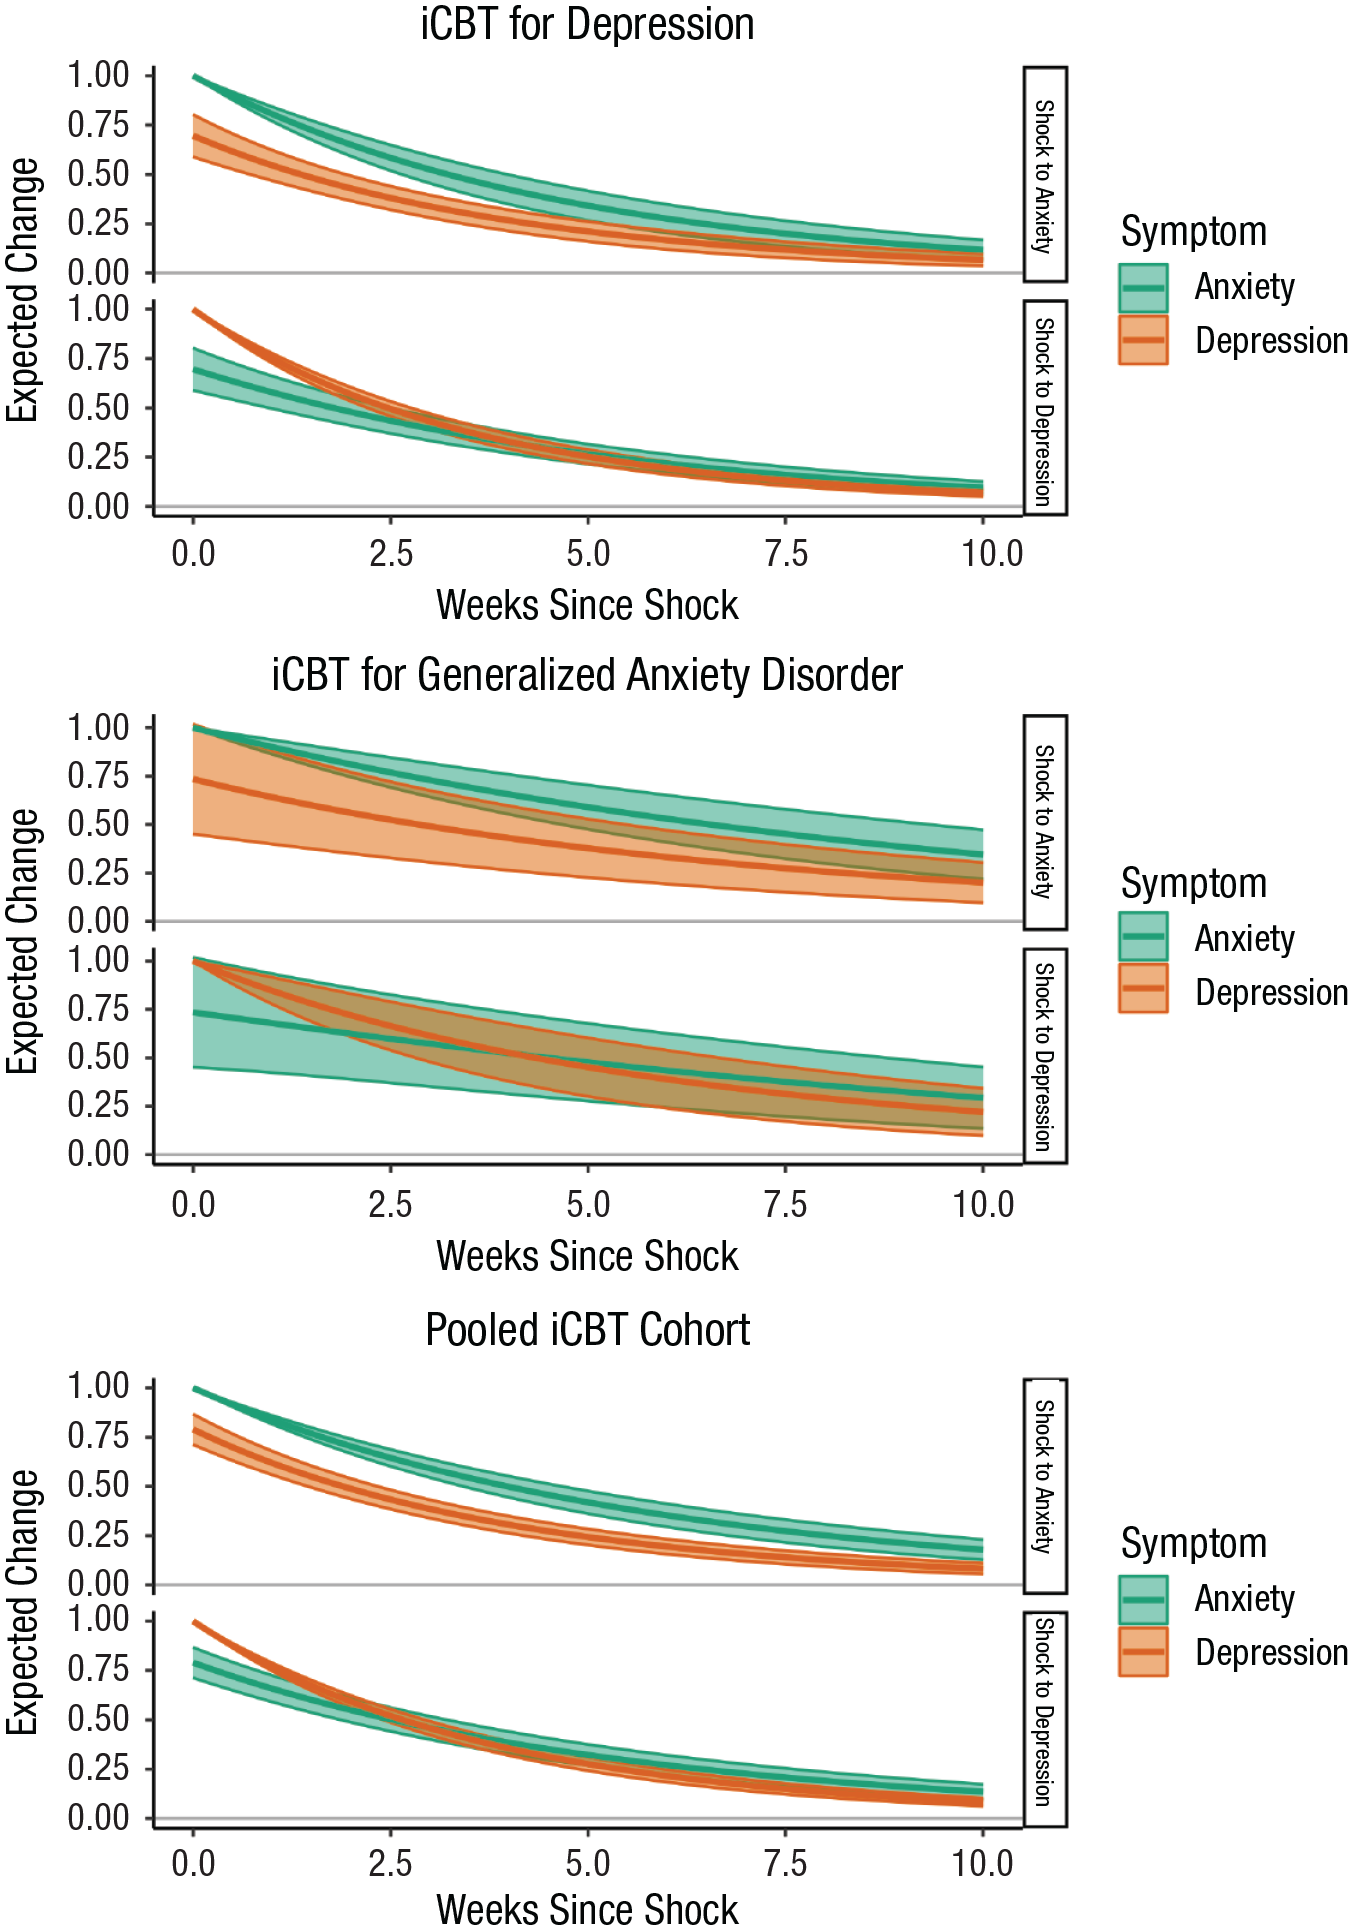
Visualizing system-noise correlations during treatment: effects of hypothetical correlated shocks on changes in both symptom sets. Figures illustrate the hypothetical consequences of system-noise correlation on both symptom sets if either anxiety symptoms (top half of each iCBT cohort) or depression symptoms (bottom half of each iCBT cohort) received a shock that increased the symptom level by 1.00. The hypothetical shock to the other set of symptoms is then in accordance with the estimated system-noise correlation. In all iCBT cohorts, it is evident that when one symptom set increases (or decreases) because of the shock of 1.00 (or −1.00), the other symptom set tends to follow suit and vice versa. Because of larger auto-effects of anxiety than depression symptoms during iCBTs, depression reverted faster to the baseline after perturbations. This can be seen in the cross-over of depression and anxiety lines over time after depression received a shock. iCBT = internet-based cognitive-behavioral therapy.
Finally, high correlations were found between initial levels of depression and anxiety. The initial levels of each symptom set were also strongly associated with their respective continuous-time intercepts and, to a lesser extent, with the intercepts of the other symptom set. In other words, patients who began treatment with higher levels of depression and anxiety tended to maintain elevated symptom levels throughout treatment. Moreover, the continuous-time intercepts of the symptoms showed high correlations, with the exception that the 95% CrI for the correlation between intercepts slightly included zero in the iCBT for generalized anxiety disorder. Overall, these between-persons correlations suggest the existence of shared time-invariant transdiagnostic causes underlying the symptom levels during treatment.
Regarding the general-population cohorts, we found broadly similar results (Table 1). In line with the iCBT cohorts, no evidence was found for the cross-effects (see Fig. S8a in Supplemental Material 8 in the Supplemental Material). Compared with iCBTs, the 95% CrIs for cross-effects were wider across general-population cohorts. This likely reflects the interpolation of infinitesimal effects from the multiyear intervals. Similar to iCBTs, we observed a positive correlation between symptom system noises in TILDA cohort (Fig. S8b in the Supplemental Material). However, in MIDUS and pooled cohorts, the 95% CrIs for the system-noise correlation included zero (Fig. S8b in the Supplemental Material). The most robust results across the general-population cohorts were the high correlations between the random initial symptom levels and symptom intercepts. This corroborates with our iCBT findings, suggesting that shared time-invariant causes play a central role in symptom levels over years and even over decades.
Additional Sensitivity Analyses
As additional sensitivity analyses, we replicated our non-Gaussian models using the Hilbert-Schmidt independence criterion estimator, which is another well-performing non-Gaussian estimator (Rosenström et al., 2023). Supplemental Material 9 in the Supplemental Material presents these results, which showed broadly similar patterns as the primary non-Gaussian results. Supplemental Material 10 in the Supplemental Material contains the results of continuous-time vector-autoregressive models without the priors. The results on iCBT cohorts aligned with our primary models using the weakly informative priors. In the analyses of the general-population cohorts, although we observed estimation challenges when priors were excluded (e.g., parameter instability, increased uncertainty), the overall interpretation of these results did not diverge from our primary conclusions. Thus, overall, the additional non-Gaussian and continuous-time analyses aligned with our primary findings.
Discussion
In this large-scale study, we overcame some methodological limitations of earlier studies on mental-health comorbidities by examining the dynamics between depression and anxiety symptoms both during treatment and in the general population. The iCBT findings converged strongly, providing triangulating evidence from two independent methods across two nationally representative treatment cohorts. The non-Gaussian direction of dependence analyses revealed no compelling support for the causal dominance of either depression or anxiety in driving symptom codynamics. The continuous-time structural equation models further indicated that transdiagnostic time-varying and -invariant processes rather than bidirectional effects between symptoms contributed to symptom changes during treatment. Regarding the general-population cohorts, the estimates of non-Gaussian analyses showed consistent support for the causal dominance of depression over anxiety. The most robust general-population finding in the continuous-time models suggested shared time-invariant causes underlying stable depression and anxiety levels across the multiyear periods.
The converging evidence from our study challenges the prevailing wisdom that suggests bidirectional temporal effects between depression and anxiety symptoms based on earlier discrete-time studies and meta-analyses (Jacobson & Newman, 2017; Lee & Vaillancourt, 2020; Long et al., 2019; Saha et al., 2021). Instead, our findings primarily align with the transdiagnostic perspective, suggesting that shared underlying factors drive the covariation of depression and anxiety (Barlow et al., 2021; Carlucci et al., 2021; Clark & Watson, 1991; Doom et al., 2021; Longley & Gleiser, 2023; Nettle & Bateson, 2012; Southward et al., 2024). In addition, the findings are consistent with research on hierarchical models of psychopathology, indicating that higher-order factors underlie both depression and anxiety symptoms over time (Caspi et al., 2024; Gluschkoff et al., 2019; Rosenström et al., 2019).
Moreover, our non-Gaussian analyses on the general-population cohorts consistently indicated that changes in depression symptoms causally dominated those in anxiety symptoms. This implies unidirectional causality in the general population. Intriguingly, our deeper investigation of iCBT progression revealed a potential shift in which depression symptoms began to exert a dominant influence over anxiety during the latter part of the iCBT program. Over the course of treatment, the primary causal relationship between depression and anxiety may change to align with the primary dynamic observed in the general population. In the general-population cohorts, the use of extended intervals—from years to decades—might have limited the power of continuous-time models to detect the infinitesimal effects. This may explain their divergence from our well-powered non-Gaussian models that demonstrated the causal dominance of depression (Rosenström et al., 2023; Rosenström & García-Velázquez, 2020). Overall, our findings, showing no evidence for bidirectional effects in the iCBT or general-population cohorts, emphasize the critiques of simplified cross-lagged models that can lead to biased estimates and incorrect conclusions when modeling the comorbidities of mental-health issues (Driver, 2024a, 2024b; Oud & Delsing, 2010; Rosenström et al., 2023).
Our other findings resonate closely with the promising data on the efficacy of transdiagnostic interventions that target shared mechanisms of depression and anxiety (Carlucci et al., 2021; Longley & Gleiser, 2023; Southward et al., 2024). This highlights the utility of transdiagnostic approaches that go beyond the diagnostic boundaries. Specifically, our findings suggest that both time-varying and time-invariant transdiagnostic factors contribute to the codynamics of depression and anxiety during treatment and in the general population.
First, in the iCBTs, progress in treatment sessions was linked to a decrease in both symptom sets. This suggests that iCBTs for depression and generalized anxiety disorder may target the shared processes underlying symptom dynamics. Promising candidates responsible for these links include iCBT components, such as exploring dysfunctional thought patterns, fostering self-acceptance, and implementing behavioral activation (Furukawa et al., 2021; Ritola et al., 2022). These components also play central roles in the transdiagnostic CBT models (Carlucci et al., 2021; Sakiris & Berle, 2019; Southward et al., 2024). The decrease in the symptoms may also emerge from factors common to all iCBT components and nonspecific therapy factors (e.g., positive expectations; Watkins et al., 2023). Moreover, the decrease in symptoms likely reflects spontaneous recovery and regression to the mean (our design could not isolate the effects attributed solely to the treatment).
Second, beyond progress in treatment sessions, our findings suggest that other time-varying transdiagnostic processes also contribute to symptom codynamics. Specifically, even after accounting for progress in treatment sessions, we observed a substantial correlation between the system noises of depression and anxiety across the iCBTs. This correlation between time-accumulating random changes in symptoms suggests that the same unobserved processes influencing fluctuations in depression also affect anxiety (Driver, 2024a; Moggia et al., 2023). For instance, one process that may contribute to the cofluctuation of depression and anxiety is ruminating on negative thoughts and events (Watkins & Roberts, 2020). Rumination can intensify negative emotions and foster insecurities, creating vicious circles that may reinforce both depression and anxiety (Tammilehto et al., 2022, 2023). Another possible explanation for the correlated system noise is that processes influencing depression coincide with those affecting anxiety and vice versa (Driver, 2024a; Moggia et al., 2023). Research suggests that rumination often co-occurs with worry, another repeated thought process particularly relevant for triggering and sustaining anxiety (Stade & Ruscio, 2023). Such negative thought processes might serve as one transdiagnostic mechanism through which depression and anxiety concurrently change during treatment. However, in the general population, the system-noise correlation between symptoms was detected in only one of the two cohorts studied, specifically, in TILDA. This stresses the greater caution in extending these interpretations to the general population.
Finally, our robustly replicated finding across iCBT and general-population cohorts was the covariation of the stable symptom levels between individuals. Those exhibiting higher depression exhibited higher anxiety at the beginning and throughout iCBT and general-population follow-ups. This observation corroborates evidence suggesting that shared, time-invariant vulnerability factors play a significant role in the codynamics of depression and anxiety (Daníelsdóttir et al., 2024; Gardner et al., 2019; Kotov et al., 2010; Levey et al., 2020; Rosenström et al., 2019). Thus, our findings align with several prevailing models emphasizing shared personality traits, genetic predispositions, and/or adverse developmental experiences as the underlying causes of long-term symptom levels (Barlow et al., 2021; Clark & Watson, 1991; Doom et al., 2021; Nettle & Bateson, 2012; Rosenström et al., 2019).
Our framework, approximating the ideal of causal triangulation, has significant implications for the research on mental-health comorbidities. Specifically, the key insights from our findings strongly advocate for the use of non-Gaussian and continuous-time modeling techniques over traditional cross-lagged models. These advanced methods provide a more scientifically defensible understanding of comorbidities and are instrumental in informing the development of treatments. By offering more causally informative insights, these approaches can eliminate inferential biases compromising both primary and meta-analytical research on the comorbidity of mental-health issues. Looking ahead, expanding our modeling framework to account for individual differences in cross-effects and system-noise correlations will further refine understanding of the causal processes between depression and anxiety and other comorbid mental-health conditions. Although our study serves as a critical starting point in the application of the presented methodologies to elucidate the mental-health comorbidities, future investigations on variations in symptom dynamics have the potential to uncover factors that explain heterogeneity among individuals. Hence, those deeper explorations could lead to more personalized treatment strategies.
Our study has three main limitations. First, in each iCBT and population cohort, depression and anxiety symptoms were measured only three or four times. Specifically, for the population cohorts, the dynamic continuous-time estimates relied on high-frequency interpolation from intervals spanning years. Thus, replicating our findings using higher-resolution measurements would be valuable. Second, the MIDUS and TILDA designs used less standard measurement and scoring methods for depression and anxiety, which did not align as well with our modeling strategy compared with the standard measures used in iCBTs. Particularly, the content validity of the MIDUS anxiety scale was limited by having only two items. Nonetheless, the general-population cohorts extended the generalizability of our findings to typical nontreatment settings, enhancing the overall impact of our research. Finally, iCBT patients self-reported their depression over the previous 2 weeks, whereas anxiety was assessed for a 1-week time frame. This discrepancy raises uncertainty about whether the cross-effects might have differed if the assessment periods for both symptom sets had been identical.
In conclusion, this large-scale study presents comprehensive and converging evidence regarding paramount processes underlying the dynamics between depression and anxiety symptoms in both clinical and general populations. The findings suggest that the codynamics between depression and anxiety primarily stem from shared transdiagnostic processes and the unidirectional causal primacy of depression over anxiety rather than from bidirectional causation between symptoms. These insights bolster ongoing efforts to enhance transdiagnostic treatment practices and interventions for depression and anxiety. The applied causally informative modeling techniques have substantial potential to contribute to understanding the comorbidity dynamics of mental-health problems.
Supplemental Material
sj-docx-1-cpx-10.1177_21677026241301057 – Supplemental material for Temporal Dynamics Between Depression and Anxiety Symptoms During Internet-Based Therapy and in the General Population
Supplemental material, sj-docx-1-cpx-10.1177_21677026241301057 for Temporal Dynamics Between Depression and Anxiety Symptoms During Internet-Based Therapy and in the General Population by Jaakko Tammilehto, Suoma E. Saarni, Jan-Henry Stenberg, Ville Ritola, Grigori Joffe, Markus Jokela and Tom H. Rosenström in Clinical Psychological Science
Footnotes
Acknowledgements
We thank Alasdair I. Houston, Sanna Mylläri, Sakari Lintula, and Veera Malkki for their insightful comments on earlier drafts of this article. The funders have no role in the design and conduct of the study or collection, management, analysis, and interpretation of the data.
Transparency
Action Editor: Pim Cuijpers
Editor: Jennifer L. Tackett
Author Contributions
Notes
References
Supplementary Material
Please find the following supplemental material available below.
For Open Access articles published under a Creative Commons License, all supplemental material carries the same license as the article it is associated with.
For non-Open Access articles published, all supplemental material carries a non-exclusive license, and permission requests for re-use of supplemental material or any part of supplemental material shall be sent directly to the copyright owner as specified in the copyright notice associated with the article.