
Abstract
Resilience can be conceptualized as a network of interacting mental-health constructs characterized by weak autoconnections and/or interconnections. We investigated whether positive appraisal style (PAS), the ability to bounce back or recover from stress (BRS), age, education level, and urbanization grade can confer such desirable network properties within a network comprising depression, anxiety, loneliness, and mental well-being. Longitudinal data (five time points during the COVID-19 pandemic) were derived from a sample of older adults (N = 1,270, 55+). Individuals who were 67 or older, highly educated, or scored high on PAS and BRS exhibited more resilient network dynamics and generally better overall mental-health outcomes. Findings pertaining to urbanization grade and the (subgroup-dependent) dynamics among the mental-health constructs are also discussed. These findings may inform theorizing and interventions aimed at resilience during a challenging life phase.
Keywords
Older adults are confronted with many challenges and transitions that, if not managed and regulated adequately, may lead to significant declines in mental health and (subsequently) in their well-being and quality of life (Hayman et al., 2017; Hildon et al., 2010). Accordingly, successful aging has been linked to an individual’s ability to demonstrate resilience: effective adaptation to difficult or challenging (late) life experiences (e.g., Greve & Staudinger, 2006; MacLeod et al., 2016). This raises the important question of what factors determine older adults’ capacity for resilience. To address this, in the present study, we investigated how two (resilience-related) trait factors (i.e., general ability to bounce back from stress and the use of positive appraisal as a coping strategy) and three demographic variables (i.e., age, education level, and urbanization grade of one’s living environment) can affect mental well-being, anxiety, depression, and loneliness among older adults in the Netherlands throughout the first phase of the COVID-19 pandemic. The pandemic encompasses a shared adverse life phase that has previously been associated with negative overall mental-health outcomes among older adults (e.g., increased levels of depression, loneliness, anxiety; e.g., Krendl & Perry, 2021; Robb et al., 2020; van Tilburg et al., 2020) and therefore offers a unique opportunity to explore potential correlates of resilience in times of adversity. In the present study, we examined the impact of these demographic and trait factors on overall mental-health scores and how these changed throughout the first phase of the pandemic. Moreover, we adopted an innovative network approach to enable a more fine-grained analysis of resilience. Here, variables/constructs are modeled as (dynamically) interacting nodes (Kalisch et al., 2019) to reveal (potential) causal pathways and (inter)dynamics between the four mental-health constructs and assess network properties that may confer resilience. This combined approach allowed us to explore the extent to which relevant characteristics and predispositions may, at least on average, contribute to resilience in later life and protect older individuals from (lasting) dysfunction.
Resilience and Its Manifestation Within a Network of Mental-Health Symptoms or Constructs
Individuals can be considered resilient if they manage to maintain a good (mental) health status (e.g., minimal depressive symptoms, high mental well-being) and/or quickly bounce back to a healthy state after facing adversity (e.g., Netuveli et al., 2008). Both can prevent a cascade of changes that may cause (chronic) mental-health problems (over time). The conventional approach of evaluating older adults’ mental-health status and how this may change in the face of adversity can give a general idea of the capacity for resilience. However, scrutinizing the micro-level dynamics can enhance the comprehension of the underlying mechanisms of resilience to potential maladaptive transitions into a state of mental disease.
Resilience to such transitions because of the action of external perturbators (e.g., environmental stressors, such as COVID-19-related perturbators) can be studied using dynamic-network-modeling approaches (e.g., Kalisch et al., 2019). Here, resilience is conceptualized as a network of (mental health) symptoms (i.e., reflected in negative or positive partial correlations with differential strengths). Each of these symptoms may be activated by external events and subsequently affect other symptoms. In this perspective, a state of mental disease can arise from the causal, temporal interactions of symptoms in a network. However, in case of high resilience, the network state is expected to remain robust against external perturbations and thus maintain a relatively stable state of mental health in the face of adversity. Generally, high-resilient networks feature weak symptom autoconnections (i.e., the extent to which a symptom tends to consolidate its own activation) and/or weak symptom-symptom connections. If symptoms have weak autoconnections, temporary activation will return to equilibrium relatively quickly, which reduces their self-reinforcing impact. With weak symptom interconnections, activation of one symptom does not easily spread to other symptoms. In contrast, in low-resilient networks featuring strong auto- and interconnections, a single perturbation may affect the overall network state. Symptom activation reconsolidates over time and amplifies other symptoms, which impedes the return to the initial equilibrium state (Scheffer et al., 2009). Network activation may even be preserved when the perturbator is no longer at play, potentially bringing individuals closer to the tipping point beyond which even small perturbations may suffice to incur a transition into a state of mental disease (Borsboom & Cramer, 2013; Pe et al., 2015; van de Leemput et al., 2014). From this perspective, resilience is the magnitude of perturbation that individuals can tolerate before they transition from one state into another (Hayes et al., 2015); individuals who exhibit densely connected networks are more vulnerable for transition. Hence, such networks may reveal susceptibility to a negative transition, even in the absence of current mental-health issues, and therefore assist in making more reliable predictions about who may or may not be able to recuperate from (endured) stressors encountered during a certain life phase (e.g., the COVID-19 pandemic). The phenomenon of fragility of a network of symptoms has previously been studied in the context of depression, for which increased auto- and interconnections have been identified as early-warning signals for its onset (e.g., Helmich et al., 2021; Scheffer et al., 2009; van de Leemput et al., 2014). In the current study, instead of examining the dynamics between symptoms related to one specific psychopathology, we evaluate the manifestation of resilience in a network that comprises nodes of overall depression, anxiety, loneliness, and mental well-being (referred to as “mental-health constructs” rather than “symptoms”), reflecting the overall mental-health status. This can help to improve the understanding of the causal pathways to comorbid mental-health problems and thereby facilitate early identification and management thereof (Arango et al., 2018). Such imperative questions cannot be answered when evaluating construct trajectories in isolation, emphasizing the utility of network analysis in this matter.
Factors That Could Confer Desirable (Resilient) Network Properties
To determine which subgroups are more or less vulnerable to (lasting) dysfunction, it is crucial to identify the characteristics or predispositions that could confer the aforementioned desirable (resilient) network properties (Kalisch et al., 2019). Resilience research has already identified a wide range of factors that may enhance successful adaptation in the face of adversity (Greve & Staudinger, 2006; MacLeod et al., 2016). A strong and well-established resilience factor is “coping,” referring to the cognitive emotion-regulation and behavioral efforts implemented to deal with demands of situations when these are appraised as taxing or exceeding one’s resources (Endler & Parker, 1990; Lazarus & Folkman, 1984). The deployment of a specific subset of cognitive emotion-regulation strategies has been summarized as having a positive appraisal style (PAS), which has been claimed to be key to resilience (Kalisch et al., 2015b). It is conceptualized as the generalized tendency to appraise potentially threatening or stressful situations in a nonnegative fashion and has been shown to positively predict good mental health (Veer et al., 2021) also among older adults during the COVID-19 pandemic (Brinkhof et al., 2021). Another resilience factor is the generalized ability to bounce back or recover from stress (BRS), as assessed with the Brief Resilience Scale (Smith et al., 2008). BRS scores reflect one’s own assessment of the way in which one typically reacts to difficult and challenging situations and has been found to positively relate to psychological well-being and negatively to anxiety and depression (Chmitorz et al., 2018; De Pue et al., 2021).
Demographic characteristics may also affect older adults’ capacity for resilience. Higher education levels have been associated with reduced mental-health risks (Lund et al., 2018), protection against depression and anxiety during COVID-19 (Fancourt et al., 2021; Knolle et al., 2021), and the ability to embrace new opportunities and mitigate deleterious effects in the aftermath of a large-scale disaster (Frankenberg et al., 2013). Age may also be protective given that individuals tend to acquire knowledge and emotion-regulation skills as they grow older. This may render the oldest individuals more equipped to cope with COVID-19-related challenges than younger individuals (Fuller & Huseth-Zosel, 2021; Lind et al., 2021; Wilson et al., 2020). Indeed, (older) age has been positively related to resilience and mental-health outcomes (e.g., lower rates of anxiety, depression, and loneliness) in previous COVID-19 studies (González-Sanguino et al., 2020; Palgi et al., 2020; van Tilburg et al., 2020; Wilson et al., 2020).
When dealing with adversities, older adults may also rely on external factors, such as intimate and profound social interactions or green spaces (Netuveli & Blane, 2008; van den Berg et al., 2010; Wells, 2010; Wu et al., 2015). Both have been found to be more common in rural than in urban areas (Beggs et al., 1996; Henning-Smith et al., 2019; Maas et al., 2006). Indeed, better mental-health outcomes have been observed among older adults living in rural areas (Motoc et al., 2019; Scharf & de Jong Gierveld, 2008; van Tilburg et al., 2020; Walters et al., 2004).
From our resilience-network perspective, in principle, adaptive resilience factors and beneficial demographics may act either on specific mental-health constructs (e.g., depression or anxiety), thus dampening the potential effects of external stressors on these constructs (i.e., lower overall scores), or the interconnectedness of constructs, or both. Thus, by “scaffolding” network dynamics, such factors may reduce the likelihood of mental balance being disrupted and thereby render older adults more equipped to endure perturbations.
Current Study
The aim of the current study is to understand the complex and dynamic processes of adaptation in the face of adversity (i.e., early phase of the COVID-19 pandemic) among senior citizens. In addition to evaluating the scores of each mental-health construct over time (i.e., conventional approach), we characterize resilience in a mental-health-construct network in which weakly connected networks are considered more resilient (Cramer et al., 2016; Kalisch et al., 2019). These networks are constructed using longitudinal data (five time points over a period of 10 weeks). We investigate to what extent PAS, BRS, education level, age, and urbanization grade affect the temporal dynamics (independent from the contemporaneous and between-subjects effects) among mental well-being, anxiety, depression, and loneliness in a sample of healthy older adults (N = 1,270, age 55+). By subgrouping each of these variables and comparing their networks, we aim to establish which of these characteristics or predispositions promote network properties of high resilience. This innovative approach may also reveal unsuspected dynamics between the mental-health constructs and/or subgroup differences therewithin that other studies that used more traditional analysis techniques were unable to unveil.
We hypothesized that high BRS and PAS, high education level, old age, and low urbanization grade (i.e., residing in rural areas) would have positive effects on all mental-health indicators and their underlying dynamics, as reflected in relatively weaker auto- and interconnections among mental-health variables. We have no strong a priori hypotheses regarding the (directionality of) specific (subgroup dependent) relationships among the mental-health outcomes, and these will, therefore, be assessed in an exploratory fashion.
Transparency and Openness
This study was not preregistered because of its explorative approach. Supplements A, B, C, and D in the Supplemental Material are available online. The data that support the findings of this study are openly available on OSF at https://osf.io/qu7p2/. R code is available at https://doi.org/10.21942/uva.21618351. We report how we determined our sample size, all data exclusions, all manipulations, and all measures in the study. The study was approved by the local ethics committee of the University of Amsterdam (2020-SP-12194) and was conducted in accord with relevant laws and institutional guidelines. This study was not carried out in accordance with the provisions of the World Medical Association Declaration of Helsinki because it is not preregistered. Informed consent was obtained from all subjects involved in the study.
Method
Sample characteristics
Data were part of a longitudinal COVID-19 study (Chambon, Dalege, Elberse, & van Harreveld, 2022; Chambon, Dalege, Waldorp, et al., 2022; Chambon et al., 2023) that was approved by the Ethics Review Board of the University of Amsterdam (2020-SP-12194). Participants were recruited via the panels of the market-research company Ipsos and asked to complete a survey five times (T1–T5) over a period of 10 weeks (April 23, 2020–June 30, 2020; approximately every 2–3 weeks; for an overview, see Table SA1 in the Supplemental Material). In total, 2,449 participants completed all five surveys (3,770 participants dropped out early, of which 191 because of failed attention checks 1 ).
All participants who completed all five surveys, did not have missing values for our variables of interest (total n with missing values = 15), and were 55 years or older were included in the current study. This resulted in a sample of 1,270 older adults; mean age = 66.4 years (SD = 6.63; range = 55–89; 49.4% females). Participants were split into two groups for the analyses according to their age (< 67, young-senior: n = 643; ≥ 67, old-senior: n = 627 2 ). Most participants (60.2%) reported to have finished secondary (medium; high school and junior college) education, and 36.1% indicated to have finished higher education (n = 459; college or university). Only a small percentage (3.6%) indicated primary (lower) education as highest completed education level and was, therefore, combined with the medium-education group for the analyses (n = 811). The self-reported degree of urbanization (or “urbanization grade”), as scored on a 7-point scale from (1) not urban at all to (7) very urban (Brinkhof et al., 2022), was distributed relatively equally. Most participants were living in the western part of the Netherlands, in more urban areas (M = 4.48, SD = 1.85). Three categories were distinguished according to these urbanization-grade scores: low urban/rural (1 and 2, n = 364), midurban (3–5, n = 587), and high urban (5 and 6, n = 319). Data on participants’ racial/ethnic identification were not collected.
Materials
All materials included in the experimental design are reported and described in Chambon et al. (2023). For the current study, only a small subset of variables (relevant to resilience) was selected to ensure networks of high stability and allow for the subdivisions of groups of our interest.
Repeated measures
Mental well-being
The Short Warwick Edinburgh Mental Well-Being Scale (SWEMWBS; Tennant et al., 2007) was used to assess mental well-being (seven items; αs = .82–.86). The scale has good construct validity and has been shown to highly correlate with the full Warwick Edinburgh Mental Well-Being Scale (Tennant et al., 2007). All items were scored on a 5-point Likert scale from (1) never to (5) always, and a sum score was calculated (range = 7–35); higher scores indicate higher mental well-being. These scores were converted to metric scores (logit-transformation), as required for the SWEMWBS (Stewart-Brown et al., 2009).
Depression and anxiety
The Brief Symptom Inventory 18 (BSI-18; Derogatis, 2001) was used to assess depressive (six items; αs = .89–.93) and anxiety (six items; αs = .92–.94) symptoms. To meet the objectives of this study, the answer scale of the BSI-18 was altered to a 5-point Likert scale from (1) not at all to (5) very much, and a time frame of 2 weeks was specified in the items. Because this may invalidate the norm scores of the BSI, we used scores only as derivative of the severity of symptoms and refrained from clinical classifications. Higher average scores (per construct) were indicative of more severe symptoms.
Loneliness
Loneliness (six items; αs = .77–.84) was measured with a shortened version of the loneliness scale from de Jong Gierveld and van Tilburg (2008), which has been shown to be a valid and reliable instrument for overall, emotional (i.e., missing intimate relationships), and social loneliness (i.e., missing a [wider] social network; de Jong Gierveld & van Tilburg, 2006). Again, the answer scale was adjusted to a 5-point Likert scale from (1) not at all to (5) very much, and a time frame of 2 weeks was specified. The three negatively worded items (reflecting social loneliness) were reverse-scored, and all six items were averaged to a total score; higher scores indicate more overall loneliness. Subsequently, an emotional and social subdimension score was calculated as well.
One-time measures
BRS
A Dutch translation of the Brief Resilience Scale was used to assess BRS (Leontjevas et al., 2014; Smith et al., 2008). The scale consists of three positively and three negatively worded items (α = .85), and all items were scored on a 5-point Likert scale from (1) strongly disagree to (5) strongly agree. The negative-worded items were reverse-coded, and all items were averaged to a total ranging from 1 to 5; higher scores reflect higher BRS. For the panel-network models, BRS subgroups were distinguished by separating individuals into three groups according to intervals containing an (approximately) equal number of observations, as far as possible given that tied values were assigned to the same subgroup. This resulted in low (< 3.17, n = 462), medium (3.17–3.83, n = 423), and high (> 3.83, n = 385) BRS subgroups.
PAS
A total of 10 items (α = .84) of the Positive Appraisal Style Scale (14 items in total; Veer et al., 2021) were used to assess positive-appraisal content and processes, indicative for one’s PAS. These 10 items were all derived from the Cognitive Emotion Regulation Questionnaire-Short (18 items in total; Garnefski & Kraaij, 2006) and covered the following subscales: positive reappraisal, acceptance, putting into perspective, refocus on planning, and positive refocusing. Items were scored on a 5-point Likert scale from (1) (almost) never to (5) (almost) always, and the average of all items was calculated. Higher scores were indicative of stronger (employment of) PAS as a coping strategy. PAS subgroups for the panel-network models were created using a similar approach as described for BRS, resulting in low (< 3.6, n = 513), medium (3.6–4, n = 432), and high (> 4, n = 325) PAS subgroups.
Statistical analyses
All statistical operations were performed in R (Version 4.1.2; R Core Team, 2021); alpha set at .05 unless otherwise stated.
Mental-health indicators: changes over time and main effects of grouping factors
Repeated measures analyses of variance (ANOVAs) were used to determine whether mental well-being, depression, anxiety, and loneliness changed over time and whether this differed between the subgroups of age, education level, urbanization grade, BRS, and PAS. Main effects of the grouping factors on the mental-health indicators were evaluated by performing five one-way ANOVAs. In case of more than two levels, pairwise t tests with Bonferroni correction were performed to determine subgroup differences.
Panel-network models
To evaluate the interrelated effects of our main outcome variables, we estimated several panel-network models to distinguish fixed effects (i.e., temporal and contemporaneous) from between-subjects effects among the entire sample and certain subgroups (e.g., age, urbanization grade; tifkamp, 2020). Temporal effects were calculated by regressing each variable on all variables (including itself) from the previous measurement (i.e., lag-1), resulting in partial correlation coefficients that are indicative of directed predicted effects. A temporal network thus comprises directed edges (with arrows) that illustrate whether each node predicts other nodes in the next measurement (i.e., from wave Tx to wave Tx+1) while taking into account all other nodes. The variances and covariances that cannot be explained by the modeled temporal effects are captured in contemporaneous networks (i.e., undirected partial correlations between nodes in the same window of measurement). This allows for the identification of potential causal relationships that occur much faster (e.g., only a matter of minutes) than the lag interval (i.e., 2–3 weeks) and are thus not captured in the temporal network. Finally, the networks formed on the between-subjects level comprise edges that are indicative for the undirected partial correlations between the stationary means of the subject’s scores within the overall time span of measurement.
Panel-lvgvar models were fitted using the psychonetrics package in R (Version 0.10.2), and networks were visualized using the qgraph package in R. Using full information maximum likelihood estimation, a model was estimated in which all network structures were fully saturated (i.e., all edges included). These residual structures were modeled as variance-covariance matrices. All edges that were not significant at α = .01 were fixed to zero (i.e., conservative pruning), after which the model was reestimated. Subsequently, stepwise model search was performed to find a model with an optimal Bayesian information criterion. Finally, temporal effects were standardized to partial directed correlations (Wild et al., 2010). To assess the stability of the edge weights, 1,000 case-drop bootstrap samples (tifkamp et al., 2018) were analyzed in which 15% of the participants was dropped at random from the original samples before reestimating the model using the same search strategy as previously described. Edges that were estimated for at least 60% of the bootstraps were considered to be stable. To determine the role of differential subgroup sizes, we also performed this procedure with a matched number of cases included (per bootstrap). This was done by randomly retaining X number of cases, in total corresponding to 85% of the smallest subgroup size (e.g., urbanization-grade subgroups: X = 319 × 0.85).
To ascertain the overall network connectivity, the density (i.e., number of estimated stable edges relative to the total number of possible edges: 16) and the sum of the absolute stable edge weights were calculated for each temporal subgroup network (Burger et al., 2022), again for full and matched samples. Higher scores were indicative of more densely connected and thus less resilient networks. A case-drop bootstrapped-difference test was performed to identify whether the sum of the absolute edge weights significantly differed between subgroups. For each subgroup, a random portion of cases (85%) was used to reestimate the model and compute the sum of the absolute stable edge weights, after which an average difference score was computed for each subgroup contrast. This was repeated 1,000 times, and a quantile interval around the average difference score was constructed. Network connectivity estimates were considered to be significantly different (α = .05) if zero was not in the quantile interval.
The structures of the networks of each subgroup were compared by constructing a comparison network depicting the absolute edge-weight differences. Statistical evidence for these edges was determined by performing another case-drop bootstrapped-difference test (15% dropped, 1,000 samples) by taking the difference between the edge weights and constructing quantile intervals around each difference score (for each edge separately). Again, edges were deemed to be significantly different (α = .05) if zero was not in the quantile interval, and this procedure was repeated for full and matched samples.
Results of both the full and matched samples are presented in the results section, but only the outcomes of the full samples are described in detail in the main text. However, the role of differential subgroup sizes are elaborated on in the discussion.
Regression analyses
Because accurate network estimation depends on large sample sizes (tifkamp, 2016, 2020) and our subgroup samples are limited in size, possible interactions among resilience factors and demographic characteristics (requiring subgroup allocation using multiple factors) could not be evaluated in the network models. Nonetheless, to elaborate on possible interactions, we performed several multiple regression analyses on overall levels of mental well-being, anxiety, depression, and loneliness scores; these are reported in Supplement D in the Supplemental Material.
Control checks
The study protocol incorporated two interventions (at both T3 and T5) targeting social norms (toward compliance with behavioral COVID-19 measures; T3), trust (in actors that were crucial in the COVID-19 pandemic in the Netherlands; T3), support for measures (aimed at preventing the spread of the coronavirus; T5), or the expected severity of economic consequences (T5; for more details, see Chambon, Dalege, Waldorp, et al., 2022). Control analyses have shown that these interventions did not affect our (outcome) variables of interest (for more details, see the Supplemental Material).
Results
Evolution of mental-health variables over time and main effects of grouping factors
At T1, better mental-health outcomes were found for individuals age 67 or older, living in rural areas, and scoring high on BRS and PAS (see Tables SB1–SB4, Supplement B, in the Supplemental Material). Throughout the study phase, as depicted in Figure 1 (Figs. 1a–1d), mental well-being increased and depression, anxiety, and loneliness decreased over time among all subgroups (all ps < .001; for details, see Table SB5 in the Supplemental Material). Most differences observed at T1 remained relatively stable over time (see Tables SB1–SB4 in the Supplemental Material). However, individuals scoring low on BRS and/or PAS showed greater recovery in both depression and anxiety (yet still scored higher on these constructs than their respective subgroups at T5).
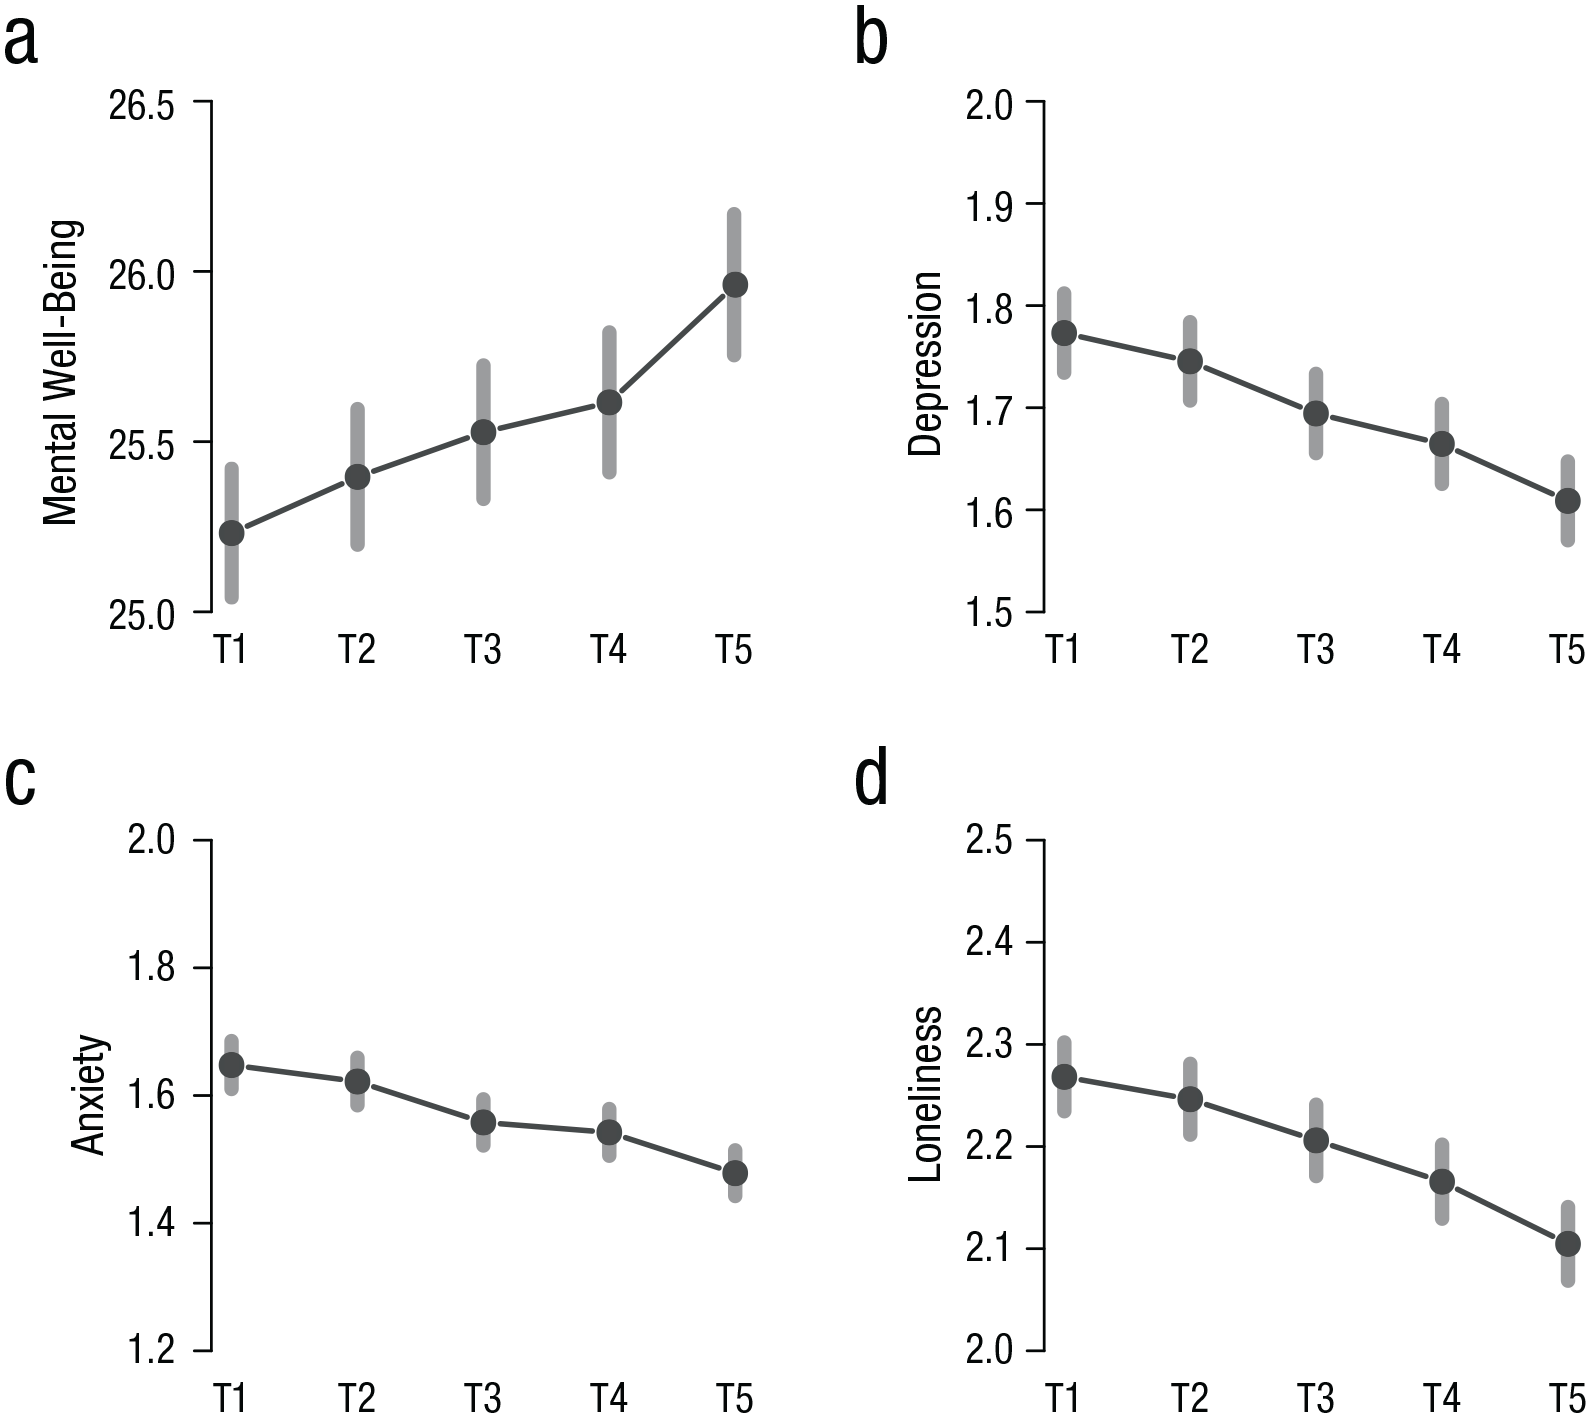
The course of mental (a) well-being, (b) depression, (c) anxiety, and (d) loneliness scores throughout the study phase (of all participants). Error bars depict standard deviations (for average scores for all subgroups together and seperately, see Tables SB1-SB4 in the Supplemental Material available online). Weeks of data collection (2020): T1 = 17–19; T2 = 20 and 21; T3 = 22 and 23; T4 = 24 and 25; T5 = 26 and 27.
To shed light on the temporal dynamics between the mental-health constructs within this 10-week window, in subsequent analyses, we focused on the subtrends (or “fluctuations”) from T x to Tx+1 and specifically how (2-week) fluctuations in each construct affected (2-week) changes in the other constructs and how this differed between subgroups.
The dynamics among the mental-health constructs in the entire sample are reported in Supplement C in the Supplemental Material and are not discussed in the main text. For those analyses, we also distinguished between social and emotional loneliness (see Figure SC2 and Table SC3–SC9 in the Supplemental Material). Subgroup dynamics and potential (edge) differences in the temporal and contemporaneous networks between these subgroups are reported below; the figures of the contemporaneous networks are also included in Supplement C in the Supplemental Material. The between-subjects networks of all subgroup models are not discussed in the main text but are included in Supplement C in the Supplemental Material entirely.
Panel networks
All subgroup models showed good to reasonable incremental fit and root mean square error of approximations ranging from .040 to .067 (see Tables SC10, SC13, SC16, SC19, and SC22 in the Supplemental Material), indicating that the models are consistent with the data. All numeric results corresponding to the networks and the bootstrap results are reported in Supplement C (see Tables SC11, SC12, SC14, SC15, SC17, SC18, SC20, SC21, SC23, and SC24 in the Supplemental Material).
Temporal networks
Age
Figure 2a shows the temporal effects for the two age groups. In line with our hypotheses, the overall network connectivity was significantly higher for the young-senior than old-senior, indicating a sparser and thus less vulnerable network for the oldest subgroup. In both age groups, loneliness, depression, and anxiety had positive autoconnections. The autoconnection of anxiety was higher among young-senior (0.30) than old-senior (0.21) participants. The relationships from anxiety to loneliness and anxiety to mental well-being were reliably found only among young-seniors. Although anxiety was a consistent antecedent of depression across age groups, depression seemed to be a precursor of increased anxiety only among the old-seniors. In contrast, depression was a consistent precursor of loneliness but acted only as antecedent of mental well-being among the young-seniors.
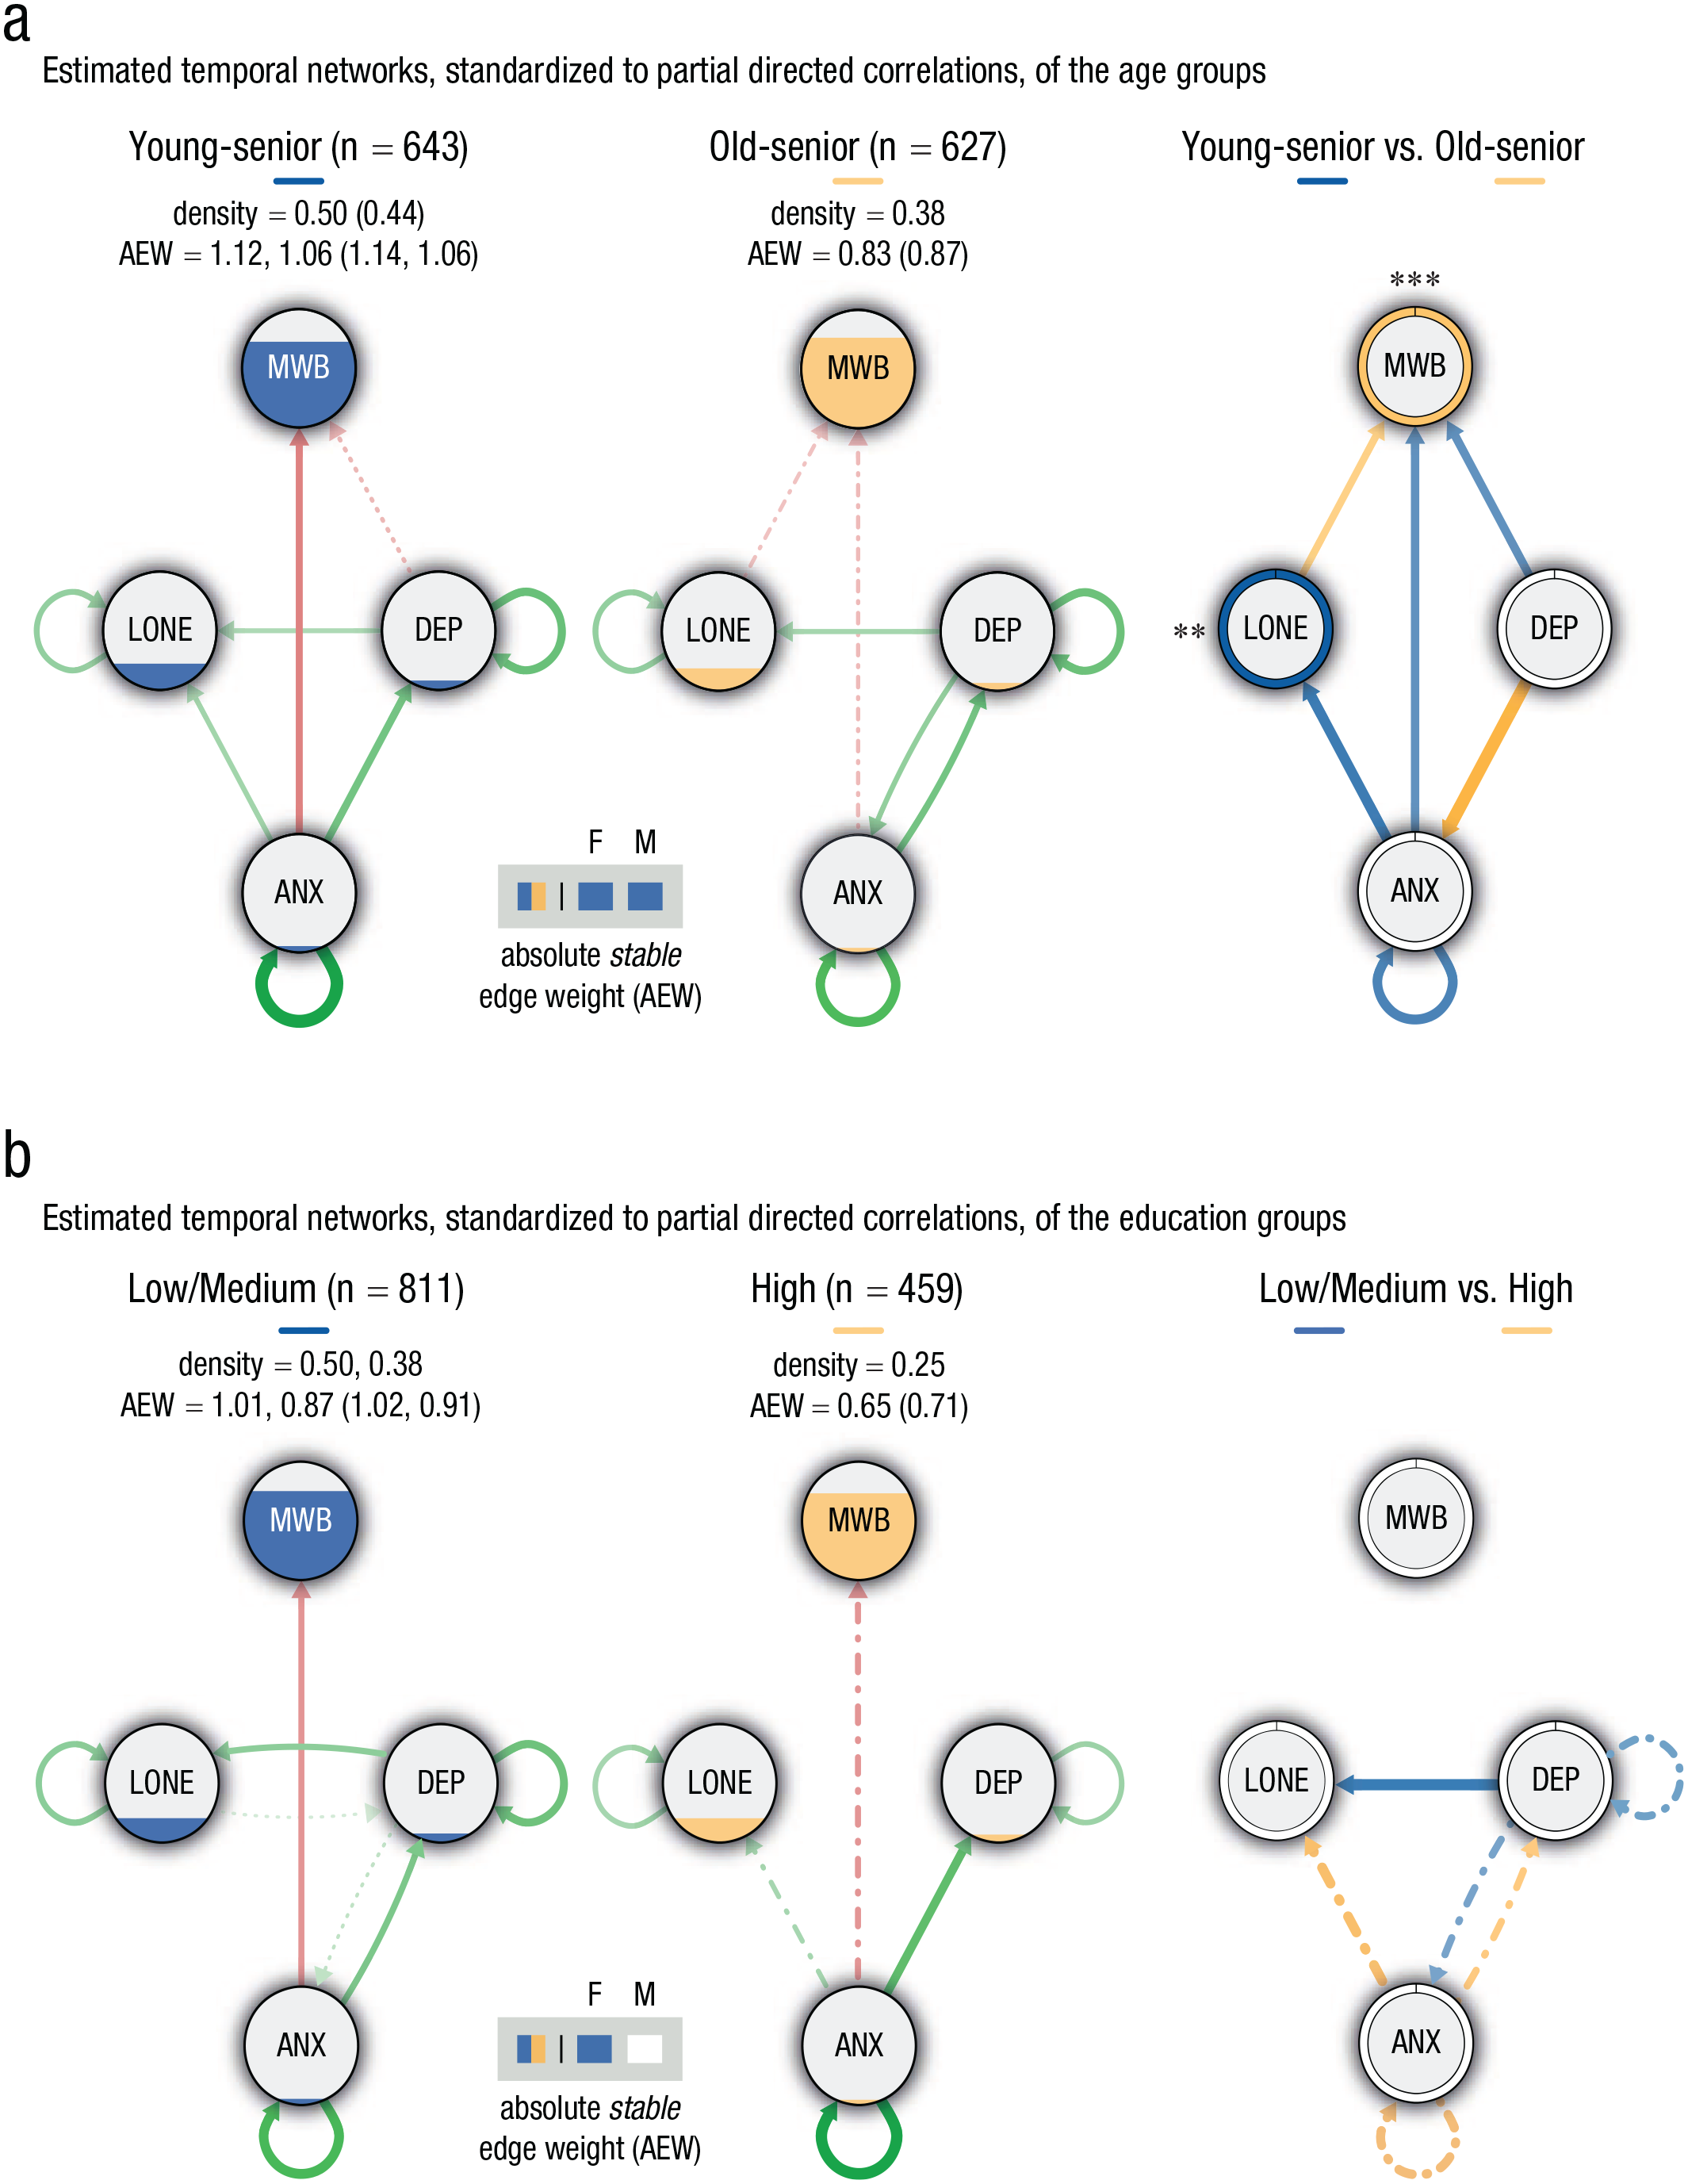
Temporal-network structures, based on the panel-lvgvar analysis, broken down by (a) age and (b) education subgroups. Left and middle panels portray the networks of participants from (a) young-senior and old-senior participants and (b) low/medium and highly educated participants, respectively. In these panels, Green edges indicate positive effects, and red edges indicate negative effects. Edges that were included in less than 60% of the bootstraps are depicted with dotted/dashed lines (only in sample-size-matched bootstraps: dotted; in both matched- and full-sample bootstraps: dash-dotted). Nodes are filled (area wise) according to their overall average per subgroup. The density (i.e., detected stable edges relative to the number of possible edges) and the sum of the absolute stable edge weights (AEWs; average based on bootstrapped samples) are reported for, respectively, the full samples and matched samples for the subgroup with the sample size being constrained. Note that the AEWs based on the original network (reported between parentheses) can deviate from the average based on the bootstrap samples. Outcomes of the statistical comparisons (alpha set at .05) of the sum of the absolute edge weights are shown in the gray-colored box for the full (F) and matched (M) bootstraps. Squares are color-coded according to the subgroup having the largest sum of the absolute edge weight; unfilled/white squares depict insignificant differences. Right panels portray the differences in standardized partial correlations between the two (a) age and (b) education subgroups. The colors depict the subgroup displaying the strongest edge weight, and the thickness reflects the magnitude of the difference. Only differences higher than abs(0.05) are shown. Edges for which we found no statistical evidence for a true difference are dotted/dashed (only in full-sample bootstraps: dashed; only in matched-sample bootstraps: dotted; in both matched- and full-sample bootstraps: dash-dotted). Ring colors depict the subgroup having the highest average score of each variable, with *p < .05, **p < .01, and ***p < .001 (Bonferroni corrected, also see Tables SB1–SB4 in the Supplemental Material available online). For each type of network, the maximum edge weight was set at the absolute highest edge weight across the two main networks (age = 0.28, education = 0.26) and separately for the difference plots (age = 0.16, education = 0.11). MWB = mental well-being; DEP = depression; ANX = anxiety; LONE = loneliness.
Education level
As illustrated in Figure 2b, the temporal network of the high-education group was overall significantly less densely connected than the low/medium-education group. Both networks featured positive autoconnections for depression, anxiety, and loneliness. In contrast with less educated individuals, depression was no antecedent of loneliness, and anxiety did not reliably precede mental well-being (and loneliness) among the highly educated individuals. The relationship from anxiety to depression was found for both subgroups Among the low/medium-educated group, depression also seemed to be an antecedent of anxiety.
Urbanization grade
The temporal networks of the urbanization grade groups are shown in Figure 3. Overall network connectivity was the highest for participants living in rural areas, suggesting higher vulnerability. Further inspection revealed that this was mainly driven by higher interconnectivity. Anxiety appeared to be a precursor of decreased mental well-being for rural and midurban areas and increased loneliness among people living in rural areas only. Although anxiety was also an antecedent to depression in rural and midurban areas, the opposite was true for high-urban areas. Depression was an antecedent of loneliness among all subgroups. Among participants living in midurban areas, loneliness also negatively affected mental well-being.
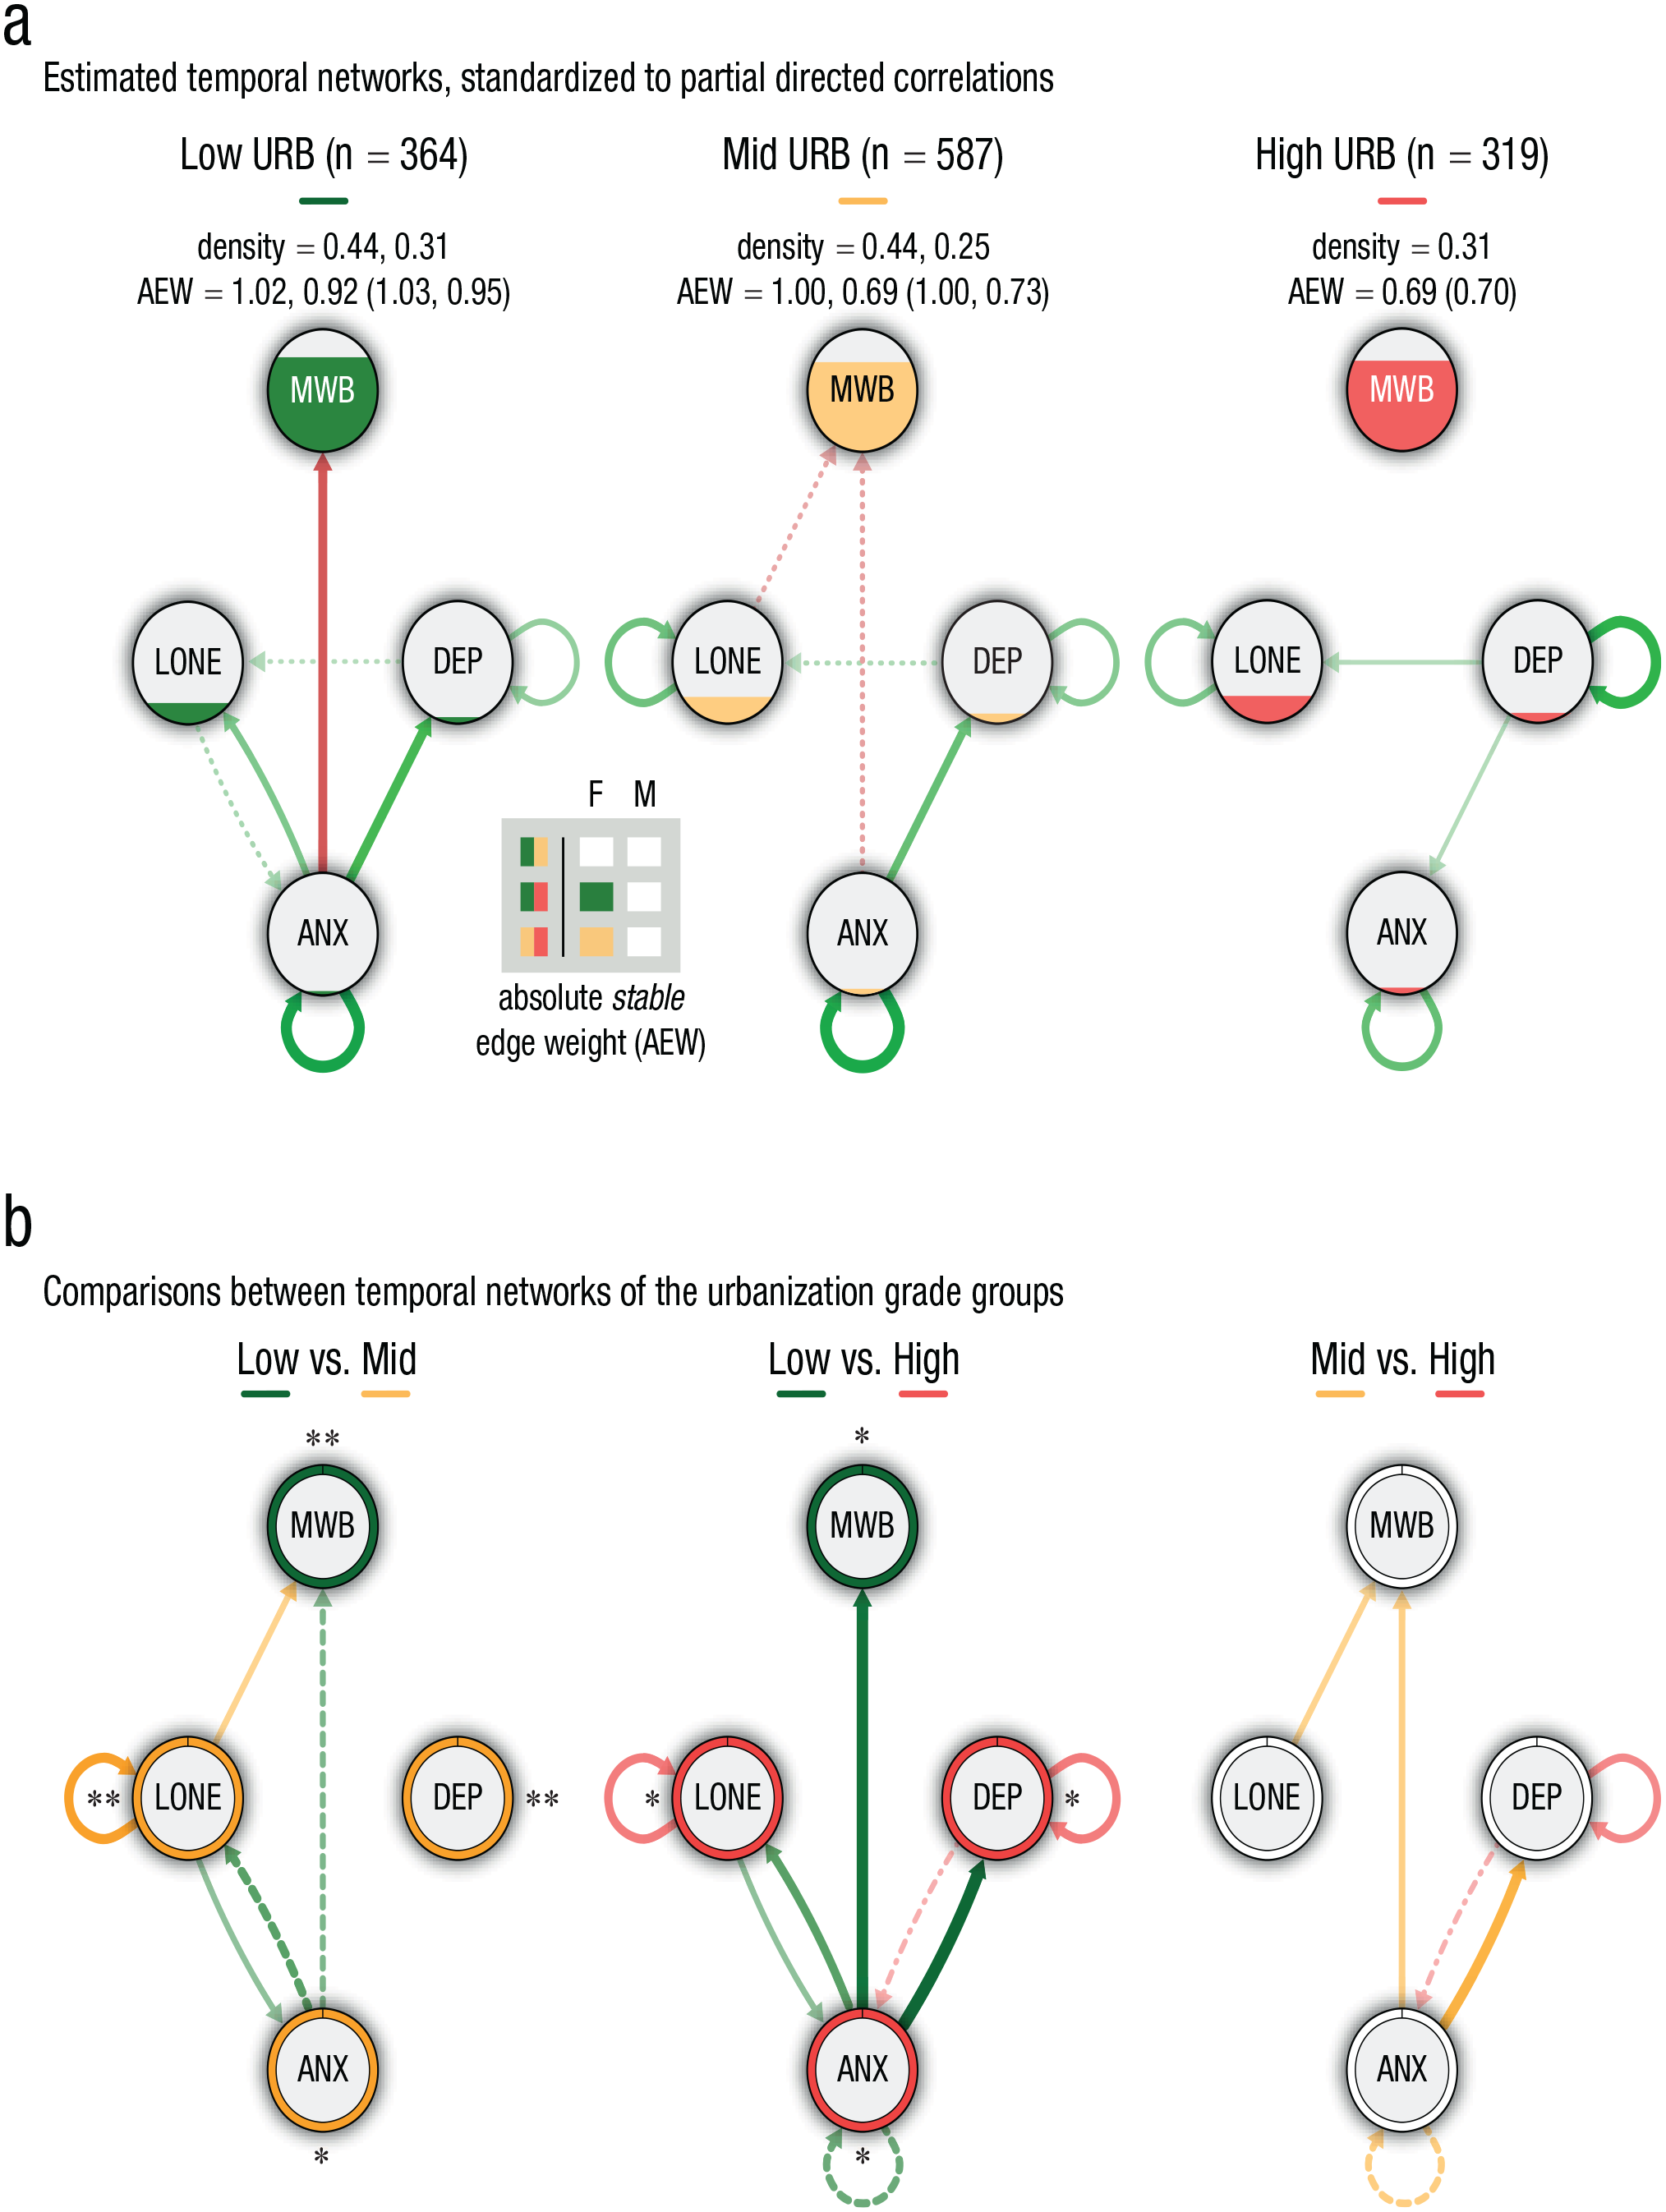
The temporal-network structure, based on the panel-lvgvar analysis, broken down by urbanization-grade subgroups. (a) The networks of participants from low-urban, midurban, and high-urban areas, respectively. Green edges indicate positive effects, and red edges indicate negative effects. Edges that were included in less than 60% of the bootstraps are depicted with dotted/dashed lines (only in sample-size-matched bootstraps: dotted; in both matched- and full-sample bootstraps: dash-dotted). Nodes are filled (area wise) according to their overall average per subgroup. The density (i.e., detected stable edges relative to the number of possible edges) and the sum of the absolute stable edge weights (AEWs; average based on bootstrapped samples) are reported, respectively, for the full samples and matched samples for the subgroups with the sample sizes being constrained. Note that the AEWs based on the original network (reported between parentheses) can deviate from the average based on the bootstrap samples. Outcomes of the statistical comparisons (alpha set at .05) of the sum of the absolute edge weights are shown in the gray-colored box for the full (F) and matched (M) bootstraps for each subgroup contrast. Squares are color-coded according to the subgroup having the largest sum of the absolute edge weight; unfilled/white squares depict insignificant differences. (b) The differences in standardized partial correlations among the subgroups are portrayed. Colors depict the subgroup displaying the strongest edge weight, and the thickness reflecs the magnitude of the difference. Only differences higher than abs(0.05) are shown. Edges for which we found no statistical evidence for a true difference are dotted/dashed (only in full-sample bootstraps: dashed; only in matched-sample bootstraps: dotted; in both matched- and full-sample bootstraps: dash-dotted). Ring colors depict the subgroup having the highest average score of each variable, with *p < .05, **p < .01, and ***p < .001 (Bonferroni corrected, also see Tables SB1–SB4 in the Supplemental Material available online). For each type of network (a or b), the maximum was set at the absolute highest value across all three networks (a = 0.28, b = 0.20). MWB = mental well-being; DEP = depression; ANX = anxiety; LONE = loneliness.
Despite these relatively beneficial patterns for urban residents in terms of interconnectivity, less beneficial dynamics were found when considering self-connectedness. We found positive autoconnections for depression and anxiety for all subgroups, but the autoconnections for depression were particularly strong among individuals living in high-urban areas (0.25 vs. 0.11 and 0.13 for rural and midurban areas, respectively). Moreover, autoconnections for loneliness were found only among participants living in midurban and high-urban areas (of similar strengths). This illustrates that depression and loneliness were more likely to maintain their own activation among participants living in medium- to high-urban areas, whereas recovery toward equilibrium was relatively fast among rural residents (i.e., less vulnerable).
PAS and BRS
The temporal networks of the BRS and PAS subgroups are shown in Figures 4 and 5, respectively. Networks were significantly less densely connected among participants scoring relatively high (and medium in case of BRS) on either of the resilience factors, pointing to lower vulnerability. All subgroup networks featured positive autoconnections for depression and anxiety. The autoconnection for depression was the strongest among participants with relatively high BRS (0.21 vs. 0.16 and 0.11 for low and medium BRS, respectively). For PAS, no subgroup differences were found for the autoconnections of anxiety and depression. Autoconnections for loneliness were found for all subgroups, except for participants with medium levels of BRS, and no autoconnections for mental well-being were observed in any of the subgroups.
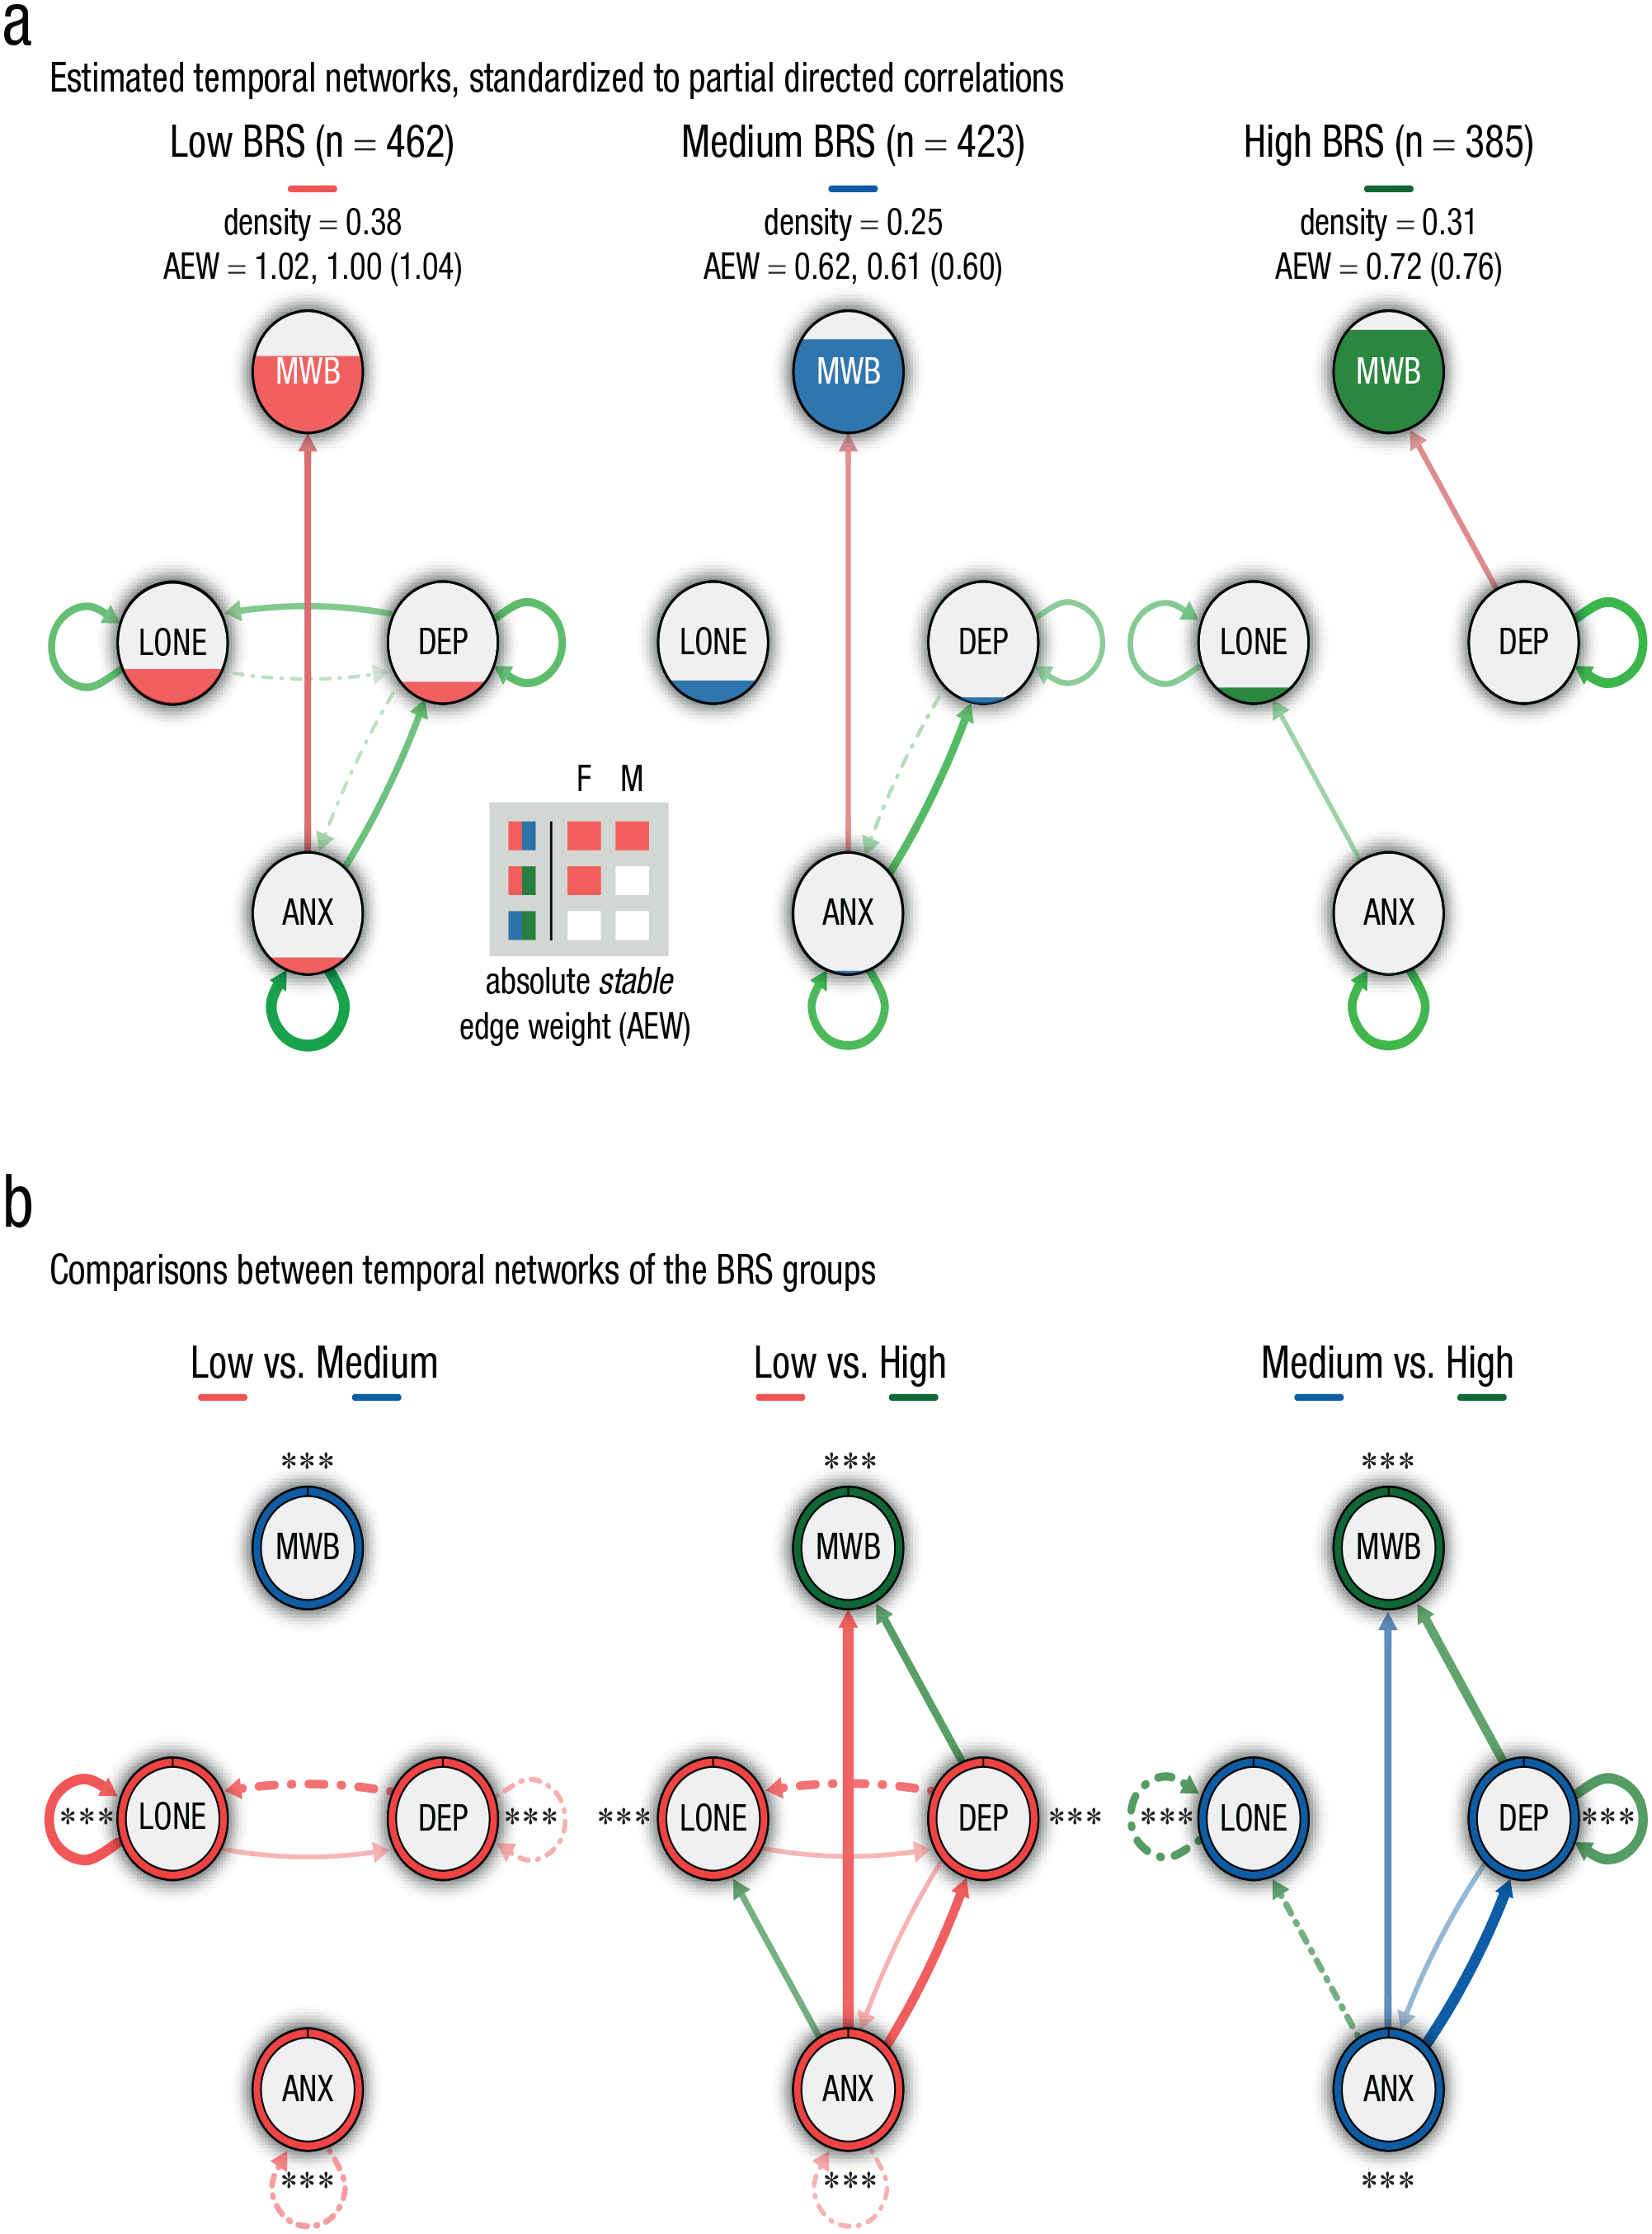
Temporal-network structure based on the panel-lvgvar analysis, broken down by ability to bounce back or recover from stress (BRS) subgroup. (a) Networks of participants from the low, medium, and high BRS subgroup, respectively. Green edges indicate positive effects, and red edges indicate negative effects. Edges that were included in less than 60% of the bootstraps are depicted with dotted/dashed lines (only in sample-size matched bootstraps: dotted; in both matched- and full-sample bootstraps: dash-dotted). Nodes are filled (area wise) according to their overall average per subgroup. The density (i.e., detected stable edges relative to the number of possible edges) and the sum of the absolute stable edge weights (AEWs; average based on bootstrapped samples) are reported, respectively, for the full samples and matched samples for the subgroups with the sample sizes being constrained. Note that the AEW based on the original network (reported between parentheses) can deviate from the average based on the bootstrap samples. Outcomes of the statistical comparisons (alpha set at .05) of the sum of the absolute edge weights are shown in the gray-colored box for the full (F) and matched (M) bootstraps for each subgroup contrast. Squares are color-coded according to the subgroup having the largest sum of the absolute edge weight; unfilled/white squares depict insignificant differences. (b) The differences in standardized partial correlations among the subgroups are portrayed. Colors depict the subgroup displaying the strongest edge weight, and the thickness reflecs the magnitude of the difference. Only differences higher than abs(0.05) are shown. Edges for which we found no statistical evidence for a true difference are dotted/dashed (only in full-sample bootstraps: dashed; only in matched-sample bootstraps: dotted; in both matched- and full-sample bootstraps: dash-dotted). Ring colors depict the subgroup having the highest average score of each variable, with *p < .05, **p < .01, and ***p < .001 (Bonferroni corrected, also see Tables SB1–SB4 in the Supplemental Material available online). For each type of network (a or b), the maximum was set at the absolute highest value across all three networks (a = 0.28, b = 0.17). MWB = mental well-being; DEP = depression; ANX = anxiety; LONE = loneliness.
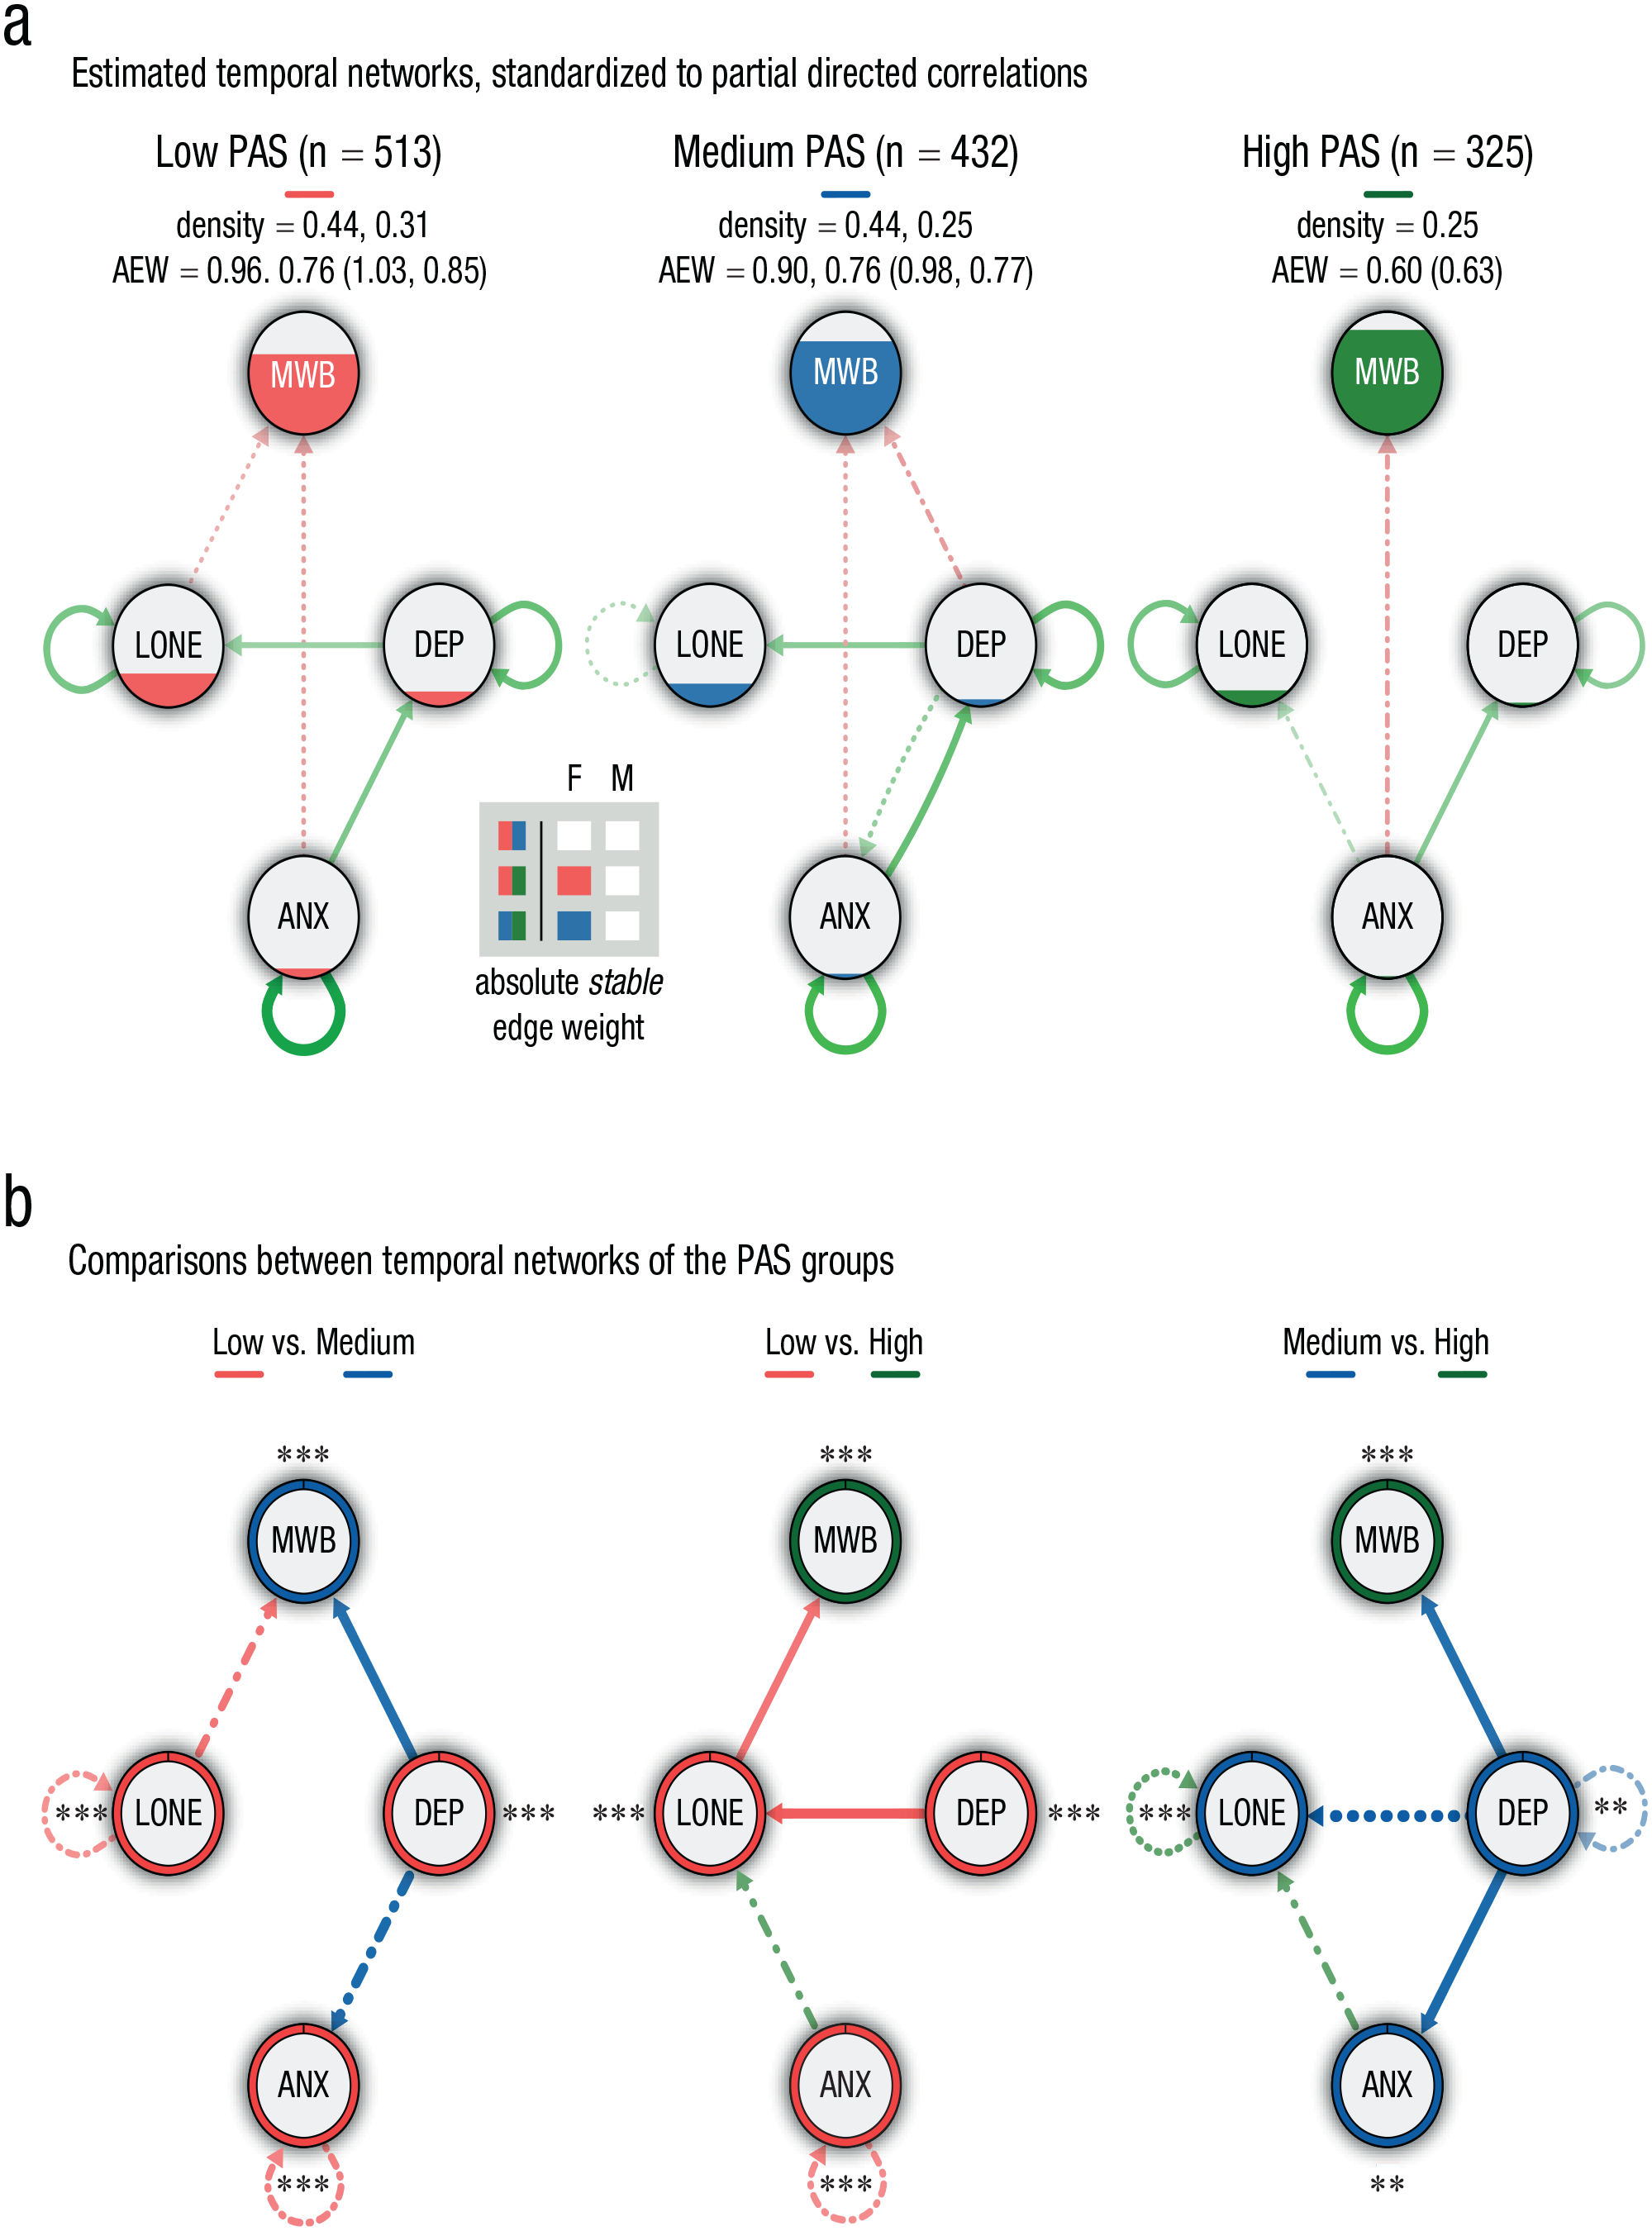
Temporal-network structure based on the panel-lvgvar analysis, broken down by positive appraisal style (PAS) subgroup. (a) Networks of participants from the low-, medium-, and high-PAS group, respectively. Green edges indicate positive effects, and red edges indicate negative effects. Edges that were included in less than 60% of the bootstraps are depicted with dotted/dashed lines (only in sample-size-matched bootstraps: dotted; in both matched- and full-sample bootstraps: dash-dotted). Nodes are filled (area wise) according to their overall average per subgroup. The density (i.e., detected stable edges relative to the number of possible edges) and the sum of the absolute stable edge weights (AEWs; average based on bootstrapped samples) are reported, respectively, for the full samples and matched samples for the subgroups with the sample sizes being constrained. Note that the AEWs based on the original network (reported between parentheses) can deviate from the average based on the bootstrap samples. Outcomes of the statistical comparisons (alpha set at .05) of the sum of the absolute edge weights are shown in the gray-colored box for the full (F) and matched (M) bootstraps for each subgroup contrast. Squares are color-coded according to the subgroup having the largest sum of the absolute edge weight; unfilled/white squares depict insignificant differences. (b) The differences in standardized partial correlations among the subgroups are portrayed. Colors depict the subgroup displaying the strongest edge weight, and the thickness reflects the magnitude of the difference. Only differences higher than abs(0.05) are shown. Edges for which we found no statistical evidence for a true difference are dotted/dashed (only in full-sample bootstraps: dashed; only in matched-sample bootstraps: dotted; in both matched- and full-sample bootstraps: dash-dotted). Ring colors depict the subgroup having the highest average score of each variable, with *p < .05, **p < .01, and ***p < .001 (Bonferroni corrected, also see Tables SB1–SB4 in the Supplemental Material available online). For each type of network (a or b), the maximum was set at the absolute highest value across all three networks (a = 0.24, b = 0.13). MWB = mental well-being; DEP = depression; ANX = anxiety; LONE = loneliness.
Anxiety was an (reliable) antecedent of only mental well-being among participants having low to medium levels of BRS and PAS. A relationship from anxiety to depression was observed for all subgroups except the high-BRS group. Moreover, depression was found to be a precursor of increased loneliness among participants having low-BRS or low- to medium-PAS values. The network of participants having relatively high BRS featured a directed relationship from depression to mental well-being, which was not reliably observed in any of the other subgroups. Loneliness preceded mental well-being among participants with low PAS only.
Contemporaneous networks
The estimated contemporaneous networks of the subgroups (see Figs. SC3a–SC7 and SC9) revealed that all mental-health constructs were directly related to one another during the same measurement moments (i.e., within a survey). The fact that some of these relationships were not observed in (some of) the temporal-subgroup networks suggests that (bi)directional relationships among some of the mental-health indicators occurred at a faster pace. For instance, loneliness did not (consistently) affect mental well-being (or vice versa) over time between measurements among most subgroups but was associated with lower mental well-being during the same measurement moments. Likewise, among subgroups of individuals in which depression did not seem to affect loneliness over time, both indicators were still positively associated to one another in the contemporaneous network.
Discussion
In the present study, we adopted a dynamic-network-model approach to study resilience in older adults. Specifically, we investigated whether we could distinguish highly adaptive individuals with resilient network dynamics from individuals who seem more vulnerable in the face of adversity. To this end, we examined the effect of individual differences in age, education level, urbanization grade, BRS, and PAS on a network comprising nodes of mental well-being, depression, anxiety, and loneliness. These networks were constructed using longitudinal data collected during the early phase of the COVID-19 pandemic. On average, participants’ mental health seemed to gradually improve during this study, suggesting some level of resilience for the majority of individuals (MacLeod et al., 2016). However, some subgroups showed more favorable outcomes and network dynamics than others. At T1, better mental-health outcomes were found for older adults who were 67 or older, residing in rural areas, or scored (relatively) high on BRS and PAS, and this advantage remained present until the final measurement (T5). Furthermore, in line with our hypotheses, older adults who were 67 or older, were highly educated, or scored (relatively) high on BRS and PAS generally presented more resilient network dynamics of weak self- and/or interconnectedness and showed weaker network connectivity. As per living environment, some characteristics seemed to be in favor of urban areas (i.e., absolute stable edge weight, weak/few interconnections), but expeditious recovery of fluctuations in mental-health constructs appeared better among rural residents (i.e., weak autoconnections). Taken together, our findings suggest that specific factors can mitigate unfavorable mental-health outcomes and dynamics in the face of adversity. In addition, we observed some relatively consistent and subgroup-dependent pathways among our mental-health variables that challenge the current understanding of their associations.
Our findings show that despite a worse overall mental-health status, the subgroups that were hypothesized to be disadvantaged showed similar levels of improvement. Given these findings, one may conclude that these subgroups exhibit a similar capacity for recovery. However, by looking at this overall change, potential differences in the underlying processes of adaptation and how adequate these are in the long run cannot be inferred. These mechanisms of resilience may help to understand how ongoing stressors and perturbations are dealt with and which subgroups may be most vulnerable in the face of (endured) adversity. Indeed, we found some interesting subgroup differences in the temporal-network dynamics between depression, loneliness, anxiety, and mental well-being, which may reflect differences in the capacity for resilience. The specific subgroup findings are discussed below.
Demographic factors
Our finding that adults age 67 or older exhibited better overall mental-health outcomes (over time) and less vulnerable networks than young-seniors is in line with previous research that has reported higher resilience at older age (> 64; Gooding et al., 2012; Netuveli et al., 2008). Therefore, our results seem to align well with the idea that the accumulation of life experiences fosters the refinement of coping skills that can help older adults to more effectively deal with aversive life events (Aldwin et al., 2016; Fuller & Huseth-Zosel, 2021; Norris & Murrell, 1988; Seery et al., 2010). Furthermore, the present findings could help to explain earlier observations of better mental-health outcomes among the old-senior during the COVID-19 pandemic specifically (e.g., Palgi et al., 2020; van Tilburg et al., 2020). Especially anxiety seems to play a crucial and unique role among young-seniors. In this subgroup, anxiety had a stronger autoconnection (than in old-seniors) and projected to loneliness and mental well-being. This suggests that it could lead to (other, comorbid) mental-health problems in the face of adversity.
Contrary to our expectations, education seemed to confer little protection with respect to overall mental-health outcomes. This also contrasts with previous findings in relation to the COVID-19 pandemic (e.g., Fancourt et al., 2021; Knolle et al., 2021). The network dynamics of highly educated seniors were, however, indicative of higher levels of resilience, with only one stable interconnection (from anxiety to depression). This seems to suggest that the underlying mechanisms of resilience are more adaptive among highly educated individuals, which may offer more effective long-term protection. This is in line with results of Frankenberg et al. (2013), who showed that education provided limited protection for the immediate impacts of adversity but was associated with higher levels of resilience over the longer term. Indeed, the current networks have revealed some potentially important relations that can help researchers better understand and predict how certain problems may develop over time, with education level possibly explaining some of the heterogeneity in recovery in the aftermath of the initial pandemic phase.
Our findings pertaining to urbanization grade suggest there may be both protective and less beneficial aspects of rural living. On the one hand, our results indicate that (certain aspects of) rural living can provide a buffer against the mental-health impact of aversive circumstances, possibly by decreasing recovery time after a perturbation. Among midurban to high-urban residents, networks exhibited strong autoconnections for loneliness and depression, indicative of slower rates of recovery. In contrast, autoconnections for individuals living in less urbanized/more rural areas were observed only for anxiety and (weakly for) depression. This suggests that loneliness and depression returned to equilibrium relatively quickly after activation, rendering rural residents less vulnerable for developing (chronic forms of) loneliness and/or depression in the long run. Indeed, some aspects that are characteristic of rural living, such as large green-space availability, are known to improve recovery after adversity (Pouso et al., 2020; van den Berg et al., 2010) and may therefore be crucial in differentially shaping mental health in rural and urban environments (van der Wal et al., 2021).
On the other hand, however, networks of rural and midurban residents appeared to be more densely connected than for urban residents, mainly because of strong interrelationships feeding from anxiety. This may suggest that urban residents have more actively sought for ways to curb their anxiety levels (e.g., steeper increase in nature visits; Berdejo-Espinola et al., 2021) or that such coping efforts had more beneficial impacts for these residents.
Trait (resilience) factors
In line with previous studies, we show that BRS and PAS were associated with higher levels of resilience (Chmitorz et al., 2018; De Pue et al., 2021; Kalisch et al., 2015a, 2015b; Veer et al., 2021). Generally, network connectivity appeared to be stronger among individuals with relatively low to medium levels of PAS and low levels of BRS (i.e., mainly driven by differences in presence and strength of interrelations), and overall mental-health variables consistently improved with increasing levels of PAS and BRS. This seems to align with PAS theory of resilience (Kalisch et al., 2015b), which claims that PAS permits optimal stress responding (i.e., not stronger and longer than necessary), which is in turn reflected (at least partially) in one’s BRS score (Veer et al., 2021).
No major differences in autoconnections were observed. However, for those variables for which differences were found, autoconnections were stronger for individuals with high BRS (depression) and PAS (loneliness, when considering full sample) than individuals with medium scores. This adds a certain nuance and suggests that moderate levels of both factors may be (slightly) more adaptive in terms of temporal recovery, lending support for the idea that adaptive competencies can become disadvantageous if taken to the extreme (Dovey, 2019; Mahdiani & Ungar, 2021). Our regression analyses showed that in some subgroups, the immediate contribution of BRS on anxiety and depression was stronger when PAS was low, suggesting that viewing stressors in a highly positive light may disrupt the mobilization of other coping efforts (as captured within the BRS), thereby impeding recovery and long-term adaptation (Juslin, 2015; Mancini, 2015; Veer et al., 2021). How the interplay between both trait factors manifests in a network is a fundamental question for future research.
Immediate (short-term) impacts and differential perturbations
An important aspect to consider with respect to our subgroup findings is related to the relatively negative mental-health outcomes that were observed for the “disadvantaged” subgroups at T1 already. Unfortunately, the lack of prepandemic scores prevented us from precisely assessing baseline differences among the subgroups in the mental-health constructs and the immediate impact of the pandemic on these constructs. It seems likely that some subgroups had a less favorable mental-health status before the onset of the pandemic (e.g., Chmitorz et al., 2018; Kalisch et al., 2015b). Be that as it may, the discrepancy between subgroups at T1 may also indicate that seniors age younger than 67, living in urban areas, and/or scoring low on BRS and PAS took a bigger initial blow, leaving them even less resilient for subsequent perturbations. Hence, our subgroup-network results may (at least partially) reflect the impact of older adults’ prepandemic status and immediate responses to its ontset on further recovery and long-term adaptation. Support for this comes from studies showing that preexisting conditions of, for example, depression and anxiety can further deteriorate mental health in the face of (subsequent) adversity (Asmundson et al., 2020; Fancourt et al., 2021).
In case of the urbanization grade and age, the discrepancy among subgroups at T1 may have been (at least partially) driven by substantially higher perturbations that were experienced by (mid to high) urban residents and young-senior adults compared with their counterparts. Because urban areas tended to form the epicenter of the pandemic, daily life adjustments were most urgent among urban residents. At the same time, young-senior adults had to reorganize many more aspects of their daily life (e.g., transitioning to working from home; homeschooling) and had to cope with increased responsibilities and worries about the well-being and health of their children and/or their own parents (Czeisler et al., 2021; Gadermann et al., 2021). This may have put those individuals at higher risk for mental-health deterioration, thereby hindering subsequent adaptation (as reflected in more vulnerable networks in case of young-senior adults and strong autoconnections specifically in case of urban residents). Results of our regression analyses further suggest that old-senior adults may be relatively unaffected by environmental influences, whereas young-senior adults generally benefited from living in rural areas. This may be explained by the fact that individuals living in rural areas tend to seek solitude, thus being content with seeing fewer people (Finlay & Kobayashi, 2018; Hinck, 2004), whereas individuals living in urban areas (and especially the younger ones) want to have people around them and enjoy the opportunities such areas generally have to offer (e.g., meeting new people, wide array of entertainment options). In the midst of the pandemic, such benefits were cut off, resulting in a larger gap between desires and reality among urban residents.
Interrelations among mental-health variables
Depression and anxiety as precursors of increased loneliness
In addition to the subgroup differences in network structures, the current study also revealed possible causal pathways to (comorbid) mental-health problems that could help to identify people at risk and inform strategies for prevention. We found that higher levels of depressive symptoms strongly predicted increased loneliness (especially among individuals with more vulnerable networks) over time but not the reverse (only weakly for low/medium education). This concurs well with some other studies that showed a unidirectional effect with depression as origin (Dahlberg et al., 2015; McHugh Power et al., 2020; Tiikkainen & Heikkinen, 2005). As previously reported, depression may prompt increased loneliness by biasing individuals to assess their interactions more negatively and experience them as less rewarding (Burholt & Scharf, 2014; Lewis et al., 2017). This undermines emotional attachment (causing emotional loneliness; e.g., Drageset et al., 2012) and may lead to social withdrawal and disengagement (inciting social loneliness; Tiikkainen & Heikkinen, 2005). Our results additionally suggest that some predispositions (e.g., high BRS and PAS, high education level, rural living) may reduce vulnerability to depressive symptoms and their associated biases, thereby leaving prospective loneliness scores relatively unaffected. We should point out, however, that there are also studies that have reported reciprocal influences (e.g., Cacioppo et al., 2006; Domènech-Abella et al., 2019; Luo et al., 2012) and/or a unidirectional effect with loneliness as precursor of depression (e.g., Cacioppo et al., 2010; Heikkinen & Kauppinen, 2004; Holvast et al., 2015). Future research is needed to disentangle the factors that may explain these discrepancies. Here, it may also be opportune to evaluate the role of social and emotional loneliness separately.
Next to depression, anxiety also appeared to be a strong precursor of increased loneliness, affecting loneliness scores either directly or indirectly through its well-established effects on depression (e.g., Wetherell et al., 2001). This contradicts findings of Domènech-Abella et al. (2019), who reported a particularly strong cross-lagged effect of loneliness on anxiety and depression, but it seems to coincide with the notion that anxiety can render older adults more vulnerable to loneliness (Evans et al., 2019). During COVID specifically, anxiety symptoms may have mainly reflected concerns about the consequences of getting infected, which stirred people to insulate themselves and thus led to increased loneliness. Despite lower T1 and overall anxiety scores (and scores on other mental-health indicators), individuals living in rural areas showed strong (bidirectional) pairwise associations between anxiety and loneliness and mental well-being (contributing to a higher network connectivity). So, although rural residents may in general be more content with seeing fewer people, for individuals who were quite anxious, the impact seemed larger compared with (mid) urban residents. We speculate this may reflect that the fear of getting infected motivated people to completely isolate themselves and that this was more readily achieved by rural residents than by people living in densely populated areas.
Taken together, our results support the idea that loneliness may be a consequence of poor mental health (Bowling et al., 1989) and that rather than being caused by increased loneliness (e.g., Palgi et al., 2020), the susceptibility to suffer from depression-anxiety comorbidity because of the COVID-19 outbreak is itself a major source for increased loneliness over time. The presence of strong autoconnection of loneliness in most subgroups further suggests that potential increases likely linger for a relatively long period of time. This may be due to negative cognitive biases and pessimistic and avoidance-oriented social behaviors that further sabotage older adults’ opportunities to develop positive social relationships (Cacioppo & Hawkley, 2009; Hawkley & Cacioppo, 2010; Spithoven et al., 2017). Hence, the current results highlight the importance of early identification and treatment of emerging anxiety and depression symptoms to prevent maladaptive long-term consequences (Arango et al., 2018).
Anxiety as antecedent of decreased mental well-being
In addition, anxiety appeared to be the strongest and most consistent antecedent of decreased mental well-being. Indeed, (prolonged) anxiety can interfere with many aspects of daily life that can cause distress (e.g., loss of concentration, fatigue, sleep problems; Nilsson et al., 2019). Our results suggest that this has both immediate (see contemporaneous networks) and longer-term impacts on mental well-being for specific subgroups that generally exhibited more vulnerable networks and overall mental-health outcomes (e.g., the young-senior, low/medium in BRS, but also individuals living in rural areas). Loneliness, on the other hand, was strongly associated with higher levels of mental well-being within measurements (e.g., Hawkley & Cacioppo, 2010) but affected only mental well-being over time in two specific subgroups (midurban areas and low PAS). Similar time-dependent patterns were observed for depression (temporal relationships for high BRS and young-seniors only). This shows the importance of distinguishing temporal and contemporaneous effects.
Comparing subgroup networks with different sample sizes
As far as we know, no previous research has looked at subgroup differences in (temporal) panel networks using a psychological-systems approach. When comparing networks, sample-size differences compose a challenge because the accuracy of the estimates largely depends on sample size (i.e., higher sample sizes = higher accuracy; tifkamp et al., 2018). This implies that subgroup differences in overall network connectivity and specific edges may (at least partially) be driven by differences in sample size. It is, however, not trivial to disentangle the effects of power issues, on the one hand, and actual differences, on the other hand. To illustrate, the lower overall (stable) network connectivity for most of the smaller subgroups may point toward power issues but could also imply that these specific subgroups truly exhibit less densely connected networks (especially when sample sizes do not differ a lot, e.g., with age, urbanization grade), which would in most cases be in line with our hypotheses. When evaluating subgroup differences in network connectivity and specific edges, we looked at both full and sample-size-matched samples. For the individual edges, the two approaches resulted in nearly similar results, suggesting that these are robust and reliable. However, for the overall network connectivity, we did not consistently find significant subgroup differences when evaluating the matched samples. Again, this could suggest that subgroup differences are (at least partially) caused by sample-size difference but may also imply that there is not enough power left to pick up subgroup differences because of eliminating a large(r) part of the data (Haslbeck, 2022). Either way, the exploratory nature of these analyses should be emphasized. To resolve some of these uncertainties and allow for more accurate interpretations of group differences, future studies should adopt a Bayesian approach to distinguish between evidence of absence for an edge and absence of evidence. As of yet, no analysis package is readily available to implement this approach.
Other limitations, strengths, and suggestions for future research
Because we lack data on individuals’ prepandemic mental-health status and networks and on individual levels of stressor exposure, we were unable to directly model the effects of the onset of the pandemic and specific stressors on the network’s behavior. Nonetheless, our study provides relevant insights about the characteristics and predispositions that may confer resilience in later life in times of a life phase encompassing various challenges and perturbations. Future studies are needed to establish whether and how these factors confer resilience to the onset of adverse life phases and specific stressors that individuals encounter throughout.
Another aspect to consider is that the results of this study represent mental health (dynamics) during the initial phase of the COVID-19 pandemic, and it is unclear how trajectories evolve in time and whether the network dynamics generalize to later phases. It cannot be precluded that, in time, the subgroups that seemed rather disadvantaged during this initial phase of the pandemic may eventually reach similar levels of mental health. Accordingly, the observed differences in the trajectories and temporal dynamics may say more about how fast and/or efficient older adults’ capacity for resilience is than the actual extent to which subgroups may or may not recover in the end. Nonetheless, suboptimal resilience mechanisms (i.e., slowly rather than quickly bouncing back) may still pose a threat given that the ongoing presence of perturbations (e.g., daily news about changes and rise of numbers, another lockdown, policy change) may take individuals back even further, which could then impede full recovery. That is, older adults with inefficient resilience capacities may be able to, eventually, come back from one or two perturbations but may not be able to handle a cascade of challenges. Following this speculative line of reasoning, our networks may illustrate some fundamental differences in dynamics among mental-health constructs between subgroups of participants that allow one to make more validated predictions about who will most likely experience less or more favorable mental-health outcomes in the longer run. In other words, these networks may inform who will be more prepared (or equipped) for endured or new perturbations and will less easily succumb to adversity. Hence, the current study emphasizes that this may be a promising technique to study resilience and (long-term) ability to bounce back despite the limited time frame available. Future studies may employ longer time frames to help to shed more light on this.
Still, it is also an open question whether the COVID-19 pandemic can be considered as a homogeneous stressor and how well the observed dynamics generalize and thus shed light on the extent to which other challenges or transitions affect the psychological state of older adults (e.g., physical limitations, loss of a partner). The current, relatively new approach of conceptualizing and evaluating resilience in terms of desirable mental-health-construct network properties and dynamics hopefully inspires other researchers to delve into these matters.
One limitation of the study design is that BRS and PAS were measured only once even though these are not fixed traits. Both one’s stress-recovery ability and the use of positive appraisal as coping strategy may be shaped by previous experiences, including recent ones (Kalisch et al., 2019). Successful experiences with a certain strategy (e.g., positive appraisal) may strongly reinforce its use in the near future (see e.g., Hoorelbeke et al., 2019). In future studies, it may therefore be important to incorporate such malleable factors into the network models to see how these factors can strengthen (or weaken) over time and consequently affect mental health and/or each other (see Kalisch et al.’s, 2019, idea of a dynamic hybrid symptom- and-resilience-factor network model).
We also recommend future research to extend the networks with other (resilience) factors (e.g., social support) that may explain current pathways. Preferably, these studies also ensure a higher sample size that allows for subgroup allocations based on several demographic characteristics (e.g., young-senior living in rural areas vs. old-senior living in urban areas) to identify targeted patterns.
In addition, it may be opportune to evaluate the temporal dynamics among mental well-being, depression, anxiety, and loneliness within shorter time windows. With 2 weeks between every measurement, the current study highlighted some interesting pathways among specific subgroups. However, in most subgroups, the contemporaneous networks were more densely connected, suggesting that dynamics among some variables may occur at a different pace (e.g., from hour to hour or day to day), which may even differ per subgroup. Finally, to allow for a broader understanding of the comorbidity of mental-health problems, it would be interesting to include a variety of anxiety- and depression-related symptoms as separate nodes and to evaluate similar subgroup models to unravel potential differences in trajectories to comorbid problems among subgroups of individuals.
Conclusion
By adopting a dynamic-network approach, in the current study, we identified some critical factors that may distinguish subgroups of individuals who are (highly) adaptive from individuals who seem more vulnerable in the face of adversity. Specifically, younger age, lower education level, relatively low levels of resilience-related trait factors, and some aspects of urban living were associated with lower levels of resilience. Recognizing the importance of these risk factors may help to understand and perhaps mitigate their potentially deleterious effects on the dynamics among depression, anxiety, loneliness, and mental well-being. Specifically, our findings suggest that depression and anxiety symptoms may be important target points to shield the vulnerable subgroups from developing feelings of loneliness and decreased mental well-being. This would also diminish overall network activation, decreasing the likelihood one will be tipped out of one’s comfort zone. Altogether, this study can inform public-health organizations to tailor policies toward vulnerable individuals or communities who are less prepared for protracted perturbations during future outbreaks or challenging life phases and how certain features serve as opportune target points for interventions to promote resilience in times of adversity.
Supplemental Material
sj-pdf-1-cpx-10.1177_21677026231190294 – Supplemental material for Resilience Among Older Individuals in the Face of Adversity: How Demographic and Trait Factors Affect Mental-Health Constructs and Their Temporal Dynamics
Supplemental material, sj-pdf-1-cpx-10.1177_21677026231190294 for Resilience Among Older Individuals in the Face of Adversity: How Demographic and Trait Factors Affect Mental-Health Constructs and Their Temporal Dynamics by Lotte P. Brinkhof, Monique Chambon, K. Richard Ridderinkhof, Frenk van Harreveld, Jaap M. J. Murre, Harm J. Krugers and Sanne de Wit in Clinical Psychological Science
Supplemental Material
sj-pdf-2-cpx-10.1177_21677026231190294 – Supplemental material for Resilience Among Older Individuals in the Face of Adversity: How Demographic and Trait Factors Affect Mental-Health Constructs and Their Temporal Dynamics
Supplemental material, sj-pdf-2-cpx-10.1177_21677026231190294 for Resilience Among Older Individuals in the Face of Adversity: How Demographic and Trait Factors Affect Mental-Health Constructs and Their Temporal Dynamics by Lotte P. Brinkhof, Monique Chambon, K. Richard Ridderinkhof, Frenk van Harreveld, Jaap M. J. Murre, Harm J. Krugers and Sanne de Wit in Clinical Psychological Science
Supplemental Material
sj-pdf-3-cpx-10.1177_21677026231190294 – Supplemental material for Resilience Among Older Individuals in the Face of Adversity: How Demographic and Trait Factors Affect Mental-Health Constructs and Their Temporal Dynamics
Supplemental material, sj-pdf-3-cpx-10.1177_21677026231190294 for Resilience Among Older Individuals in the Face of Adversity: How Demographic and Trait Factors Affect Mental-Health Constructs and Their Temporal Dynamics by Lotte P. Brinkhof, Monique Chambon, K. Richard Ridderinkhof, Frenk van Harreveld, Jaap M. J. Murre, Harm J. Krugers and Sanne de Wit in Clinical Psychological Science
Supplemental Material
sj-pdf-4-cpx-10.1177_21677026231190294 – Supplemental material for Resilience Among Older Individuals in the Face of Adversity: How Demographic and Trait Factors Affect Mental-Health Constructs and Their Temporal Dynamics
Supplemental material, sj-pdf-4-cpx-10.1177_21677026231190294 for Resilience Among Older Individuals in the Face of Adversity: How Demographic and Trait Factors Affect Mental-Health Constructs and Their Temporal Dynamics by Lotte P. Brinkhof, Monique Chambon, K. Richard Ridderinkhof, Frenk van Harreveld, Jaap M. J. Murre, Harm J. Krugers and Sanne de Wit in Clinical Psychological Science
Footnotes
Acknowledgements
We thank Alessandra Mansueto and Karoline Huth for their valuable feedback and contribution to the analyses.
Transparency
Action Editor: Pim Cuijpers
Editor: Jennifer L. Tackett
Author Contributions
Notes
References
Supplementary Material
Please find the following supplemental material available below.
For Open Access articles published under a Creative Commons License, all supplemental material carries the same license as the article it is associated with.
For non-Open Access articles published, all supplemental material carries a non-exclusive license, and permission requests for re-use of supplemental material or any part of supplemental material shall be sent directly to the copyright owner as specified in the copyright notice associated with the article.