
Abstract
To expand evidence for the nature and related mechanisms underlying loneliness measured by Social and Emotional Loneliness Scale for Adults (SELSA-S), several hypotheses were developed and tested to map the nomological network of loneliness. Tests included examining the structure of the multidimensional experiences of loneliness, concurrent and prospective relations between loneliness, sociodemographic variables, worry, rumination, metacognition, symptoms of anxiety and depression. This study also sought to determine how resilience is involved in the protection against loneliness and depressive symptoms. Four hundred and eighty-two students with a mean age of 25.84 years (SD = 5.74) participated (N = 482; 59% females). Structural and temporal stability analyses supported the multidimensional experiences of loneliness, including family, romantic and social loneliness. Psychological network analysis identified especially strong connections (i.e., edges) between indicators belonging to loneliness in family and social relationships. At the general level, older participants and those who were single reported more loneliness. Loneliness was concurrently and prospectively associated with worry, rumination and metacognitions and predicted vulnerabilities in levels of anxiety and depressive symptoms. At follow-up, the effect of loneliness on depressive symptoms was lower when scoring high on resilience. Interventions for loneliness may address improving family relationships and metacognitive processes underlying loneliness, which may in turn improve mental health. Interpersonal and intrapersonal protective factors involved in resilience may compensate for deficits in social relationships thereby buffering negative effects of loneliness on common mental health problems.
Introduction
Loneliness is defined as the discrepancy between desired and actual levels of social relationships (Cacioppo & Cacioppo, 2018; Perlman & Peplau, 1982). Following advances in theories of loneliness, other studies focused on operationalization and construct validation of loneliness scales and interventions to reduce the feeling of loneliness. However, as concluded in a meta-analysis by Masi et al. (2011), interventions that focused on improving social skills through training, enhancing social support, or increasing opportunities for social contact have been ineffective. Although the social and health consequences of loneliness match those of many mental health problems, the origins and treatment of loneliness remains unclear (Masi et al., 2011). The evolutionary model of loneliness (Cacioppo & Hawkley, 2009; Cacioppo et al., 2006; Hawkley & Cacioppo, 2010) posits that perceived social isolation, or loneliness is a serious risk factor, which increases hypervigilance for social threat accompanied by physical and mental health consequences (e.g., stress, negative thinking and expectation of negative social information and interaction, anxiety and depression). To expand evidence for the nature and related mechanisms underlying loneliness, the aim of this study is to examine the nomological network of loneliness. Further, this study investigates the network structure of loneliness and hypothesized relations of each dimension of loneliness with key theoretical constructs or conceptual domains using a range of criteria. Finally, this study aims to determine how resilience is involved in the protection against loneliness and depressive symptoms.
Nomological network research (Cronbach & Meehl, 1955) involves identifying robust patterns of relationships between the dimensions of loneliness and differentiable key conceptual domains or theoretical constructs that clarify the nature and related mechanisms underlying loneliness in all relationships. Analysis of the measurement model of loneliness provides empirical evidence for the structural and temporal stability through multigroup and longitudinal measurement invariance modeling. For example, the measurement model of loneliness has been operationalized as a two-dimensional construct (i.e., emotional and social loneliness; Weiss, 1998) and as a three-dimensional construct (i.e., family, romantic and social loneliness; DiTommaso & Spinner, 1993, 1997; DiTommaso et al., 2004). Furthermore, the nomological network of loneliness was assessed by explicating each dimension through concurrent and prospective relations with broadly grouped, important conceptual domains such as cognitive processes (e.g., worry, rumination and metacognition), negative emotionality (e.g., anxiety and depression), resilience domains, and their associations with demographic variables (e.g., gender, age, marital status).
Relations between loneliness and key conceptual domains
There is some evidence that, underlying the experience of loneliness are various maladaptive cognitive processes including worry, rumination, and metacognition (Anyan et al., 2020; Masi et al., 2011), which are implicated in the relations between loneliness and mental health problems such as anxiety and depressive symptoms (Anyan et al., 2020).
Worry is characterized by repetitive thinking about future events, uncertainty about anticipated threats, and the underestimation of personal agency and abilities (Borkovec, 1994; Nolen-Hoeksema et al., 2008; Papageorgiou & Wells, 2001). Few studies have examined relations between loneliness and worry (Anyan et al., 2020; Theeke et al., 2015). There is growing evidence that lonely people engage in negative self-assessment by thinking that others will reject their company. As a result, they often isolate themselves, which reinforces their experiences of loneliness (Anyan et al., 2020; Rokach, 2015). The role of worry in loneliness is unclear, and as such it is worthwhile to investigate whether repetitive thinking about diminished personal agency and controllability of future events influence the experience of loneliness in different relationships.
Nolen-Hoeksema et al. (2008) defined rumination as the process of repetitive thinking about negative feelings and emotions. Loneliness has been found to be positively associated with rumination (Borawski, 2019; Fang et al., 2020). The challenge for researchers has been to clearly delineate the mechanism by which loneliness and rumination are connected (Borawski, 2019). Focusing on the regulatory function of rumination might provide insight into elucidating the connection. The Self-Regulatory Executive Function Model (S-REF; Wells & Matthews, 1994, 1996) describes metacognitive beliefs as the knowledge base and the information processing system in which maladaptive thinking persist. Metacognitions are viewed as driving worry and rumination (Wells, 2009), and contribute to strengthen the relations between loneliness in social and romantic relationships and symptoms of anxiety and depression (Anyan et al., 2020). Studies of individual differences in experiences of loneliness have also found that lonely people engage in self-focused, negative assessment of their ability to initiate and maintain social relationships. As a result, they approach social encounters with interpersonal mistrust (Rokach, 2015).
Several cross-sectional and longitudinal studies have showed strong support for the relations between loneliness and common mental health problems (Cacioppo et al., 2010; Cacioppo et al., 2006; Lasgaard et al., 2011; Vanhalst et al., 2010; Vanhalst et al., 2012). Loneliness was found to correlate with depressive symptoms and to prospectively predict depressive symptoms. Specifically, loneliness remained as a unique risk factor for depressive symptoms after controlling for demographic covariates, marital status, and the psychosocial risk factors of perceived stress, low social support, and hostility (Cacioppo, 2010; Cacioppo et al., 2006). Some studies have reported only unidirectional relation for depressive symptoms predicting more loneliness over time (Lasgaard et al., 2011), as well as loneliness predicting changes in depressive symptoms over time (Cacioppo et al., 2010). Other studies have also found reciprocal relations between loneliness and depressive symptoms over time (Vanhalst et al., 2010; Vanhalst et al., 2012). Additional research to investigate prospective relations between loneliness and depressive symptoms therefore seemed fully warranted.
A meta-analysis of interventions to reduce loneliness concluded that most interventions have been designed to improve deficits in social skills, social support, social interaction, and maladaptive social cognition (Masi et al., 2011). Addressing psychological and social factors to improve social connectedness and quality of social interactions suggest promise for investigating how resilience (i.e., positive personal dispositions, family, and external social resources) is involved in overcoming loneliness. Resilience is the process and outcome of healthy adaptation despite significant adversity (Fergus & Zimmerman, 2005). Access to protective social resources associated with resilience has been shown to be involved in preserving adaptive mental health despite significant risk (Anyan, 2019; Anyan et al., 2020). The current study may lead to a greater understanding of how intrapersonal and interpersonal (social) resources represented in resilience protect against the effects of loneliness on common mental health problems (e.g. depressive symptoms). This study may also contribute to addressing psychological and social factors in a social-cognitive schema such as loneliness to improve social connectedness and quality of social relationships in interventions.
Relations between loneliness and demographic characteristics
The preponderance of loneliness research has examined how various demographic characteristics are associated with loneliness, including the associations between loneliness and age (Barreto et al., 2020; Griffin, 2010; Lasgaard et al., 2016; Luhmann & Hawkley, 2016), gender (Lasgaard et al., 2016; Maes et al., 2019; Nicolaisen & Thorsen, 2014) and marital status (Lasgaard et al., 2016; Nicolaisen & Thorsen, 2014).
A recent study that analyzed the frequency of loneliness reported by participants 16 to 99 years with data from 237 countries across the world concluded that older people reported less frequent loneliness than younger people (Barreto et al., 2020). Other studies have found no age effects (Griffin, 2010) or a shallow U-shaped distribution where the highest levels of moderate and severe loneliness were seen among adolescents and older people than those in emerging adulthood in a population-based study using survey and register data from a representative Danish sample (Lasgaard et al., 2016). Another study also found a complex nonlinear trajectory, with elevated loneliness levels among young adults and among the oldest age group in a large, nationally representative German sample (Luhmann & Hawkley, 2016). These studies raise important questions for investigating the age-loneliness relations in different developmental periods across the lifespan as different developmental periods present different challenges and opportunities. For example, expectations for adolescents and young adults to form intimate friendships or conform to peer groups while at the same time developing independence from friends and family may result in imbalance and tensions leading to loneliness (Qualter et al., 2013, 2015).
Gender has received increased attention as a key factor for loneliness, but in our review the results were largely inconsistent, and no consensus has been reached. Various hypotheses have been put forward to suggest that a decline in family time and time spent alone from adolescence onward account for males reporting higher loneliness than females. This is also because females replace decline in family time with time spent with peers (Koenig & Abrams, 1999). Time spent alone, however, does not tell much about the discrepancy between desired and actual social relationships raising doubts about this gender difference hypothesis (Maes et al., 2019). Middle-aged females (Lasgaard et al., 2016) and older aged females (Nicolaisen & Thorsen, 2014) have been found to report moderate to severe loneliness more frequently. The most recent meta-analysis of the gender differences in loneliness does not support significant differences (Maes et al., 2019). Furthermore, the authors indicated that although results have pointed to different directions, gender differences may exist depending on the specific relationship in which loneliness is experienced (i.e., romantic, family, and social loneliness). Thus, the current study will contribute to the body of knowledge on gender differences in the experience of loneliness in different relationships.
Marital status has also received attention in loneliness research. For example, living alone (e.g., widowed) was strongly associated with moderate loneliness after adjusting for other covariates more than being divorced and never married (Lasgaard et al., 2016). Similarly, Nicolaisen and Thorsen (2014) also found that being unmarried, widowed or divorced was significantly associated with more loneliness than being married or in cohabitation. Unmarried/non-cohabitant men reported more loneliness than their women counterparts. As studies have reported differences in loneliness among different age groups, as with differences in gender, this raises important questions about the interaction between age and gender and the interplay with partner (marital) status.
The current study
The overarching aim in this study was to investigate the nature and related mechanisms underlying loneliness in different social relationships (i.e., romantic, family, and social loneliness). This was achieved by investigating the nomological network of loneliness through explicating each dimension of loneliness in an expansive and robust pattern of relationships with key conceptual domains and theoretical constructs. This study also sought to determine how resilience is involved in the protection against loneliness and depressive symptoms for intervention practice. We aimed to identify a robust measurement model of loneliness and evidence for its structural validity through measurement invariance analysis across gender and time (T1 and T2). Based on previous studies (DiTommaso et al., 2004; Lasgaard, Goossens, & Elklit, 2011), it was hypothesized that structural analyses would support a three-dimensional measurement model of loneliness (Hypothesis 1). Next, we employed the conceptual framework of psychological network analysis to investigate the causal associations between indicators that measure loneliness. This is a different approach from the common factor perspective which assumes that an underlying common cause or latent factor reflects the covariance in the indicators of loneliness. Network analysis allows for the examination of the importance or centrality of the causal indicators to be empirically determined (Borsboom & Cramer, 2013).
Based on previous studies (Anyan et al., 2020; Borawski, 2019; Fang et al., 2020; Theeke et al., 2015) positive relations were expected between loneliness and worry, rumination, and metacognition (Hypothesis 2). Similarly, based on previous studies (Cacioppo et al., 2006, 2010; Vanhalst et al., 2010, 2012) positive relations were expected between loneliness, anxiety, and depressive symptoms (Hypothesis 3). Hypothesis 4 tested resilience as moderating the relations between loneliness and depressive symptoms. Participants scoring higher on resilience were expected to show lower effect of loneliness on depressive symptoms than participants scoring lower on resilience. Finally, Hypothesis 5 tested the relations between loneliness and demographic covariates. Significant age differences were expected based on previous studies (Barreto et al., 2020; Lasgaard et al., 2016; Luhmann & Hawkley, 2016). It was expected that being married or cohabiting would be associated with lower levels of loneliness (Lasgaard et al., 2016; Nicolaisen & Thorsen, 2014). Gender differences were not expected (Maes et al., 2019).
Materials and methods
Participants and procedure
Students at the Norwegian University of Science and Technology were invited to take part in the study at two different times, separated by 3 months. Participants had to be 18 years or above to participate in the study. There were no exclusion criteria. Four hundred and eighty-two students with a mean age of 25.84 (SD = 5.74) years participated (N = 482; 59% females). Forty-three participants did not report their gender. Regarding partner status, 174 reported as being single, 117 reported having a boy/girlfriend, 145 were in cohabitation, 46 were married. Mean years of education was 16.45 (SD = 2.81). Participants at Time 1 were (N = 440; Females = 64%). Participants at Time 2 were (N = 283; 63% females). Participants who completed T1 & T2 were (N = 241; 65% females). The project was approved by the Norwegian Ethics committee with number 2016/339.
Instruments
The Social and Emotional Loneliness Scale for Adults (SELSA-S; DiTommaso et al., 2004), is a 15-item self-report questionnaire assessing the nature, duration, and intensity of loneliness. Respondents rated each questionnaire item on a scale from 1 (Strongly disagree) to 7 (Strongly agree). Family, romantic, and social loneliness make up the three subscales of the SELSA-S. High scores indicate high levels of loneliness. A bilingual translator translated the SELSA-S from English to the Norwegian language. A second bilingual translator did a backward translation independently. In the end, they decided on a consensus questionnaire. The Penn State Worry Questionnaire (PSWQ; Fresco et al., 2002) is a 16-item self-report questionnaire assessing the degree to which individuals typically perseverate about upcoming life events. Respondents rated each questionnaire item on a scale from 1 (Not at all typical of me) to 5 (Very typical of me). Absence of worry and worry engagement make up the two subscales of the PSWQ. The PSWQ has already been used in Norway (Pallesen et al., 2006). Cronbach’s alpha T1 = .94; T2 = .95. The Ruminative Response Scale (RRS; Treynor et al., 2003) is a 10-item self-report questionnaire assessing rumination. Brooding and reflection make up the two subscales. Respondents rated each questionnaire item on a scale from 1 (Almost never) to 4 (Almost always). Higher scores indicate higher levels of rumination. The RRS has already been used in Norway (Hjemdal et al., 2019). Cronbach’s alpha T1 = .93; T2 = .94. The Metacognitions Questionnaire-30 (MCQ-30; Wells & Cartwright-Hatton, 2004) is a generic questionnaire used to assess dysfunctional metacognitive beliefs. Respondents rated each questionnaire item on a scale from 1 (Do not agree) to 4 (Agree very much). The MCQ-30 consists of five subscales namely, lack of cognitive confidence, positive beliefs about worry, cognitive self-consciousness, negative beliefs about uncontrollability and danger, and need to control thoughts. High scores indicate more dysfunctional metacognitive beliefs. The MCQ has already been used in Norway (Grøtte et al., 2016). Cronbach’s alpha T1 = .90; T2 = .90. The Hopkins Symptom Checklist-short form (HSCL-10; Nguyen et al., 1983) is a 10-item self-report questionnaire assessing psychological distress. Respondents rated each questionnaire item on a scale from 1 (Not at all) to 4 (Extremely). Symptoms of anxiety and depression form the two subscales of HSCL. The HSCL-10 has been used in Norway (Haavet et al., 2011). Cronbach’s alpha T1 = .90; T2 = .90. The Resilience Scale for Adults (RSA; Friborg et al., 2003; Hjemdal et al., 2001) is a 33-item self-report questionnaire assessing resilience. Respondents rated each questionnaire item on a 7-point semantic differential scale format. The RSA was developed in Norway and consists of six subscales namely, perception of self, planned future, social competence, family cohesion, social resources, and structured style. Higher scores indicate higher levels of resilience protective factors. Cronbach’s alpha T1 = .92; T2 = .92.
Statistical analyses
Basic correlation, group mean difference tests and regression were performed in SPSS version 25. Network analyses were performed in R version 3.6.3 (R CoreTeam, 2013). All other analyses were performed in Mplus version 7.4 (Muthén & Muthén, 1998–2015) using robust full-information maximum likelihood (MLR). As a first step in the structural validity analyses (Hypothesis 1), we established a well-fitting measurement model of loneliness. Next, configural, metric and scalar models were compared across gender using the sample at Time 1 (structural stability) and across time in the sample completing Time 1 and Time 2 (consistency of measurement model).
Network analysis was used to map out the network structure between items measuring loneliness using the sample at Time 1. A correlation matrix of the items was computed and used as input to estimate a Gaussian Graphical Model (GGM) that estimates pairwise association between all indicators (i.e., nodes) (Epskamp & Fried, 2018). To avoid spurious connections due to the many estimated parameters, the Graphical LASSO was used to regularize the parameters resulting from the GGM. The network was estimated using qgraph (Epskamp et al., 2012), glasso (Friedman et al., 2014) and bootnet (Epskamp et al., 2018) for checking network accuracy and stability. Additional descriptions of the network analysis are contained in the Supplementary Material, Page 3.
The remaining analyses were conducted using samples completing Time 1 and Time 2. Zero-order correlations, and SEM (partial-correlations for predicting unique variance) were conducted to investigate concurrent and prospective relations between loneliness and subcomponents with worry, rumination, metacognition (Hypothesis 2), anxiety and depressive symptoms (Hypothesis 3). Moderation analyses were conducted using PROCESS MODEL 1 to investigate the moderation effect of resilience in the prospective relation between loneliness and subcomponents at T1 on depressive symptoms at T2 (Hypothesis 4). The effects of various sociodemographic variables on loneliness and its subcomponents were investigated using regression analysis, independent t-tests, and multivariate analyses of covariance. All Mplus and R codes together with output files are available on the Open Science Framework https://osf.io/ae2pf/?view_only=028a3d0455914f099b4e722560c3c18e
Results
Test of structural stability and measurement model consistency
At both timepoints, the one (χ2 = 1760.709, df = 90, p < .001; SRMR = .229; RMSEA = .206 [90% CI = 0.198, 0.214]; CFI = .467; TLI = .378) and two- (χ2 = 1191.751, df = 89, p < .001; SRMR = .185; RMSEA = .168 [90% CI = 0.160, 0.177]; CFI = .648; TLI = .585) dimensional measurement model of loneliness did not reach acceptable fit. The three-dimensional measurement model with an error covariance provided an adequate fit to the data at T1 (χ2 = 218.204, df = 86, p < .001; SRMR = .053; RMSEA = .059 [90% CI = 0.050, 0.069]; CFI = .958; TLI = .948) and adequately replicated at T2 (χ2 = 163.206, df = 86, p < .001; SRMR = .062; RMSEA = .057 [90% CI = 0.043, 0.070]; CFI = .964; TLI = .956). Therefore, this model was retained (Figure S1 in Supplementary Material, Page 2). The correlation between T1 and T2 was r = .82, p < .001. Across gender, the unconstrained configural (χ2 = 325.061, df = 172, p < .001; RMSEA = .064; CFI = .953), the constrained metric (χ2 = 333.658, df = 184, p < .001; RMSEA = .061; CFI = .954) and scalar (χ2 = 371.245, df = 196, p < .001; RMSEA = .064; CFI = .946) models fitted the data adequately with change in model fit indicating support for metric (ΔCFI = .001; ΔRMSEA = −.003) and scalar (ΔCFI = −.008; ΔRMSEA = .003) invariance when testing comparative model fit in measurement invariance (Chen, 2007; Cheung & Rensvold, 2002). Model fit across time was acceptable for the unconstrained configural (χ2 = 664.760, df = 373, p < .001; RMSEA = .057; CFI = .941), the constrained metric (χ2 = 685.209, df = 385, p < .001; RMSEA = .057; CFI = .939) and scalar (χ2 = 698.113, df = 397, p < .001; RMSEA = .056; CFI = .939) models with change in model fit indicating a trivial decrease in fit between configural and metric (ΔCFI = −.002; ΔRMSEA = .000), and between metric and scalar (ΔCFI = .000; ΔRMSEA = .002) models (Chen, 2007; Cheung & Rensvold, 2002). These results also permit subsequent prospective analyses such that observed changes in loneliness scores reflect true changes in participants across time not the measurement instrument.
Test of network structure
Figure 1(a) shows a visualization of the network structure of the 15-item SELSA-S, examining whether the observed indicators are causally connected. Figure 2(a) shows the bootstrapped confidence interval of edge weights. Subset bootstrap showed that order of node strength centrality was more stable than the order of betweenness and closeness (Figure 2b). This is consistent with centrality measure for node strength (0.75), betweenness (0.13) and closeness (0.05). Overall, the items were positively connected within the network, and especially strong connections emerged between SF4 and SF5, both belonging to family loneliness. Strong connections also emerged between SS5 and SS3, both belonging to social loneliness. Finally, SR3 and SR5 were strongly connected, and SR4 strongly connected to SR1 and SR2 but the strongest connection for romantic loneliness emerged between SR1 and SR2. The standardized estimates of betweenness, closeness and strength centrality indices are presented in Figure 1(b).
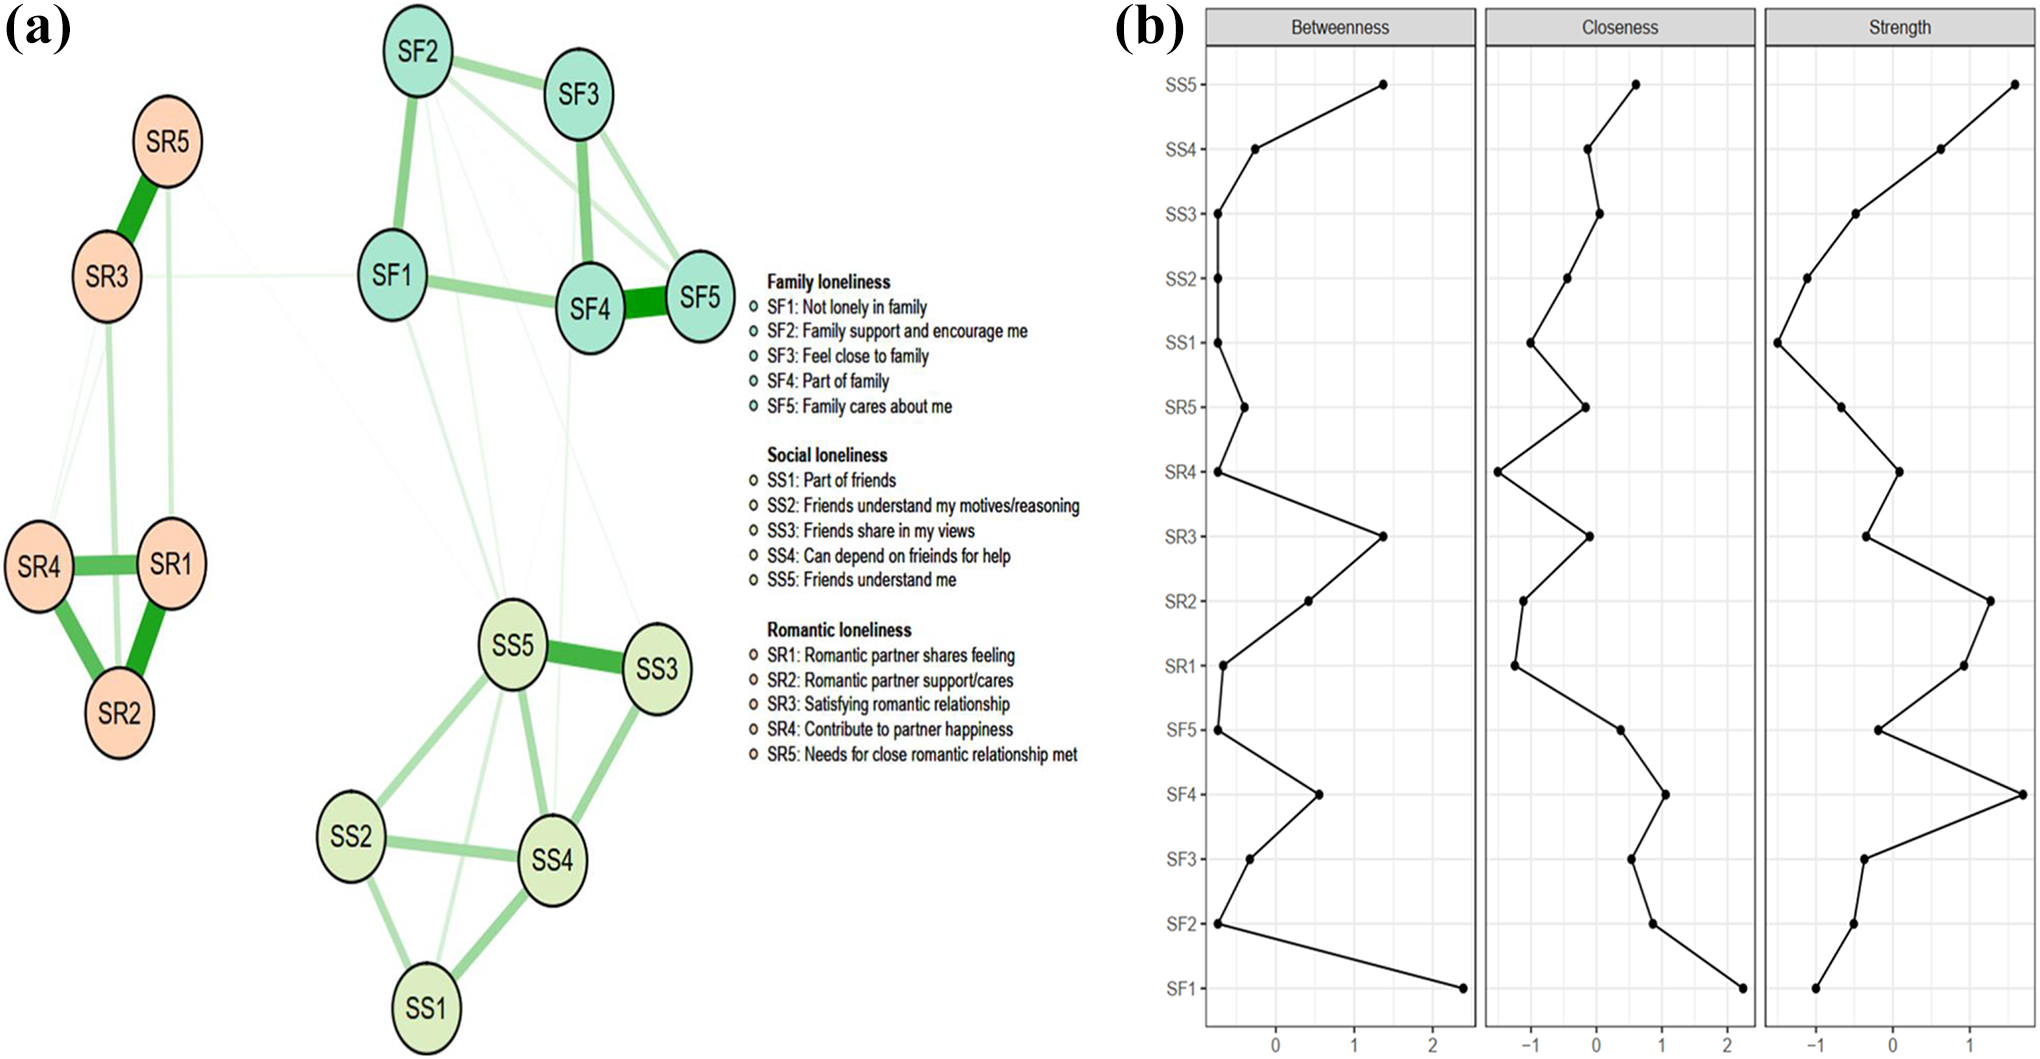
(a) Network containing the 15 items of the SELSA-S showing positive connections in green while thickness and brightness of an edge indicate the connection strength. The online version of the manuscript has the colored rendition of Figure 1. (b) Betweenness, closeness, and node strength centrality estimates for the 15-item SELSA-S.
The five nodes with the highest node strength centrality (i.e., how strongly a node is directly connected with the network) were SF4 (1.19), SS5 (1.18), SR2 (1.12), SR1 (1.06), and SS4 (1.00) whereas SS1 (0.62) and SS2 (0.69) were the least central nodes with a substantial drop in node strength. Additional results (Figure S2: edge weight and, Figure S3: node strength difference tests) are contained in the Supplementary Material, Pages 4–5.
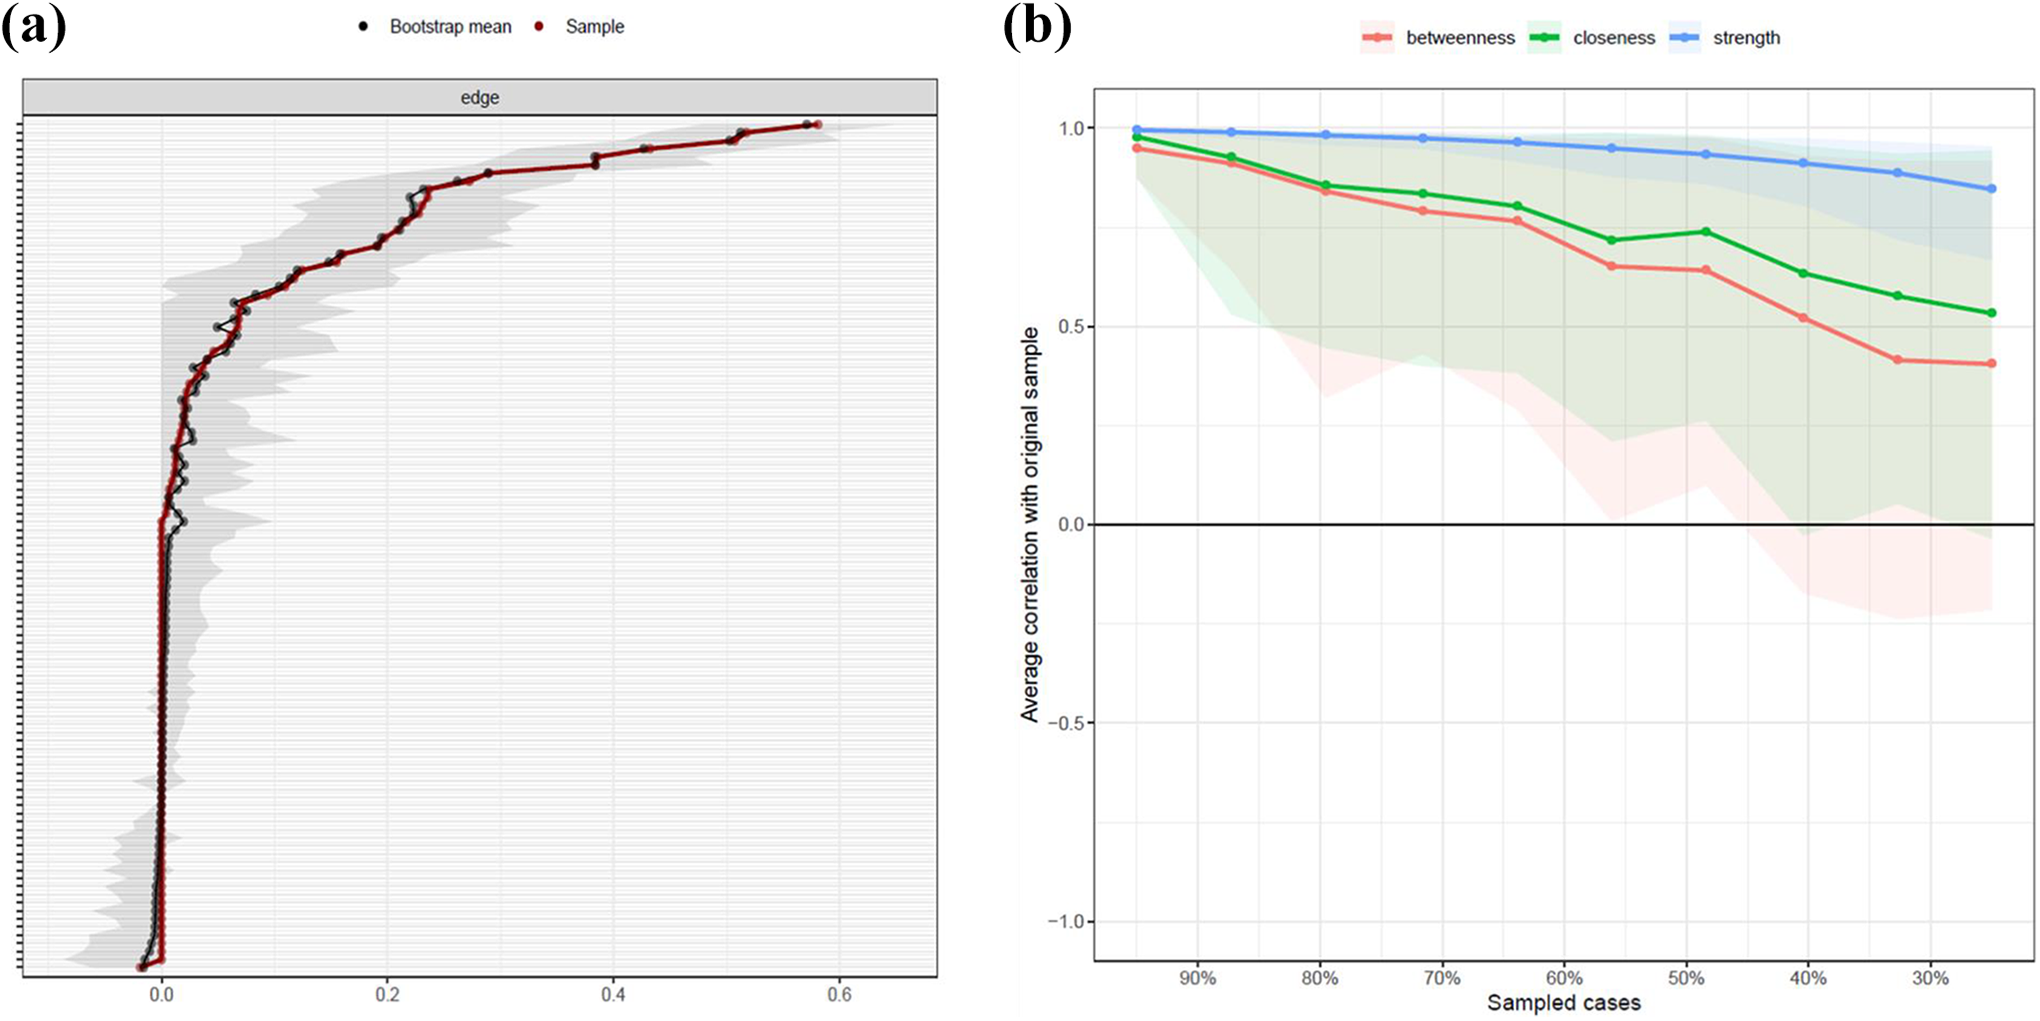
(a) Bootstrapped confidence intervals (CIs) of the edge weights in the 15-item network. The red line indicates the edge weight values and the gray area represents 95% CIs. (b) Centrality stability coefficient for node strength (0.75), betweenness (0.13) and closeness (0.05). Subset bootstrap for the network structure that shows the average correlations between centrality indices of the original network constructed on the full data with networks estimated on fewer samples. The node strength is highly stable, supporting our reliance on the strength centrality index and interpretations of highest and lowest nodes.
Relation to conceptual domains
Associations between composite scores of observed variables were assessed with zero-order correlations. Structural equation modeling (SEM) was used for latent variable associations (Table 1). Subscales of latent factors were included in the analyses, providing additional insight into relations between loneliness and key conceptual subdomains. We focused on p < .001, since the number of analyses inflated Type-1 error. In the SEM analyses, the three-dimensional measurement model of loneliness was retained. All models fitted the data acceptably (see Supplementary Material Figures S4a to S8b, Pages 8–12).
Cognitive, emotionality and psychosocial domains with loneliness: Pearson correlations and SEM pathways (SEM figures are contained in Supplementary Material, Pages 8–12).
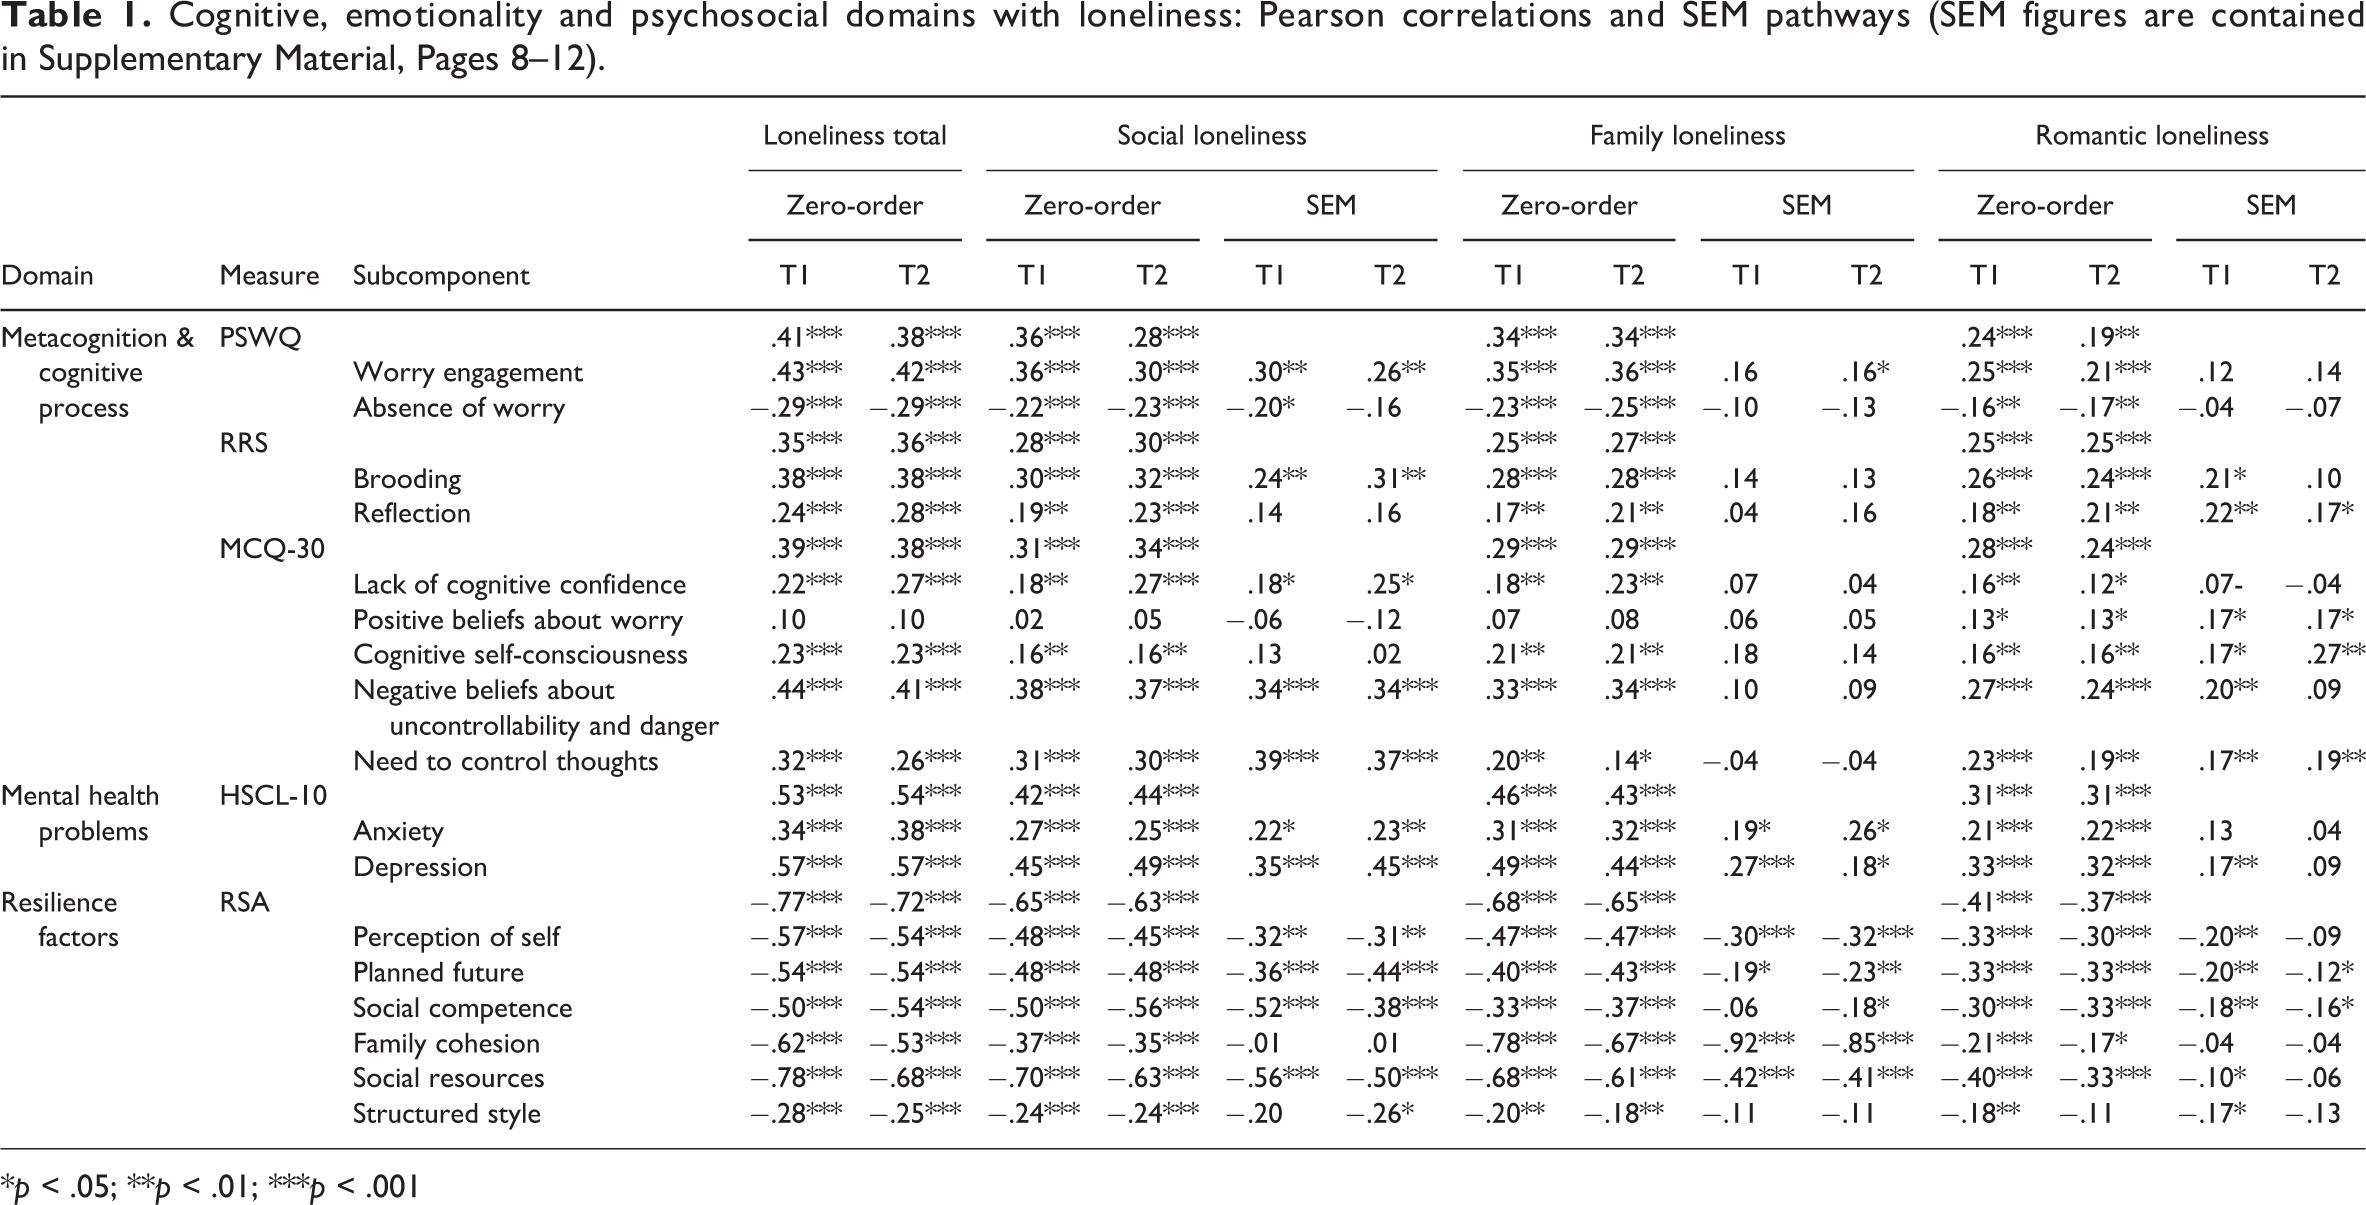
*p < .05; **p < .01; ***p < .001
Metacognitions and cognitive processes
Loneliness was concurrently (Time 1) and prospectively (TI → T2) associated with worry and the worry engagement subscale. Furthermore, loneliness was concurrently and prospectively associated with rumination and its brooding and reflection subscales. Finally, loneliness was concurrently and prospectively associated with metacognition and the following subscales (i.e., lack of cognitive confidence, cognitive self-consciousness, negative beliefs about uncontrollability, and need to control thoughts, but not positive beliefs about worry). The social loneliness dimension uniquely predicted both negative beliefs about uncontrollability and danger as well as need to control thoughts at T1 and T2. Loneliness and the social loneliness dimension mostly predicted cognitive vulnerabilities (i.e., worry, rumination, and metacognition).
Levels of anxiety and depressive symptoms
As expected, loneliness and its social and family loneliness dimensions were concurrently and prospectively associated with the HSCL-10 total score and symptoms of anxiety and depression. The social loneliness dimension uniquely predicted depressive symptoms at T1 and T2. The family loneliness dimension uniquely predicted depressive symptoms at T1.
Resilience factors
Loneliness and its social, family, and romantic loneliness dimensions were concurrently and prospectively associated with resilience total and its subscales (perception of self, planned future, social competence, family cohesion, and social resources). The social loneliness dimensions uniquely predicted planned future and social competence at T1 and T2. The family loneliness dimension uniquely predicted family cohesion and social resources at T1 and T2.
Moderation of prospective relations between loneliness and depressive symptoms
Resilience significantly moderated the effect of loneliness (Unstandardized: B = −.03, SE = 0.02, t = −2.06, p < .05, R2 = .57, interaction ΔR2 = .01), social loneliness dimension (B = −.08, SE = 0.03, t = −2.11, p < .05, R2 = .57, interaction, ΔR2 = .01), and family loneliness dimension (B = −.07, SE = 0.03, t = −2.13, p < .05, R2 = .58, interaction ΔR2 = .01), but not romantic loneliness (B = −.06, SE = 0.03, t = −1.77, p = .08) on depressive symptoms. Overall, the results support the protective effects of resilience against loneliness related depressive symptoms (Figure 3).
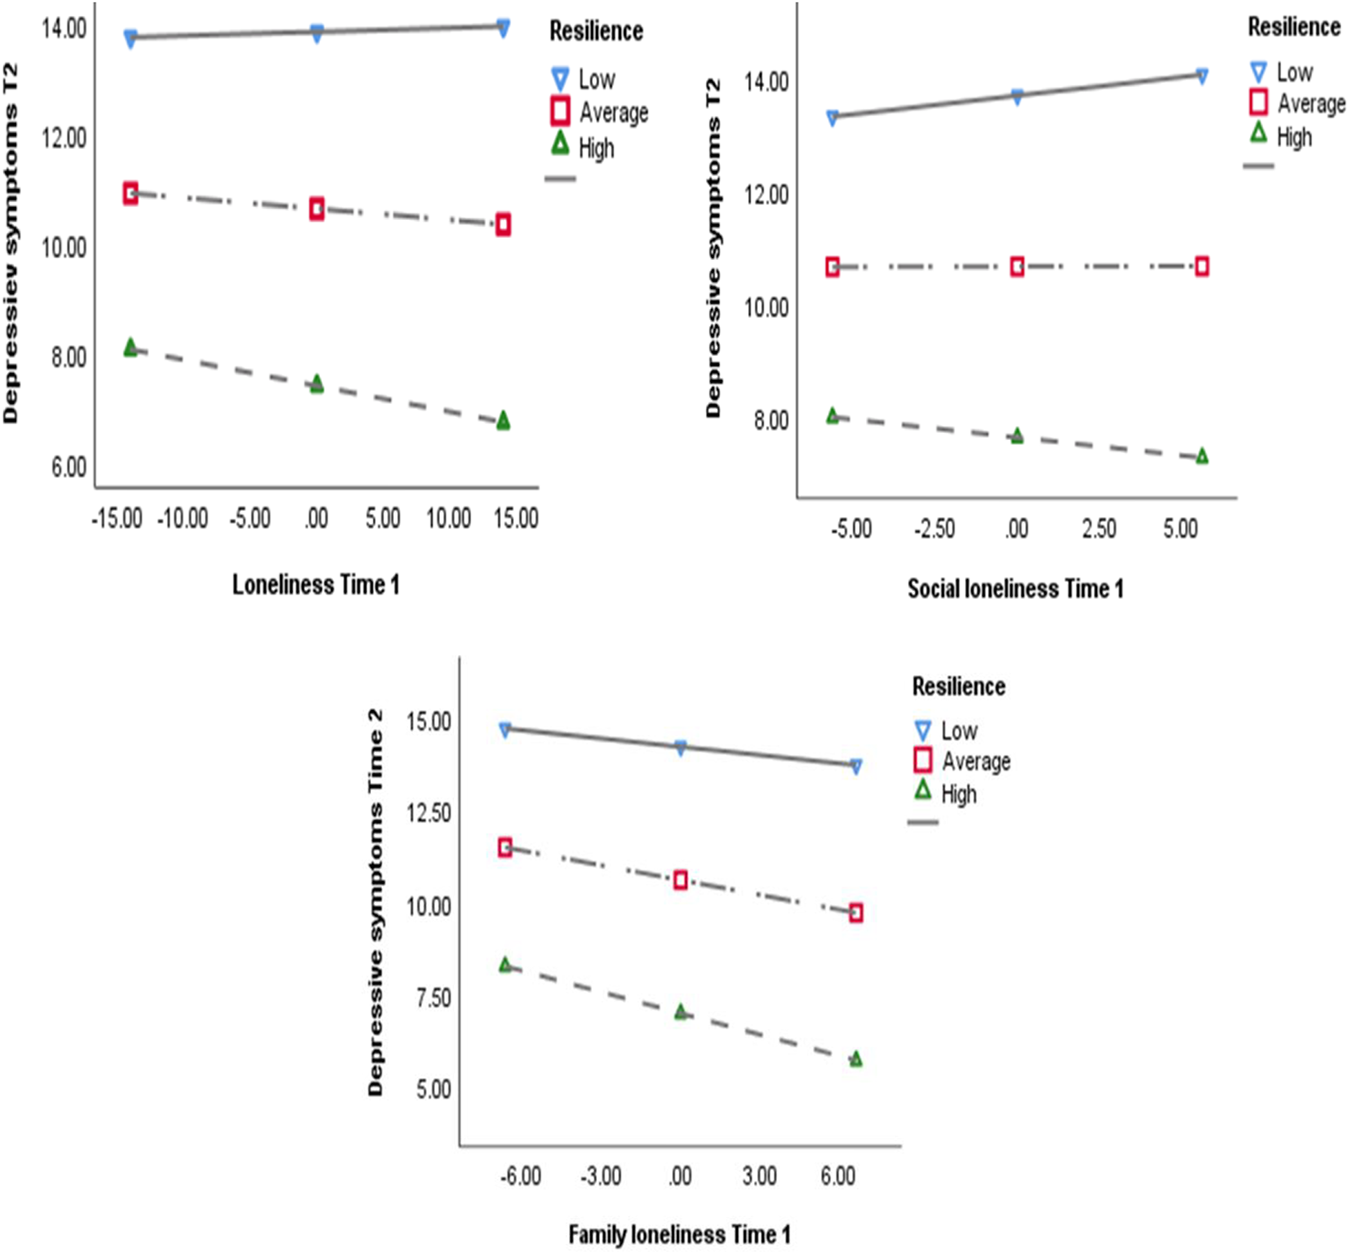
Moderation effect of resilience in the prospective relations between loneliness, social loneliness, family loneliness and depressive symptoms.
Age effects
The regression of loneliness at T1 on age was only marginally significant (Standardized β = .14, SE = .19, t = 1.96, p = .051, R2 = .01), but significant at T2 (β = .23, SE = .19, t = 2.98, p < .01, ΔR2 = .04). Age did not significantly predict the social loneliness dimension at T1, but at T2 (β = .17, SE = .08, t = 2.13, p < .05, ΔR2 = .02). Age did not significantly predict the family loneliness dimension neither at T1 nor T2. Age significantly predicted the romantic loneliness dimension at T1 (β = .21, SE = .07, t = 3.74, p < .001, ΔR2 = .03) and T2 (β = .18, SE = .07, t = 2.86, p < .01, ΔR2 = .02). The results support age differences in loneliness and the social and romantic loneliness dimensions, but not the family loneliness dimension.
Partner (marital) status effect
One-way MANCOVA was conducted for partner status (single, girl/boyfriend, cohabitation and married) with loneliness and the three dimensions separately at T1 and T2 as the dependent variables. Post hoc pairwise comparisons were conducted with Scheffé test. The multivariate effects on the combined dependent variables was significant (Wilks’ lambda: λ = .37, F(18, 572) = 13.486, p < .001, partial η 2 = .284). Follow-up tests revealed significant effects of marital status on loneliness at T1 F(3, 207) = 24.58, p < .001, partial η 2 = .26. The following group mean differences were observed when being single is used as the reference group; married (MD = −15.76, 95% C.I: −24.650, −6.874), girl/boyfriend (MD = −15.72, 95% C.I: −21.892, −9.540), cohabitation (MD = −14.43, 95% C.I: −20.342, −8.514). Significant effects were found for loneliness at T2, F(3, 207) = 14.09, p < .001, partial η 2 = .17; with the following group mean differences; cohabitation (MD = −12.52, 95% C.I: −18.711, −6.326), girl/boyfriend (MD = −12.03, 95% C.I: −18.493, −5.560) and married (MD = −9.58, 95% C.I: −18.894, −0.282). Participants who were single reported the highest loneliness at T1 and T2, whereas participants who were married and those with a girl/boyfriend reported the least at T1. Similarly, participants in cohabitation and those having a girl/boyfriend reported the least loneliness at T2. When investigating the three loneliness dimensions (see Supplementary Material Table S1, Pages 6–7), participants with a girl/boyfriend reported less social loneliness at both T1 and T2. Participants in cohabitation reported less romantic loneliness. Interestingly, participants who were married reported slightly higher social loneliness than participants who were single at T2.
Gender effects
No significant gender differences were found between men and women for loneliness as well as for the three dimensions of loneliness at T1 and T2.
Discussion
To the best of our knowledge, this is the first study to broadly investigate the structural validity of the short version of the Social and Emotional Loneliness Scale (SELSA-S), and the nature and related mechanisms underlying loneliness through an investigation of its nomological network in a Norwegian sample. Additionally, this study investigated how resilience is involved in the protection against loneliness and depressive symptoms. Several hypotheses were developed and investigated based on theory and previous studies.
Multidimensionality of loneliness and the centrality of loneliness indicators for intervention
Through analyses of the structural properties of the SELSA-S, a three-dimensional measurement model was supported, providing strong validity evidence as a measure of the multidimensional experiences of loneliness—family, romantic and social loneliness. Importantly, when an instrument is adapted into another language, support for configural and metric invariance across gender and time brings the assessment of loneliness in a Norwegian sample using SELSA-S into much relief. The implication for this finding is that Norwegian men and women understand or interpret the indicators of loneliness in a comparable fashion and that observed changes reflect true changes in participants across time, not the measurement instrument. Since our findings meant that all participants understood and interpreted the indicators of loneliness in a comparable fashion, we considered it important to investigate which indicators are central in their causal associations within the framework of psychological network analysis.
New and interesting information were found on the multidimensional experiences of loneliness that highlight potential areas of interest for intervention practice. Using network analysis, we found evidence that the experience of loneliness is not merely a consequence of an underlying latent variable that reflects the indicators, but loneliness results from the causal interactions between different components. In this way, intervention to reduce loneliness can become more effective by acting on highly connected indicators (nodes) as well as the nodes with the highest node strength centrality (e.g., SF4 “I feel part of my family”). Especially strong connections emerged between SF4 and SF5 (“My family really cares about me”), both belonging to the family loneliness subcomponent. According to Borsboom and Cramer (2013), the more highly connected indicators are the central or more important indicators that are likely to spread activation in the network. Thus, from a network perspective, loneliness indicators in family relationships are more likely to set and spread activation of loneliness. Hence, interventions to combat loneliness that target self-focused negative thinking in the form of worry or metacognitive beliefs underlying the feeling of loneliness (Anyan et al., 2020) may now be designed to influence perception of family relationships. Our findings may explain why previous loneliness reduction interventions to improve social skills through training, enhancing social support or increasing opportunities for social contact have been ineffective (Masi et al., 2011). Probably, because they did not include a component that addressed loneliness in the family environment, nor did they directly address worry, rumination, and metacognitions or fortifying resilience related factors. This needs to be further researched and supported empirically by intervention research.
Developing a deeper understanding between background characteristics and loneliness
By investigating associations between each dimension of loneliness with demographic variables, worry, rumination, metacognition, symptoms of anxiety and depression, and resileince, we developed a deeper understanding of the multidimensional experiences of loneliness. We did not find gender differences in loneliness or in the three dimensions of loneliness, supporting conclusions from the most recent meta-analysis of the gender differences in experiences of loneliness (Maes et al., 2019). Maes et al. (2019) argued that there is no convincing theoretical notion that guide investigations into the gender differences across the developmental lifespan, which make it difficult to understand or explain the largely inconsistent findings.
Age did not predict loneliness in family relationships. However, age significantly positively predicted loneliness in social relationships at T2 and loneliness in romantic relationships at T1 and T2. Other studies have found that older age groups in Norway (Nicolaisen & Thorsen, 2014), adolescents and older people in Denmark (Lasgaard et al., 2016), young adults and older adults in Germany (Luhmann & Hawkley, 2016) reported significantly more loneliness. In this study, it could be explained that increasing age had an impact on social and romantic loneliness because as people advanced in age, the connections in their social and close intimate relationships diminish. However, an interesting opposing view could also be that, when people advance in age, they put more value on their social relationships; hence becoming more vulnerable as the relationships become more important for them. However, our findings and interpretations are not conclusive as more longitudinal research is needed to investigate the age-loneliness relations in a developmental trend across the human course of life. Recently, it was found that changes in loneliness across the lifespan may be related to individual experiences and cannot be an age-specific phenomenon (Mund et al., 2020).
Consistent with previous studies (Lasgaard et al., 2016; Nicolaisen & Thorsen, 2014) we found that participants who were single broadly reported the highest loneliness whereas being married, in cohabitation or having a girl/boyfriend mainly reported low loneliness. This highlights the importance of access to social needs, contacts or relationships for overcoming vulnerability in loneliness as human beings are social by nature. The need to belong as well as other social needs constitute a fundamental motivation that drives an individual’s thoughts, emotions, and interpersonal behavior (Heinrich & Gullone, 2006).
Loneliness in relation to worry, rumination, metacognition, and the influence on levels of anxiety and depressive symptoms
Loneliness and the three dimensions were broadly positively associated with worry and the worry engagement subscale, also with rumination and both brooding and reflection subscales, and finally with metacognition and subscales (i.e., lack of cognitive confidence, cognitive self-consciousness, negative beliefs about uncontrollability, and need to control thoughts). It was not surprising to find that loneliness and absence of worry were negatively associated, indicating that lower scores on loneliness is associated with higher scores on absence of worry. Noticeably, social loneliness uniquely predicted both negative beliefs about uncontrollability and danger as well as need to control thoughts at both T1 and T2 (SEM paths at p < .001). Lonely people engage in self-focused negative assessment of their ability to initiate and maintain social relationships, thinking that others will criticize and reject their company (Rokach, 2015). Repeatedly suppressing or thinking about negative feelings and emotions usually backfires (Nolen-Hoeksema et al., 2008), and may increase negative thoughts and feelings about socially undesirable attributes, social rejection, or exclusion by others, which can lead to difficulties in social interactions or relationships. As a result, this could create difficulties in social and interpersonal encounters that can reinforce and exacerbate the feeling of loneliness. Compared to nonlonely people, lonely people attribute their perception of interpersonal failures and rejections to personal unchangeable characteristics such as personality traits, rather than to situational or more changeable personal characteristics such as efforts to improve interpersonal encounters (Heinrich & Gullone, 2006). Not surprisingly then, recent calls for interventions to address vulnerabilities in factors such as worry or metacognitive beliefs may significantly reduce loneliness (Anyan et al., 2020).
Loneliness and the three dimensions were broadly associated with levels of anxiety and depressive symptoms, supporting previous studies (Lasgaard et al., 2011; Vanhalst et al., 2010, 2012). Social loneliness uniquely predicted depressive symptoms at both T1 and T2 (SEM paths at p < .001) while family loneliness uniquely predicted depressive symptoms at T1. The feeling of loneliness is found to involve negative and disturbing emotions such as sense of failure and futility, sadness, unlovability and unwantedness, loss, unattractiveness and hopelessness, helplessness and dejection (Heinrich & Gullone, 2006; Rokach, 2015; Siracusano, 2017) that may explain the relations between social loneliness and depressive symptoms. Perseverative thinking related to these topics may be variations of worry and rumination, which are driven by metacognitions (Wells, 2009). It will be important to explore how addressing worry, rumination and metacognitions may be used to develop new interventions for loneliness.
Resilience shows promise as a protective factor against loneliness
Resilience shows promising results for adaptive mental health and has become an auspicious intervention initiative for being one of the most integrative concepts with an interdisciplinary approach and cost-effective implementation (Anyan, 2019; Anyan et al., 2018). Loneliness and the three dimensions showed significant negative associations and unique relations at both T1 and T2 with resilience and its subscales, but less so for the structured style subscale. Perception of self and family cohesion showed significant and unique protection against family loneliness whereas planned future and social competence showed unique protection against social loneliness. Social resources showed the broadest unique effects against both social and family loneliness (all at p < .001). The definition of the various resilience factors by Hjemdal et al. (2001), Hjemdal, Friborg, Stiles, Rosenvinge, & Martinussen, (2006)) may shed some useful insight into understanding how resilience factors contribute to overcome loneliness in different relationships. In this regard, it can be argued that trust and confidence in one’s own abilities and shared familial values and mutual appreciation contribute to overcome the loneliness in family environment whereas a preference for making plans and believing in one’s own success and being flexible in social encounters contribute to overcome social loneliness. These resilience factors are at the opposite end of what typically lonely people exhibit such as negative self-assessment of ability to initiate and maintain social relationships, interpersonal mistrust, and the expectation that others will criticize and reject their company. Finally, access to external social support networks outside the family, including relatives and friends may contribute to overcome both social and family loneliness. Resilience moderated the prospective relations between loneliness, the social and family loneliness dimensions, and depressive symptoms. This indicates that more access to protective factors involved in resilience can counteract the negative effects of loneliness in social and family relationships. Resilience represents intrapersonal and interpersonal resources that can overcome discrepancy in desired and actual levels of social relationships. Our findings also show that not all lonely people will develop mental health problems with elevated levels of depressive symptoms if they have more access to resilience factors in their life, supporting the protective model of resilience (Anyan, 2019; Anyan & Hjemdal, 2016; Fergus & Zimmerman, 2005; Hjemdal et al., 2006). Resilience-based interventions that address psychological and social factors to improve social connectedness and quality of social interactions may thus offer valuable contributions in reducing mental health problems related to loneliness.
Limitations and recommendations for future studies
Our results should be interpreted in the light of some limitations. Our sample consisted of only university students from one university in one city in Norway. When investigating multiple and complex hypotheses, the evidence from multiple datasets across the developmental lifespan as well as datasets from multiple countries would provide more robust findings and draw compelling conclusions to improve perspectives on the multidimensional experiences of loneliness. Interesting research questions that could be investigated across multiple cultural contexts and groups include whether the different demographic variables interact with culture or other factors in the key conceptual domains to predict loneliness. The item network analyses revealed that most of the strongest edges were shared between indicators that represented the same subcomponent of loneliness. However, we did not estimate a network structure for the loneliness subcomponents as our aim was to empirically determine the importance or centrality of the indicators measuring loneliness. Future studies of larger samples should address the domain network structure since loneliness consist of multidimensional experiences in family, social and romantic relationships.
Supplemental material
Supplemental Material, sj-pdf-1-spr-10.1177_02654075211033035 - Loneliness in social relationships: Mapping the nomological network of loneliness with key conceptual domains and theoretical constructs
Supplemental Material, sj-pdf-1-spr-10.1177_02654075211033035 for Loneliness in social relationships: Mapping the nomological network of loneliness with key conceptual domains and theoretical constructs by Frederick Anyan and Odin Hjemdal in Journal of Social and Personal Relationships
Footnotes
Acknowledgments
The authors are grateful to Lars Aaker, Martin Urke and Petter Leikanger Aasen for their support in collecting the data used in this study.
Funding
The author(s) received no financial support for the research, authorship, and/or publication of this article.
Open research statement
As part of IARR’s encouragement of open research practices, the author(s) have provided the following information: This research was/was not pre-registered. The data used in the research cannot be publicly shared but are available upon request. The data can be obtained via email. All Mplus and R codes along with results/output files are available on the Open Science Framework ![]() .
.
Supplemental material
Supplemental material for this article is available online.
References
Supplementary Material
Please find the following supplemental material available below.
For Open Access articles published under a Creative Commons License, all supplemental material carries the same license as the article it is associated with.
For non-Open Access articles published, all supplemental material carries a non-exclusive license, and permission requests for re-use of supplemental material or any part of supplemental material shall be sent directly to the copyright owner as specified in the copyright notice associated with the article.