
Abstract
Previous research on expectation updating in relation to psychopathology used to treat expectation-confirming information and expectation-disconfirming information as binary concepts. Here, we varied the extent to which new information deviates from prior expectations and examined its influence on expectation adjustment in both a false-feedback task (Study 1; N = 379) and a social-interaction task (Study 2; N = 292). Unlike traditional learning models, we hypothesized a tipping point in which the discrepancy between expectation and outcome becomes so large that new information is perceived as lacking credibility, thus entailing little updating of expectations. Consistent with the hypothesized tipping point, new information was deemed most valid if it was moderately positive. Moreover, descriptively, expectation update was largest for moderate expectation violations, but this effect was small (Study 2) or even nonsignificant (Study 1). The findings question the assumption of traditional learning models that the larger the prediction error, the larger the update.
Keywords
According to Beck’s cognitive model of depression (Beck, 1963; Beck et al., 1979), depression is related to dysfunctional beliefs about the self, the environment, and the future. As part of this “cognitive triad,” expectations—representing the subset of beliefs that refer to the likelihood of future events or experiences—have received particular attention in research on depression in recent years (Rief & Joormann, 2019). In particular, it has been demonstrated that negative expectations significantly affect the course of depressive symptoms (Horwitz et al., 2017; Kube, Siebers, et al., 2018). From a clinical point of view, an important question is whether negative expectations are adjusted when novel positive experiences are made. The research area concerned with this issue is the study of “belief updating” (Kube & Rozenkrantz, 2021; Sharot & Garrett, 2016). Several lines of research have converged on the finding that depression is related to difficulties in revising negative beliefs after novel positive experiences.
For instance, research has shown that depression is related to cognitive inflexibility, meaning that depressed people have difficulty adapting their beliefs to novel situations flexibly (Stange et al., 2017); thus, they have problems revising established negative beliefs when new positive information is received (Everaert et al., 2018, 2020). Likewise, research into interpretation biases has demonstrated that people with depression fail to use novel positive information to revise established negative interpretations (Everaert et al., 2018; Liknaitzky et al., 2017). Moreover, research has shown that depression is related to the maintenance of negative performance-related expectations despite positive performance feedback (Kube, Rief, et al., 2019). By contrast, depression does not seem to be associated with an increased integration of new negative information into previous beliefs (Brolsma et al., 2020; Kube, Kirchner, et al., 2019), which suggests that the main problem of depression is the reduced use of positive information to update established negative expectations rather than increased sensitivity to unexpectedly negative information.
To explain the phenomenon of persisting negative expectations, the concept of cognitive immunization was recently introduced (Rief et al., 2015). Cognitive immunization is regarded as a cognitive process by which disconfirmatory evidence is reappraised in such a way that the discrepancy between predicted and actual information is reduced (i.e., a form of cognitive dissonance reduction, according to Festinger, 1962). For example, unexpectedly positive performance feedback might be devalued by questioning its credibility or relevance. This hypothesis has been confirmed in a series of experimental studies in which the appraisal of positive performance feedback was modulated (Kube, Glombiewski, et al., 2019; Kube, Rief, et al., 2019).
Recently, it has been discussed how the magnitude of the difference between expected and actual outcome (i.e., reward, punishment) influences the extent to which prior expectations are updated (Kube, Schwarting, et al., 2020; Rief & Joormann, 2019). With reference to prominent learning models such as the Rescorla-Wagner (RW) model (Rescorla, 1967; Rescorla & Wagner, 1972) and their clinical applications (Craske et al., 2014), one would assume that, all else being equal (i.e., the learning rate), the greater the discrepancy between predicted and actual outcome, the larger the update. 1 Drawing on recent Bayesian frameworks, in which the aforementioned variables are conceptualized as probability distributions with means and variances, a competing hypothesis can be derived in this respect. Specifically, according to Bayesian frameworks of belief updating, such as “predictive processing,” a prior prediction is combined with new information to compute a posterior prediction, and the extent to which the prior is updated in line with new information (i.e., the prediction error) critically depends on the degree of precision (i.e., reliability) that is afforded to new information (Barrett & Simmons, 2015; Friston & Kiebel, 2009). More specifically, precision is regarded as a parameter that modulates learning from prediction errors in a way “to select the channels [a brain] listens to—by adjusting the volume or gain of prediction errors that compete to update expectations in higher levels” (Kanai et al., 2015, p. 3). In other words, the higher the degree of precision that is afforded to new information (computationally, the more weight is given to new information), the greater its influence on the posterior belief.
Recently, this perspective has been applied to the understanding of depression by suggesting that people with depression afford overly low precision to novel positive information, which results in the persistence of negative prior expectations despite positive disconfirming information (Barrett et al., 2016; Seth & Friston, 2016). In particular, it has been suggested that the relationship between the magnitude of the prediction error and the degree to which expectations are updated may not be linear (“the more, the better”) but inverse U-shaped (Kube, Schwarting, et al., 2020). This means that the update is supposed to be largest when the prediction error is moderate, whereas expectation update is assumed to be smaller for weak and extremely large prediction errors. Psychologically, the latter has been explained with reference to the concept of cognitive immunization: Extremely positive prediction errors might raise doubts about whether the source of information is trustworthy (e.g., receiving the feedback “You are the most intelligent person in the world”). In Bayesian terms, this means that extremely positive information is afforded little precision in relation to the prior; thus, new information has little influence on the posterior (Kube, Schwarting, et al., 2020). Although this hypothesis still needs to be tested in depression, evidence for such a tipping point was recently provided in pain research in which it was found that when the discrepancy between predicted pain and actually experienced pain becomes too large, the prediction error has reduced influence on the perception of painful stimuli (Hird et al., 2019).
Overview and Hypotheses
We conducted two experiments to investigate the update of negative expectations as a function of the discrepancy between prior expectations and new information. Specifically, we compared three feedback conditions (slightly positive vs. clearly positive vs. extremely positive) and examined their effects on expectation updating. According to the predictive processing account, assuming that extremely large prediction errors beg the potential of being afforded little precision, the update of prior expectations might be largest in the clearly positive condition (Kube, Schwarting, et al., 2020). Because this idea of a tipping point in which new information deviates so far from the prior that it has little influence on the posterior was recently confirmed in the context of pain perception (Hird et al., 2019), we expected the largest expectation adjustment in the event of clearly positive feedback and smaller adjustments for the slightly positive condition and the extremely positive condition. Moreover, because cognitive immunization has been theorized to be the psychological equivalent of affording little precision to new information in relation to prior beliefs (Kube, Rozenkrantz, et al., 2020; Kube, Schwarting, et al., 2020), we predicted that the engagement in cognitive-immunization strategies would be lowest in the condition with clearly positive feedback and would mediate the effects of the positivity of feedback on the update of initial expectations. If this mediation effect is significant, it would imply that differences in expectation updating in response to feedback (varying in its positivity) can be explained by the appraisal of that feedback.
Regarding depressive symptoms, we appealed to the aforementioned previous work to assume that the update of previous expectations in line with positive feedback would overall be smaller in participants with elevated levels of depression than in participants without depressive symptoms. Moreover, we examined whether the presence of elevated levels of depressive symptoms would interact with the positivity of new information; specifically, we predicted that people with elevated depressive symptoms would perceive extremely positive feedback as being less valid, thus showing reduced expectation updating in this condition compared with people without depressive symptoms.
We tested these hypotheses in two different contexts: the update of performance expectations in response to performance feedback (Study 1) and the revision of expectations about social interactions in response to social feedback (Study 2). These two contexts were chosen as two empirically supported examples of negative expectations in depression (D’Astolfo et al., 2020; Gao et al., 2017; Kube, Rief, et al., 2019), although we are cognizant of the importance of expectations in other domains as well, such as mood regulation (Backenstrass et al., 2006; Catanzaro, 1996) and self-efficacy (Gopinath et al., 2007; Ludman et al., 2003).
Both experiments were approved by the local ethics committee (Reference 2020_245) and were conducted in accordance with ethical standards as laid down in the 1964 Declaration of Helsinki and its later amendments. All participants gave written informed consent and were treated in accordance with the ethical guidelines of the German Psychological Society. Both studies were preregistered at AsPredicted: Study 1, 38855; Study 2, 40876.
Study 1
In this study, we used a well-established paradigm to investigate intraindividual changes in performance expectations in response to false feedback. We examined how performance feedback with varying degrees of positivity influences the revision of negative expectations.
Method
Participants
The sample size was determined via a priori power analysis using G*Power on the basis of previous work using the same experimental paradigm (Kube & Glombiewski, 2021; Kube, Glombiewski, et al., 2019; Kube, Rief, et al., 2018, 2019). We expected a small effect in terms of the effect of the feedback variation in a repeated measures analysis of variance (ANOVA), and the power analysis (expected f = 0.10; power = .80; three groups; correlation between the two points of measurement r = .60) indicated a required sample size of at least 198 participants. Given the relatively high exclusion rates in online experiments, we aimed to reach a considerable surplus in the sample size, which would allow us to exclude participants from the analyses for statistical or data plausibility reasons if necessary without substantially losing power.
To investigate possible differences between people with and without elevated levels of depressive symptoms, we aimed to have a balance of people with a Beck Depression Inventory–II (BDI-II) sum score of 14 or higher (indicating at least mild symptoms of depression according to Beck et al., 1996) and people with a BDI-II score lower than 14 (indicating the absence of clinically relevant depressive symptoms) in our sample. To achieve this aim, we used two separate recruiting procedures. To reach people with elevated symptoms of depression, we contacted several self-help groups via social media and e-mail lists and asked people to participate if they had experienced symptoms such as sadness, anhedonia, or sleep disturbances in the past few weeks. In addition, we recruited people without depressive symptoms via nonclinical social media channels and e-mail lists; in this case, we asked people to participate if they considered themselves healthy at the moment both physically and mentally. Additional inclusion criteria were at least 18 years old, sufficient German language skills, and no participation in any previous study of our group on belief updating.
Procedure
The procedure of the present study (see Fig. 1) was based on a previously validated paradigm (Kube, Rief, et al., 2018) that has been used in several previous studies on the revision of positive and negative expectations. The procedure of this experimental paradigm to investigate expectation change in depression (EXPECD) is described next.
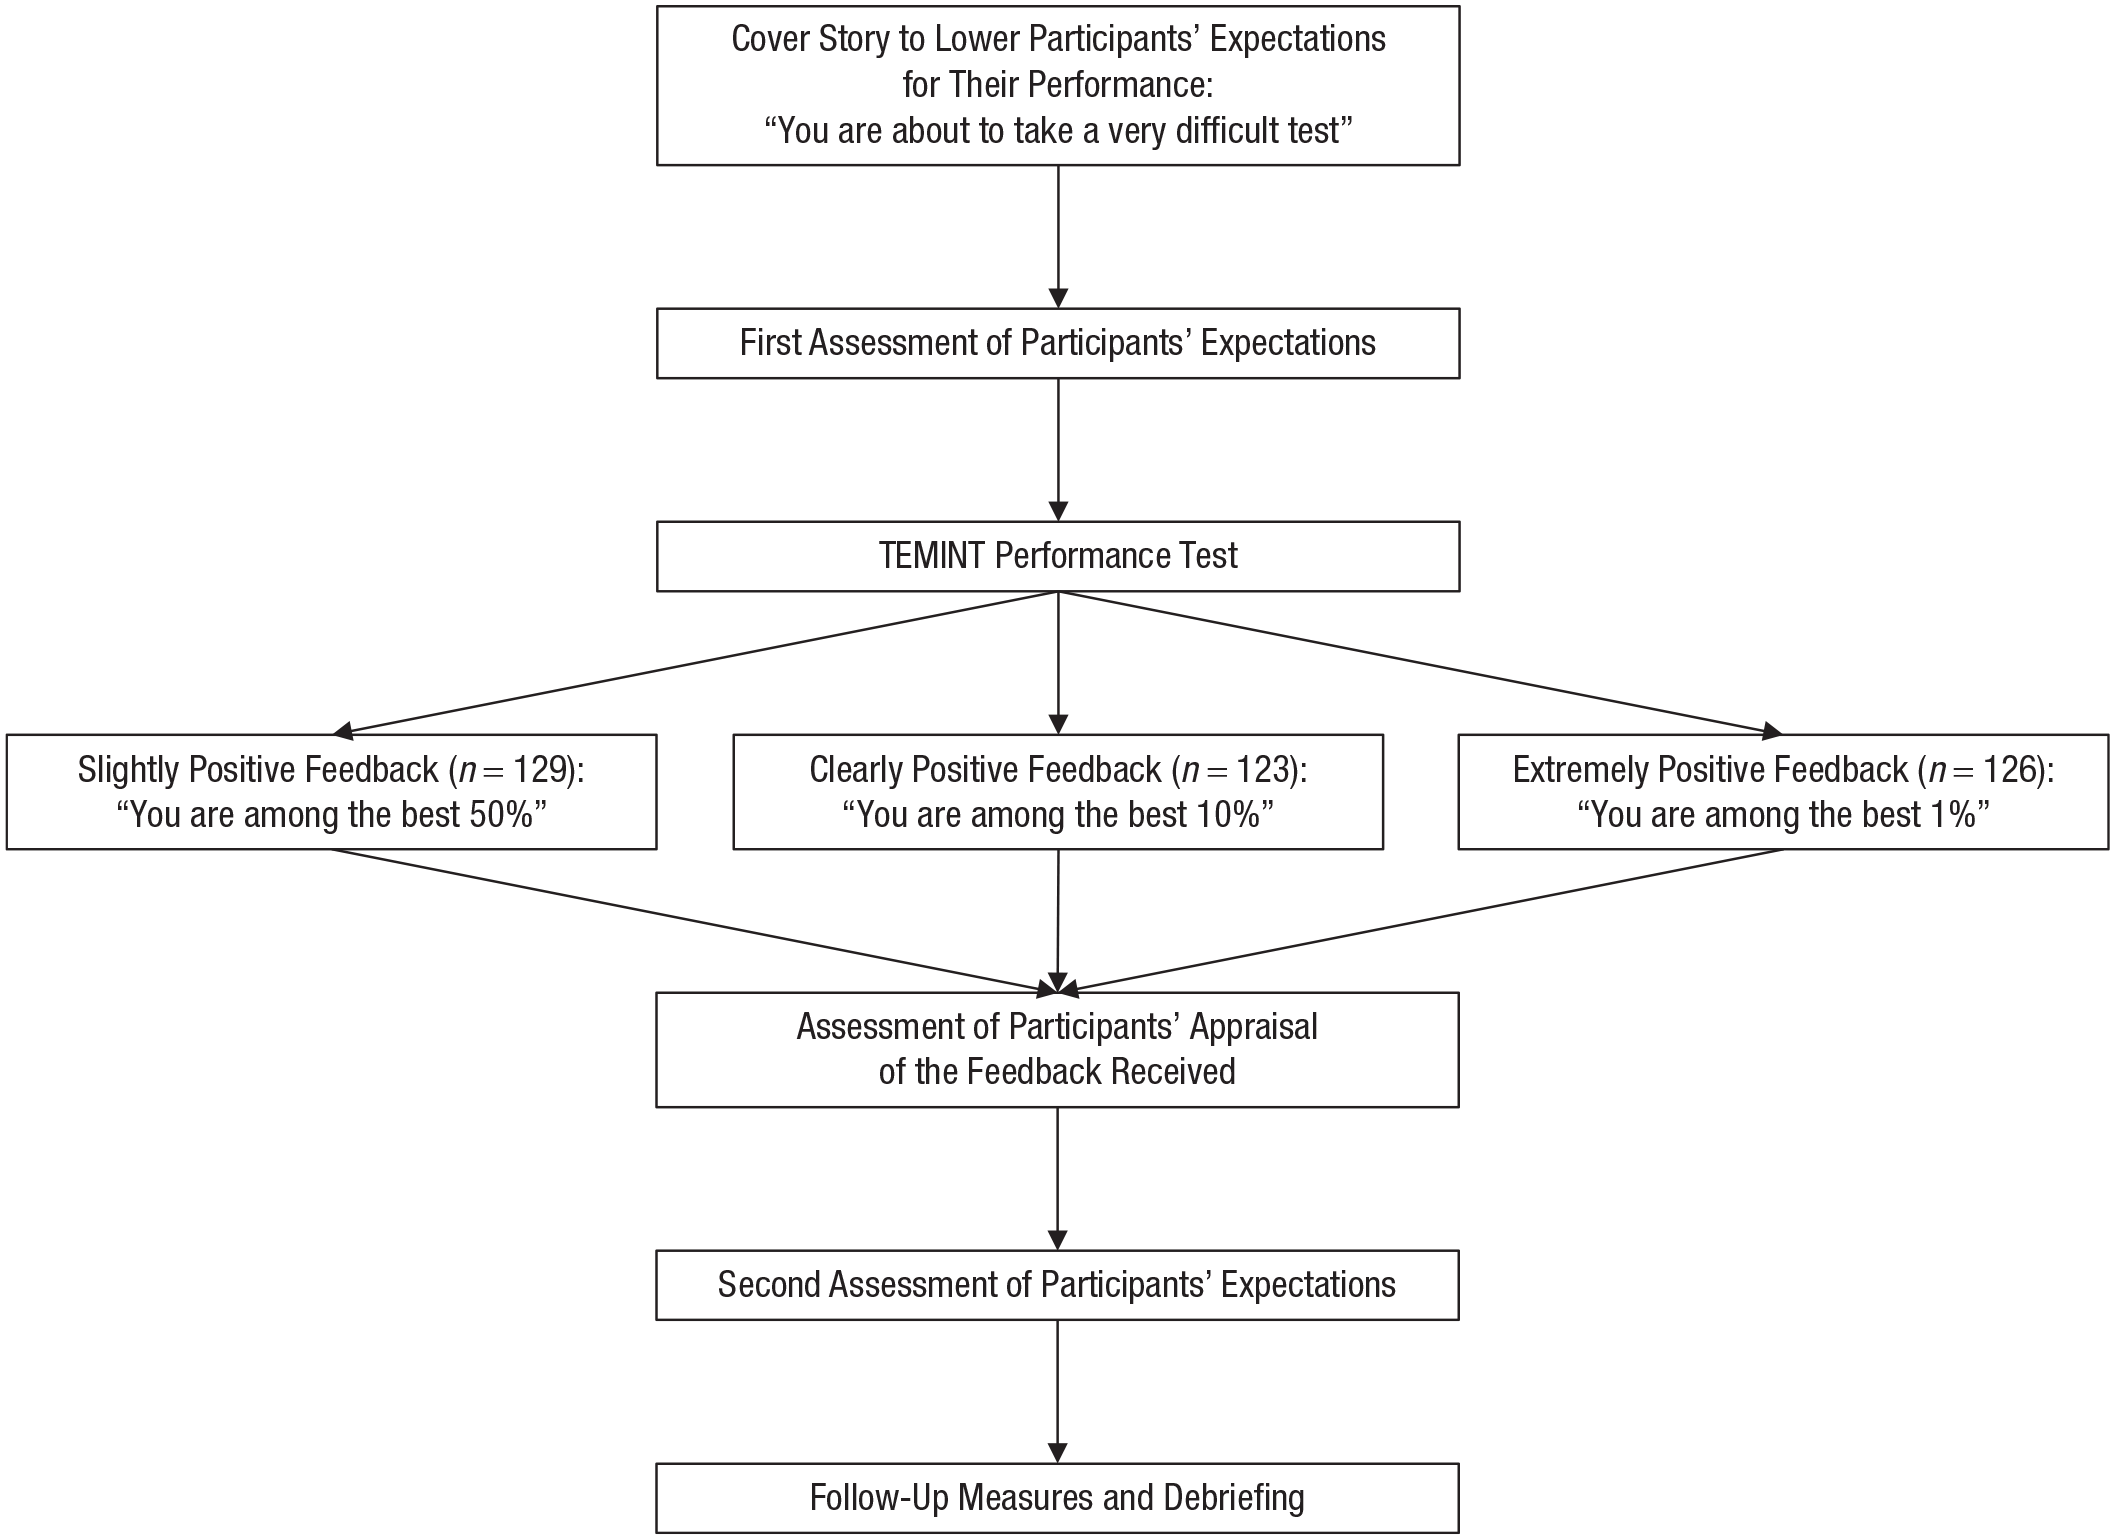
Design of Study 1.
Cover story
To cover the actual purpose of the study and minimize demand effects, we told the participants that the goal of the study was to examine the relationship between current mood and performance. To support this cover story, we asked participants to rate the extent to which they experienced depressive symptoms (BDI-II) as well as other emotional states (Positive and Negative Affect Schedule [PANAS]).
Induction of initial expectations
As part of the cover story, participants were informed that they would work on a performance test they are not familiar with. To lower participants’ baseline expectations for their performance in this test, we told them that the test was very difficult and could be solved correctly only by a few people unless they were informed about which specific test this would be. For the verbatim instruction, see the Supplemental Material available online. After receiving that information, participants were asked to indicate their initial performance expectations. Subsequently, they were informed about which specific test they were supposed to work on. Previous work demonstrated that this instruction is suitable to lower participants’ initial expectations for their performance (Kube, Kirchner, et al., 2019; Kube, Rief, et al., 2018).
Performance test
Participants worked on the Test of Emotional Intelligence (TEMINT; Schmidt-Atzert & Buehner, 2002), which was used in several previous studies on expectation update in the context of performance feedback. The TEMINT aims to capture participants’ ability to apply emotional knowledge to understand and analyze other people’s emotions. The TEMINT was developed by asking people from a heterogeneous sample (with respect to age, sex, and education) to rate several situations from their everyday lives regarding the specific emotional reactions they experienced in these situations. Using this initial item pool, the authors derived 12 situations to develop the final version of the test. In each situation, the description of the person who had experienced this situation includes the person’s age, sex, and profession (e.g., civil servant, 22 years old: “I had a dispute with a colleague”). The participants’ task is to empathize with the person from the situation and to evaluate the degree to which they experienced certain emotions in the situation (e.g., sadness, surprise, anger). The TEMINT sum score reflects the overall deviations from the actual ratings of the persons referred to in the situations; low sum scores indicate good performance on the test. The TEMINT was found to have good psychometric properties in previous studies (Amelang & Steinmayr, 2006; Blickle et al., 2009). The main reason why the TEMINT was selected for this paradigm is that it is difficult for participants to evaluate their own performance in this test, which is important for the fake performance feedback to appear credible. Indeed, in another independent sample (N = 43), we found that participants’ estimation of their performance was unrelated to their actual performance, r = −.060, p = .703. Moreover, although depression has been negatively associated with empathic accuracy, the TEMINT in particular has been shown to be unrelated to depressive symptoms in several previous studies (Kube, Rief, et al., 2018, 2019). Cronbach’s α of the TEMINT in the present study was .83. TEMINT sum scores were unrelated to the update of task-specific expectations (r = −.016, p = .761) and generalized expectations (r = −.096, p = .069).
Performance feedback and experimental conditions
After completing the TEMINT, participants received feedback for their performance. Specifically, participants were informed about how many tasks of the tests they solved correctly and how well they performed compared with other people. This feedback was independent of participants’ actual performance. The specific number of correct tasks and the individual percentile rank varied between the three experimental conditions to which participants were assigned randomly. Participants from the 50% condition were informed that they solved 59 out of 85 tasks correctly and were among the best 50% of all participants (i.e., 50% being worse). This feedback was supposed to be perceived as being slightly positive, thereby having little influence on the update of performance expectations. Participants from the 10% condition were told that they solved 77 out of 85 tasks correctly, thus belonging to the best 10% (i.e., 90% performing worse). We expected that this feedback would be perceived as being clearly positive and thus have a large impact on the adjustment of previous negative expectations. Participants from the 1% condition were informed that they solved 83 out of 85 tasks correctly and were among the best 1% in this test (i.e., 99% being worse). This feedback was supposed to be perceived as being extremely positive and have little influence on expectation update because it may be considered less credible.
The three specific percentile ranks were chosen on the basis of a small pretest with a sample of healthy university students (N = 38) and people with a diagnosed depressive disorder from an acute psychiatric German hospital (N = 33). For detail about the pretest, see the Supplemental Material. The results indicated that the perceived credibility and supposed use of the feedback to update one’s previous expectations was highest for the 10% condition and lowest for the 50% and 1% conditions. Therefore, we chose these three specific percentile ranks for Study 1 to test the hypothesized inverse U-shaped relationship between positivity of feedback and expectation update.
In another independent sample (N = 43), we tested how the three feedback conditions (50% vs. 10% vs. 1%) differed in terms of the perceived positivity and credibility. Participants from this additional data collection were informed that they would work on the TEMINT without prior expectancy induction. After completing the TEMINT, participants received the feedback “You are among the best 50%/10%/1%,” as performed in the main study. Subsequently, participants were asked to rate both the positivity and the credibility of the feedback received using a 7-point Likert scale. The results of that proof-of-method data collection showed that the three groups indeed differed significantly in the perceived positivity of the feedback, F(2, 40) = 18.992, p < .001, η p 2 = .487 (reflecting a very large effect); least positive values were found in the 50% condition (M = 4.14, SD = 1.03), and the most positive values were found in the 1% condition (M = 6.47, SD = 0.92). Likewise, the results for the perceived credibility were perfectly in line with our predictions: The three groups differed significantly in the perceived credibility of the feedback, F(2, 40) = 6.840, p = .003, η p 2 = .255 (reflecting a large effect); the highest credibility rating was found in the 10% condition (M = 4.36, SD = 1.70), and lower ratings were found in the 50% condition (M = 3.57, SD = 1.78) and the 1% condition (M = 2.13, SD = 1.46). Perceived positivity and credibility were unrelated, r = .007, p = .964. Thus, the findings of this additional data collection support the rationale of our main experiment: The more positive the feedback was (50%, 10%, 1%), the more positive it was perceived; however, if the feedback was overly positive, it was perceived less credible, likely contributing to a reduced update of the prior expectation.
Debriefing
After completing the entire experiment, participants were debriefed on the real purpose of the study.
Measures
Changes in expectations
We assessed participants’ performance expectations with the Performance-Expectations Scale developed by Kube, Rief, et al. (2018). This scale assesses both task-specific expectations, referring to the expected performance in a particular test (e.g., “I will be successful in working on the tasks from the test”), and generalized performance expectations, which captures the expected performance in unknown tests in general (e.g., “I will be successful in working on unknown tasks in general”). Each subscale comprises two items, and participants are asked to rate them twice: before working on the test (see the example items above) and after feedback (task-specific expectation, e.g., “I will be successful to work on tasks similar to those from the test in the future”; generalized expectation, e.g., “I will be successful in working on unknown tasks in general in the future”). All items are rated using a 7-point Likert scale ranging from I totally disagree (1) to I totally agree (7); higher sum scores reflect more positive performance expectations. The Performance-Expectations Scale has been used in several previous studies and has shown good psychometric properties (Kube & Glombiewski, 2021). Cronbach’s α of the task-specific expectations subscale was .89, and Cronbach’s α of the generalized performance expectations subscale was .91. The intercorrelation of the two scales was r = .781 (p < .001) at baseline; after feedback, this correlation declined to r = .474 (p < .001). An exploratory factor analysis (principal component analysis) clearly suggested one underlying factor (as indicated by several criteria, e.g., the Kaiser-Meyer-Olkin coefficient and the scree plot) that accounted for 81% of the variance. Despite the one-factor solution as suggested by the principal component analysis, we decided to analyze the items for participants’ task-specific and generalized expectations separately because previous studies have demonstrated that depression is related to difficulty in revising the latter, whereas there are fewer differences between healthy and depressed people in adjusting the former (Kube, Rief, et al., 2019). As in all previous studies using that task, pre-to-post 2 changes in generalized performance expectations were predefined as the primary outcome variable, and changes in task-specific expectations were considered secondary.
Cognitive immunization
Participants’ engagement in cognitive-immunization strategies to devalue the performance feedback received was assessed using the six-item Cognitive Immunisation After Performance Feedback (CIPF) scale developed by Kube, Glombiewski, et al. (2019). Two items of this scale measure the degree to which participants consider the test to be capturing relevant areas of their lives (subscale relevance), two items assess the extent to which participants appraise the feedback received as being credible (subscale credibility), and two items assess the degree to which they perceive the feedback received as an exception rather than as representative for their general performance (subscale exception). Each item is rated on a 7-point Likert scale from I totally disagree (1) to I totally agree (7). The CIPF scale has shown good psychometric properties (Kube, Glombiewski, et al., 2019; Kube, Kirchner, et al., 2019). Cronbach’s α in the present study was .74. A principal component analysis suggested two underlying factors (based on a combination of several criteria, e.g., the Kaiser-Meyer-Olkin coefficient and the scree-plot) that accounted for 64% of the variance. The first factor comprised the two items from the subscale credibility and one item of the subscale relevance and subscale exception, respectively (with factor loadings between .699 and .886), whereas the second factor comprised one item from the subscale relevance and one item from the subscale exception (with factor loadings of .664 and .838).
Mood
We assessed participants’ current mood with the PANAS by Watson et al. (1988). The PANAS was developed to assess positive and negative emotions independently. It comprises 20 adjectives, 10 of which describe positive affective states (e.g., excited, proud, and inspired) and another 10 that describe negative affective states (e.g., distressed, jittery, and upset). Participants rate the extent to which they experience each emotion using a 5-point Likert scale from 1 (not at all) to 5 (very much). The PANAS has shown very good psychometric properties. In our study, Cronbach’s α of the positive affect subscale was .88 and .89 for the negative affect subscale.
Depressive symptoms
Depressive symptoms were assessed using the BDI-II, which comprises 21 items (Beck et al., 1996). Each item is rated on a 4-point scale ranging from 0 to 3. Accordingly, the sum score ranges between 0 and 63; lower values indicate fewer depressive symptoms. In our sample, Cronbach’s α was.94.
Sociodemographics
Sociodemographic variables, including age, sex, education, and employment status, were assessed using a brief self-report questionnaire.
Data collection
Data were collected online between April 2020 and May 2020 using the online platform www.soscisurvey.de. The study was described as a research study on “the relationship between current mood and performance.”
Statistical analyses
We conducted data screening according to Tabachnick and Fidell (2014) and tested the assumptions of ANOVAs. Because participants could continue with the survey only if they entered all values, there were no missing values in the present study. Possible baseline differences between the three experimental conditions were examined using ANOVA and χ2 tests (the latter for nominal variables). For the main analysis, we first conducted an analysis of covariance (ANCOVA) with the CIPF total scores as the dependent variable to examine differences between the three feedback conditions in cognitive immunization and the continuous BDI-II scores included as a covariate. Subsequently, we performed a 2 (time: before feedback vs. after feedback) × 3 (condition: 50% vs. 10% vs. 1%) repeated measures ANCOVA with generalized expectations as the dependent variable and the continuous BDI-II scores as the covariate. To test whether the engagement in cognitive-immunization strategies mediates the effects of feedback on the update of generalized expectations, we performed a mediation analyses using the PROCESS Macro (Hayes, 2017) for IBM SPSS (Version 25) for regression analyses. In this mediation analysis (using Model 4 from the PROCESS Macro), the pre-to-post difference score of expectation update was the dependent variable (Y), the experimental condition was the independent variable (X), and the CIPF total score was the mediator variable (M). To test the statistical significance of indirect effects, we used bias-corrected accelerated (BCa) bootstrapping 95% confidence intervals (CIs) with 10,000 bootstrapping samples. This bias-corrected bootstrapping procedure has been recommended by several authors (Hayes, 2009). Furthermore, using Model 7 from the PROCESS Macro, we tested whether the above-hypothesized mediation effect of condition on updating via cognitive immunization is moderated by BDI-II sum scores (W) in terms of a moderated mediation analysis. Type 1 error levels were set at 5%. All analyses were performed using IBM SPSS.
Results
Sample characteristics
A total of 396 people completed the online survey. Two participants were excluded because they were more than 3 SD above or below the mean on the dependent variable. Six participants were excluded because they did not endorse a control item. Another 10 participants were excluded from subsequent analyses because they expressed serious doubts about the cover story and guessed the real purpose of the study. Thus, all subsequent analyses were based on 379 individuals (n = 129 in the 50% condition; n = 123 in the 10% condition; n = 126 in the 1% condition), 200 of whom (52.77%) reported elevated levels of depression (BDI-II score ≥ 14). The mean age of the entire sample was 25.73 years (SD = 8.08). The sample was 81.0% female and 17.9% male; three participants identified as sex “diverse,” and one person did not want to disclose any information about sex. Regarding education level, 67.0% had a high school diploma, 31.5% had a university degree, and 6.3% had primary education. Most participants (74.7%) were in training (i.e., university students), 15.3% were working full-time, 5.8% were working part-time, 2.1% were unemployed, 1.1% were disabled, and 0.8% were homemakers. The sociodemographic and clinical characteristics of the sample are presented for the three experimental groups separately in Table 1. For an analysis of baseline differences between the conditions, see the Supplemental Material.
Sample Characteristics in Study 1
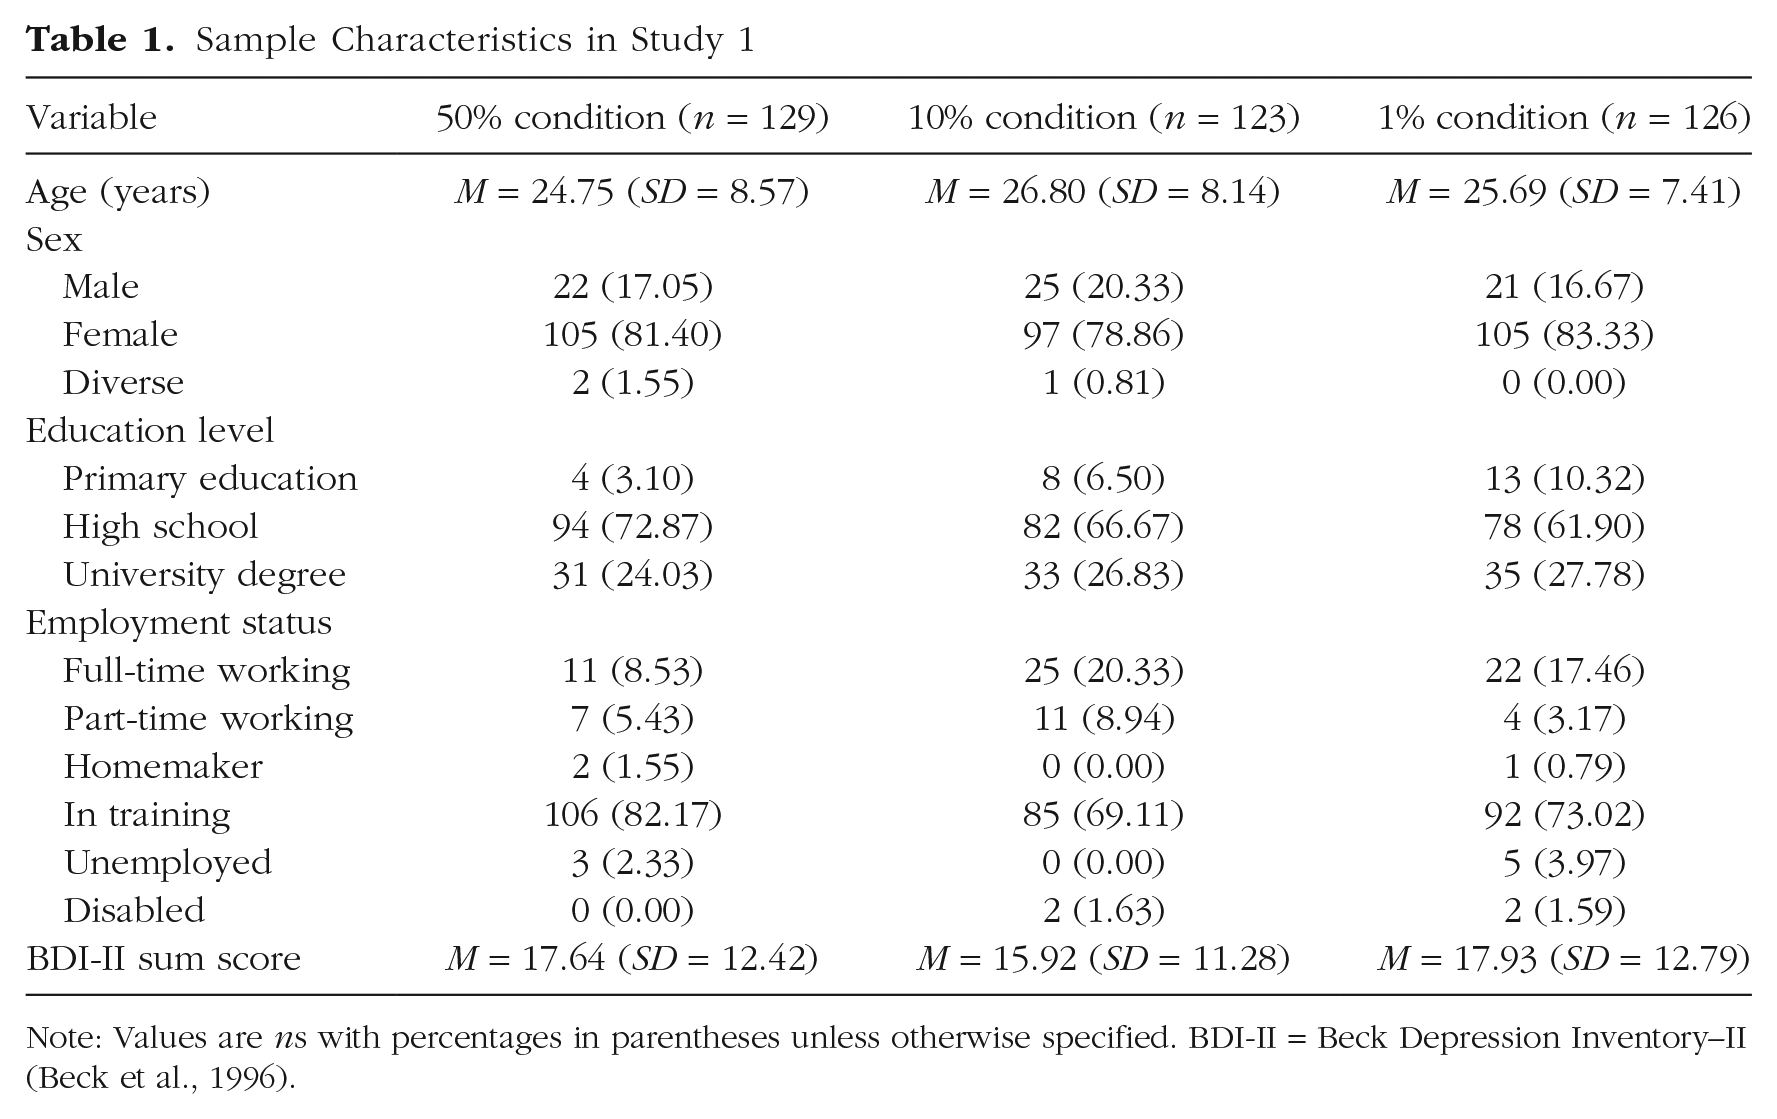
Note: Values are ns with percentages in parentheses unless otherwise specified. BDI-II = Beck Depression Inventory–II (Beck et al., 1996).
Main analyses
Differences in cognitive immunization
The ANCOVA indicated significant differences between the three feedback conditions, F(2, 375) = 12.630, p < .001, η p 2 = .063. Pairwise comparisons revealed that the difference between the 50% condition and the 10% condition was significant, t(250) = 5.445, p < .001, d = 0.684, which reflects a medium to large effect. Although the differences between the 50% condition and the 1% condition, t(254) = 2.931, p = .004, d = 0.366, and the 10% and the 1% condition, t(248) = −2.083, p = .038, d = 0.263, were statistically significant, too, their effect sizes were smaller. For the descriptive values of the three groups, see Table S2 in the Supplemental Material. BDI-II scores had significant unique effects on the CIPF scores, F(1, 375) = 5.479, p = .020, η p 2 = .014; overall, participants with elevated levels of depression used more cognitive-immunization strategies (M = 25.74, SD = 6.90) than participants without depressive symptoms (M = 23.87, SD = 7.00) to devalue the feedback received, which reflects a small effect according to Cohen (1988), d = 0.268. Note that when considering the three subscales of the CIPF scale separately, the results show that the difference between people with and without depressive symptoms in their engagement in cognitive-immunization strategies was driven mainly by the subscale exception, F(1, 373) = 17.610, p < .001, η p 2 = .045, whereas the differences between the two samples did not reach significance for the subscale relevance, F(1, 375) = 2.739, p = .099, η p 2 = .007; or the subscale credibility, F(1, 375) = 0.595, p = .441, η p 2 = .002. For group differences in cognitive immunization, see Figure S1 in the Supplemental Material.
Update of generalized performance expectations
The ANCOVA indicated a significant main effect of time, F(1, 375) = 45.007, p < .001, η p 2 = .107; there were less positive expectations before feedback (M = 8.64, SD = 2.74) than after feedback (M = 9.73, SD = 2.58). The main effect of condition was not significant, F(2, 375) = 1.977, p = .140, η p 2 = .010. The Time × Condition interaction was not significant, either, F(2, 375) = 0.651, p = .522, η p 2 = .003 (for the descriptive values, see Table S1 in the Supplemental Material). BDI-II scores had significant unique effects on generalized expectations, F(1, 373) = 52.179, p < .001, η p 2 = .122; there were overall more positive expectations among participants without depressive symptoms (M = 9.64, SD = 2.39) than among participants with elevated levels of depression (M = 8.44, SD = 2.89). The Time × Depression interaction was not significant, F(1, 375) = 3.046, p = .082, η p 2 = .011, although the update was descriptively lower in participants with elevated levels of depression, particularly in the extremely positive condition (see Fig. S2a in the Supplemental Material). The Depression × Condition interaction was not significant, F(2, 373) = 0.555, p = .575, η p 2 = .003.
Update of task-specific performance expectations
The ANCOVA indicated a significant main effect of time, F(1, 375) = 29.993, p < .001, η p 2 = .074; there were overall less positive expectations before feedback (M = 8.79, SD = 2.86) than after feedback (M = 10.78, SD = 2.39). The main effect of condition was significant, F(2, 375) = 7.667, p = .001, η p 2 = .039; overall, the most positive expectations were in the 10% condition. The Time × Condition interaction was significant, F(2, 375) = 4.094, p = .017, η p 2 = .021. Pairwise comparisons revealed that the difference between the 50% condition and the 1% condition in expectation updating was significant, t(254) = −2.878, p = .004, d = 0.359, whereas the difference between the 50% condition and the 10% condition, t(250) = −1.210, p = .227, d = 0.152, and the 10% condition and the 1% condition, t(248) = −1.630, p = .104, d = 0.206, were not significant. For the descriptive values, see Table S1 in the Supplemental Material. As with generalized expectations, BDI-II scores had significant unique effects on task-specific expectations, F(1, 375) = 25.940, p < .001, η p 2 = .065. Overall there more positive expectations among participants with elevated depressive symptoms (M = 10.05, SD = 2.44) than in people without elevated symptoms of depression (M = 9.34, SD = 2.84), but the Time × Depression interaction did not reach significance, F(1, 375) = 3.211, p = .074, η p 2 = .008. The Depression × Condition interaction was not significant, F(2, 373) = 1.019, p = .362, η p 2 = .005. For the update of task-specific performance expectations, see Figure S2b in the Supplemental Material. The update of generalized expectations was significantly correlated with the update of task-specific expectations, r = .465, p < .001.
Mediation analysis
In the mediation analysis, we found that the CIPF total scores had significant effects on expectation update (β = −0.137, p = .008), which signifies a negative relationship between the engagement in cognitive-immunization strategies and the update of generalized performance expectations. Although there was no direct effect of the feedback condition on expectation update, BCa 95% confidence interval (CI) = [−0.229, 0.345], the indirect effect via cognitive immunization was significant, BCa 95% CI = [0.004, 0.052]. This implies that the effects of condition on update were fully mediated through cognitive immunization. The overall amount of variance explained by this mediation model, however, was fairly low, R2 = .040. When performing this mediation analysis again with only the clearly positive condition and the extremely positive condition (both reflecting the “truly” positive feedback), the direct effect was still nonsignificant, BCa 95% CI = [−0.602, 0.580], and the indirect effect was still significant, BCa 95% CI = [−0.117, −0.002]. A moderated mediation analysis indicated that the aforementioned mediation was not moderated by depression levels, BCa 95% CI = [−0.007, 0.001]. 3
Discussion
In Study 1, we aimed to examine how the discrepancy between prior expectations for success and performance feedback influences expectation updating. To this end, we used three variations of standardized feedback that participants received for their performance in an unknown and allegedly difficult performance test: slightly positive feedback (best 50%), clearly positive feedback (best 10%), and extremely positive feedback (best 1%). In line with our hypothesis, we found that the engagement in cognitive immunization against the feedback received was lowest if the feedback was clearly positive. On a descriptive level, the results also indicated that the adjustment of generalized expectations in response to feedback was greatest in the clearly positive condition, particularly among people with elevated levels of depression. However, this effect failed to reach significance. That is, neither the Time × Condition interaction nor the Time × Condition × Depression interaction was significant. In other words, given the significant main effect of time, our results suggest that participants updated their expectations significantly in line with feedback regardless of the experimental condition. This implies that all three feedback conditions were perceived as being unexpectedly positive, thus entailing an adjustment of the prior expectation.
Regarding the influence of depressive symptoms, we found that—consistent with the cognitive model of depression—people with elevated levels of depression had overall lower generalized performance expectations. Although previous research has also linked depression to difficulties in revising negative expectations (Everaert et al., 2018; Kube, Rief, et al., 2019), the present study found only small effects of depression on the adjustment of generalized expectations that failed to reach significance. Note that a reverse trend emerged for task-specific expectations: People with increased depression scores reported overall higher task-specific expectations and updated their expectations somewhat more in accordance with the feedback received, although this effect failed to reach significance. The apparent contradiction of the results for generalized and task-specific expectations in relation to depression might be resolved by considering the engagement in cognitive immunization: Overall, as hypothesized, participants with elevated levels of depression showed more cognitive-immunization tendencies than participants without depressive symptoms; more fine-grained analyses revealed that this effect was driven by differences in the subscale exception, although no significant differences for the perceived credibility and relevance of the feedback were observed. That is, participants with elevated levels of depression considered their positive feedback to be an exception rather than the rule (while not questioning its credibility).
Thus, our results suggest that people with depressive symptoms did appraise the feedback for their performance test as being credible, hence updating their expectations for the specific test, but considered the positive feedback to be an exception for them, preventing them from updating their generalized performance expectations. In other words, participants with elevated levels of depression seem to have difficulty generalizing positive feedback such that their low generalized performance expectations were largely maintained. Relatedly, the results of the mediation analyses supported the hypothesized mediational role of cognitive immunization for expectation update. That is, the variation of the strength of the positive feedback led to differences in cognitive immunization, consequently leading to differences in expectation update. Regarding methodology, note that the high correlation between generalized and task-specific expectations at baseline raises doubts about whether these two factors can be analyzed separately; however, the diverging results for change in generalized expectations compared with task-specific expectations suggest that they are differentially affected by the feedback received (see Fig. S2). This is also reflected by the considerably lower correlation of the two subscales after the provision of feedback.
Study 2
The goal of this study was to replicate and extend the findings of Study 1 by investigating expectation updating as a function of the positivity of new information in an additional context. Specifically, we aimed to examine our hypotheses in the context of negative social expectations and social interactions that positively disconfirm previous expectations. We did so not only to examine the robustness of the results from Study 1 but also because expectations about social rejection have been discussed as being particularly important in the context of major depression (D’Astolfo et al., 2020; Gao et al., 2017). As in Study 1, we tested the hypothesis that moderately positive social interactions would precipitate the largest update of previous expectations, whereas weakly positive feedback and extremely positive feedback were supposed to be related to smaller update. This hypothesis relies on the observation that extremely positive social feedback from other people likely raises doubts about its credibility (McCullough, 2003; Rief & Joormann, 2019). To give an example, a positive social interaction with another person might be negatively reappraised by thinking, “This person was just pretending to like me. In fact, they are not interested in me.” Accordingly, as in Study 1, we tested the additional hypotheses that the engagement in cognitive immunization mediates the effects on reduced expectation update. In addition, as in Study 1, we expected that the degree to which negative expectations are updated is overall smaller in people with elevated levels of depressive symptoms than in people without depressive symptoms, and we examined again a possible interaction between feedback condition and depressive symptoms. To test these hypotheses, we developed a novel task, which is described in detail below.
Method
Participants
The sample size was determined via the same a priori power analysis as reported for Study 1; that is, the minimum sample size according to G*Power was 198 participants. As in Study 1, we used two separate recruiting procedures to ensure we had approximately as many participants with elevated depressive symptoms as people without depressive symptoms. The exact recruiting strategy was the same as reported for Study 1. In addition, we used a BDI-II sum score of 14 or higher again as a cutoff for elevated levels of depression. As an incentive for their participation, participants had the chance to win a voucher for a popular department store chain. If participants were students, they received course credit for their participation.
Imagined-social-interactions task
We developed a novel task to examine intraindividual changes in expectations about social interactions, the imagined-social-interactions (ISI) task. To this end, we aimed to find a task that is pertinent to both people with depressive symptoms and people without depressive symptoms to examine differences between the two groups. In short, this task introduces a scenario that is supposed to induce initially negative social expectations before presenting information about social interactions that vary in the degree to which they positively disconfirm previous negative expectations.
The scenario—presented in detail in the Supplemental Material—comprises the invitation to a party of a person one knows from school. It is designed such that participants are supposed to feel rather uncomfortable with the invitation to the party and have rather negative expectation toward it. After presenting the introductory text, participants completed a first assessment of their expectations for going to the aforementioned party. Next, participants were asked to imagine they would accept the invitation and go to the party of their friend. They were asked to imagine that they would have conversations with the three persons mentioned in the introduction, whom they know from school (and felt uncomfortable with in the past). They were presented with information on how each of the conversations would go. The content of these interactions differed across the three experimental conditions in terms of their positivity, as described below. In each condition, participants received information about interactions with the three persons after each other (for our reasoning in this respect, see the Supplemental Material). Within each condition, we aimed to keep the positivity of the interaction with the three persons constant but varied the specific content of each conversation. After each imagined social interaction, participants completed a brief scale assessing their appraisal of the interaction with the respective person. Thus, in total, each participant was presented with three different imagined social interactions and completed three appraisal measures. After completing the last appraisal assessment, participants’ social expectations were assessed again, accompanied with an instruction presented in the Supplemental Material.
Experimental conditions
Participants were randomly assigned to one of three conditions that varied in their degree of the positivity of the social interactions described. In the slightly positive condition, participants were presented with three social interactions in which the person described acted politely and friendly yet did not express any interest in deepened personal conversations (for an example, see the Supplemental Material).
In the clearly positive condition, we used descriptions of social interactions in which the other person behaved very warmly and cordially. In addition, in that condition, the acting person was described as asking several personal questions, expressing much interest in the conversation, and listening actively. In addition, participants were informed that the other person would be happy to meet them again (for an example, see the Supplemental Material).
In the extremely positive condition, participants were presented with descriptions of social interactions in which the acting person was described as very positive yet in stark contrast to the way they used to interact (at school). Moreover, the interaction was described as being surprisingly close, given previous experiences with that person and, accordingly, prior expectations, thus potentially raising doubts about the authenticity of the person’s intentions (for an example, see the Supplemental Material).
The design of Study 2 is illustrated in Figure 2.
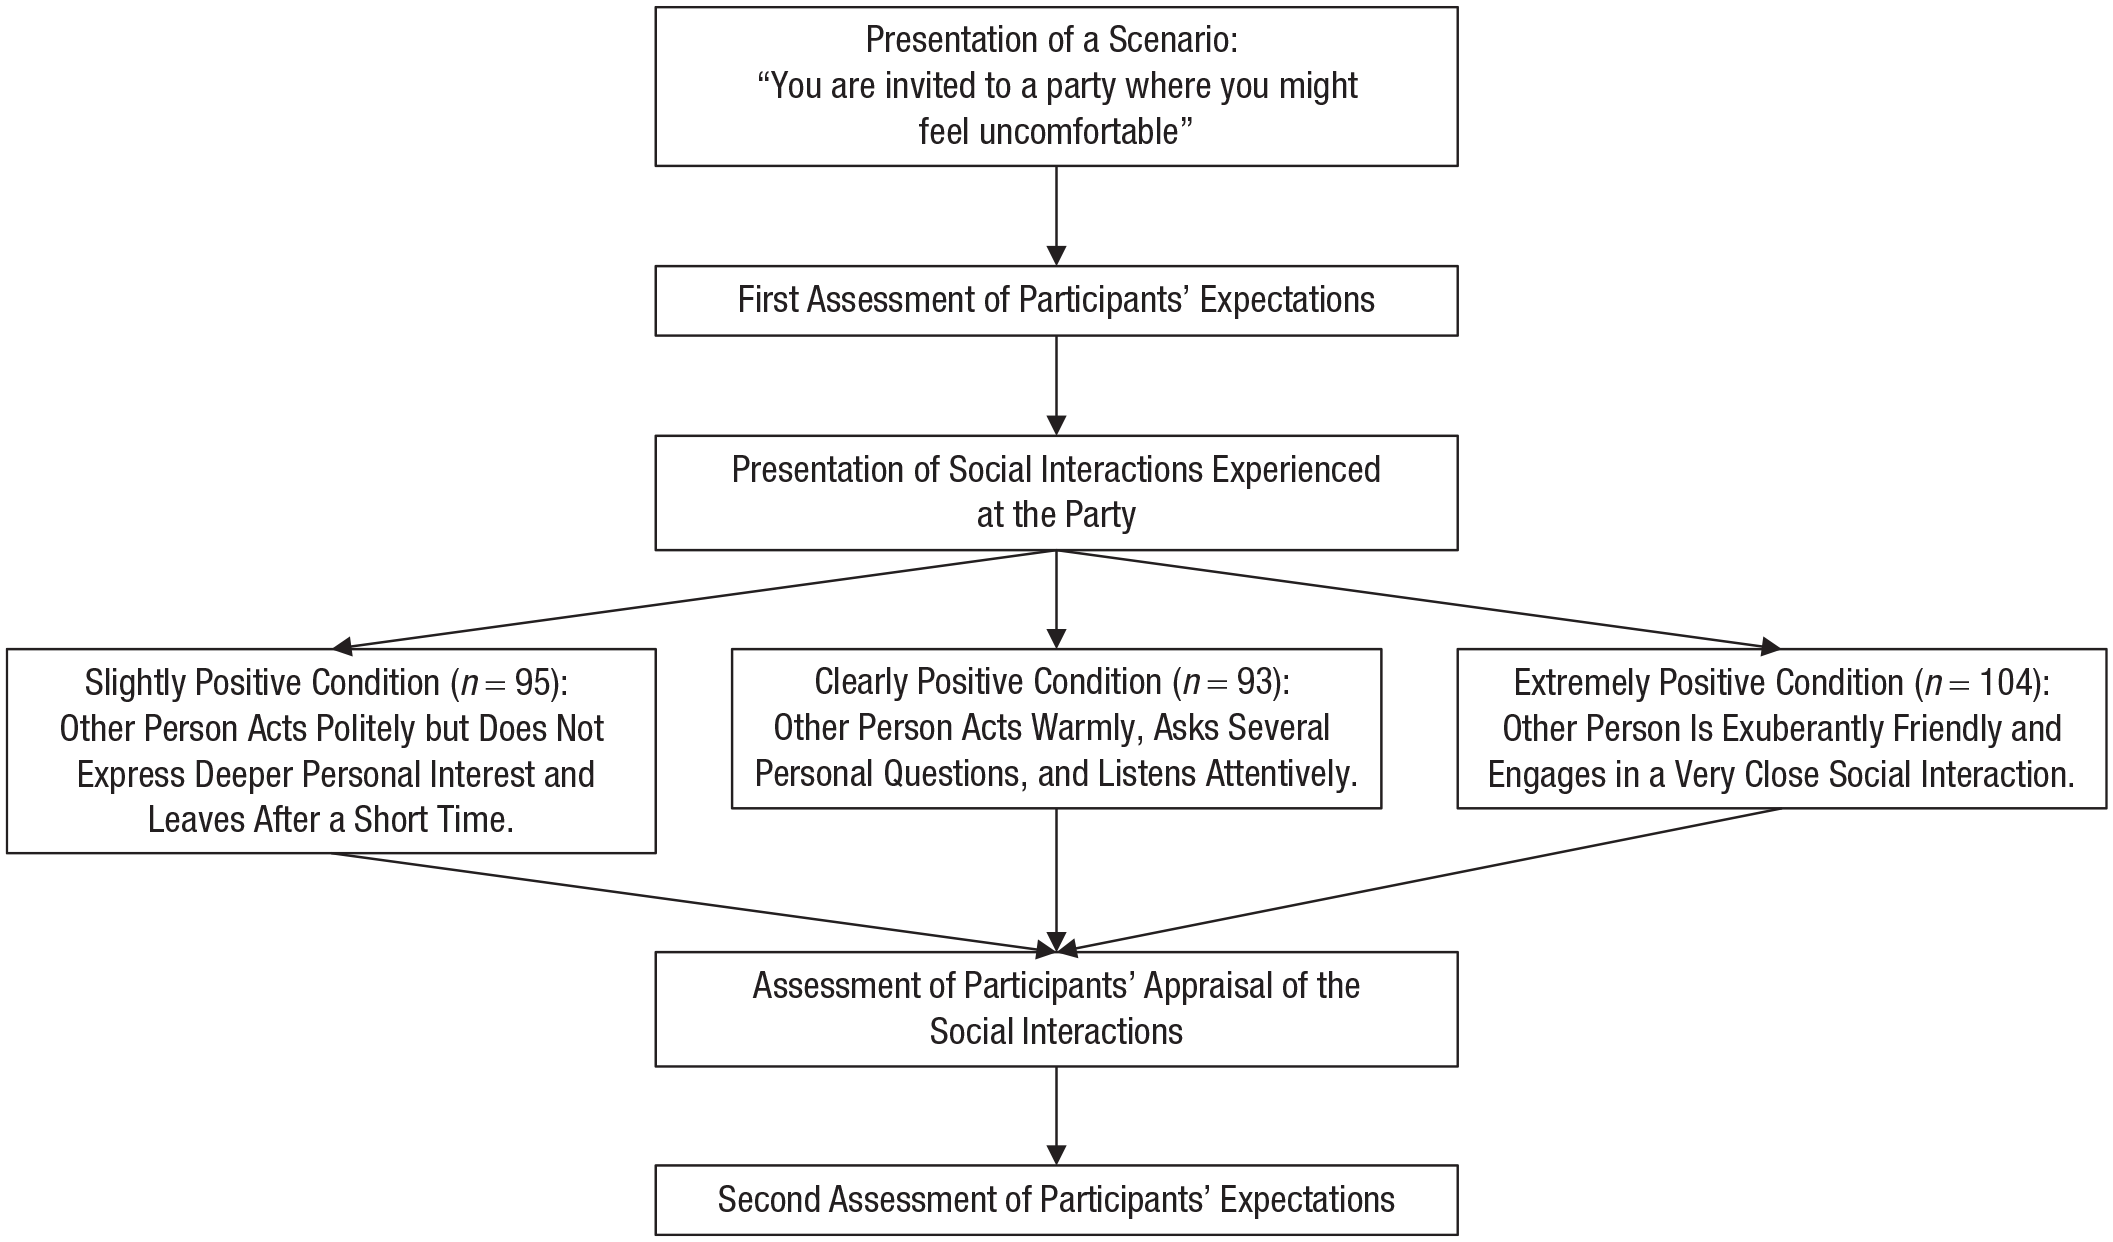
Design of Study 2.
Pretest
We evaluated the materials of the ISI task in a brief pretest using a community sample (N = 38). In this pretest, participants completed the task and provided feedback on how they perceived it in terms of comprehensiveness. On the basis of the participants’ comments, we did some minor revisions to the task aimed at enhancing the presentation of the vignette and the imagined social interactions. In addition, we used this pretest to evaluate the measures adapted for this task, as described below. Although this pretest was not designed to allow a test of the key hypotheses presented in the introduction, it was encouraging to see that the participants from the clearly positive condition indeed showed the greatest update of their expectations from before to after feedback (M = 3.14, SD = 6.57), whereas the update was lower for the slightly positive condition (M = 0.18, SD = 4.47) and the extremely positive condition (M = −0.60, SD = 4.95).
Measures
Social expectations
To assess participants’ expectations for the party as mentioned in the ISI task, we developed a brief eight-item social expectations scale as an adaptation of the Depressive Expectations Scale (DES; Kube et al., 2017). Four items of this scale were tied to the expected behavior of the three persons mentioned in the vignette, for example, “The persons I know from school will show little interest in me” (reverse-scored) and “The persons I know from school will be nice to me.” Another four items assessed the extent to which participants had overall positive expectations toward the party mentioned in the scenario, for example, “At the party, I will have the opportunity to have interesting conversations” and “At the party, I will feel unwell” (reverse-scored). As with the DES, items were put in such a way that the event/experience specified in each item would be amenable to a confirmation as opposed to a disconfirmation through new experiences (as operationalized with the imagined social interactions). All items are rated on a 7-point Likert scale ranging from 1 (I totally disagree) to 7 (I totally agree). Four items are reverse-scored, so higher values in the sum score reflect positive expectations. The social expectations scale was evaluated in the brief pretest described above, and it showed good psychometric properties. Specifically, in the pretest, Cronbach’s α of the scale was .89. In the main experiment, Cronbach’s α of the social expectations scale was .85.
Cognitive immunization
To assess participants’ appraisal of the interactions with the persons presented in the ISI task, we developed the Cognitive Immunization Against Social Interactions (CISI) Scale. The CISI scale was developed on the basis of the previously validated Cognitive Immunization Against Performance Feedback Scale (Kube, Glombiewski, et al., 2019), which assesses participants’ appraisal of unexpectedly positive performance feedback. The CISI scale comprises eight items that assess mainly the authenticity and perceived credibility of the other person’s behavior (e.g., “The person was just pretending to be interested in me,” “The person talked to me only because of our joint friend,” and “I felt the person was authentically interested in me” [reverse-scored]). All items are rated on a 7-point Likert scale ranging from 1 (I totally disagree) to 7 (I totally agree). Three items are reverse-scored; the higher the sum score, the greater the engagement in cognitive-immunization strategies. The CISI scale was evaluated in the pretest described above, and it showed good psychometric properties. Specifically, Cronbach’s α for the entire scale in the pretest was .93 and was .84, .83, and .89 for the three social interactions separately. In the main experiment, Cronbach’s α of the entire scale was .94 and was .92, .91, and .90 for the appraisal of the three interactions, separately. Participants’ responses to the three social interactions were significantly correlated as described in the Supplemental Material. A principal component analysis clearly suggested one underlying factor that explained between 60.0% and 65.1% of the variance for the three interactions, respectively.
Data collection
Data were collected online using the survey platform https://www.soscisurvey.de. Data were collected in June 2020. The study was described as a research study on “the perception of social interactions.”
Statistical analyses
Data screening and the examination of baseline differences were performed as described for Study 1. For the main analyses, we first conducted an ANCOVA with the experimental condition as the independent variable (slightly positive vs. clearly positive vs. extremely positive), the CISI total scores as the dependent variable, and continuous BDI-II scores as a covariate to examine differences in the engagement in cognitive-immunization strategies. Next, we performed a 2 (time: before vs. after the imagined social interactions) by 3 (condition: slightly positive vs. clearly positive vs. extremely positive) ANCOVA with social expectations as the dependent variable and continuous BDI-II scores as a covariate. In addition, as in Study 1, we conducted two mediation analyses to examine whether (a) the engagement in cognitive-immunization strategies mediates the effects of condition on the update of social expectations and (b) whether this mediation is moderated by depression levels. All analyses were performed using IBM SPSS, and Type I error levels and confidence intervals were set as in Study 1.
Results
Sample characteristics
A total of 332 people participated in the study. Of these, 35 participants discontinued participation before entering two thirds of all data points, which is why data of these participants could not be used. Another five participants had to be excluded because they did not endorse a control item. Thus, all subsequent analyses are based on data from 292 individuals (n = 95 in the slightly positive condition, n = 93 in the clearly positive condition, n = 104 in the extremely positive condition). In this sample, 75.0% were female, and the mean age was 25.86 years (SD = 8.16). Regarding education level, 67.1% had a high school diploma, 29.2% had a university degree, and 3.7% had primary education. Most participants (84.2%) were university students, 9.5% were employed, 0.7% were officials, 1.0% were self-employed, 0.7% were unemployed, 0.3% were disabled, 0.6% were pensioners, and 0.3% were homemakers. On average, participants had a BDI-II sum score of 18.83 (SD = 13.38), which indicates mild depressive symptoms (Beck et al., 1996). In this sample, 59.2% of the participants reported elevated levels of depressive symptoms (BDI-II sum score ≥ 14). The sociodemographic and clinical characteristics of the sample are presented for the three experimental groups separately in Table 2. For analysis of baseline differences, see the Supplemental Material.
Sample Characteristics in Study 2
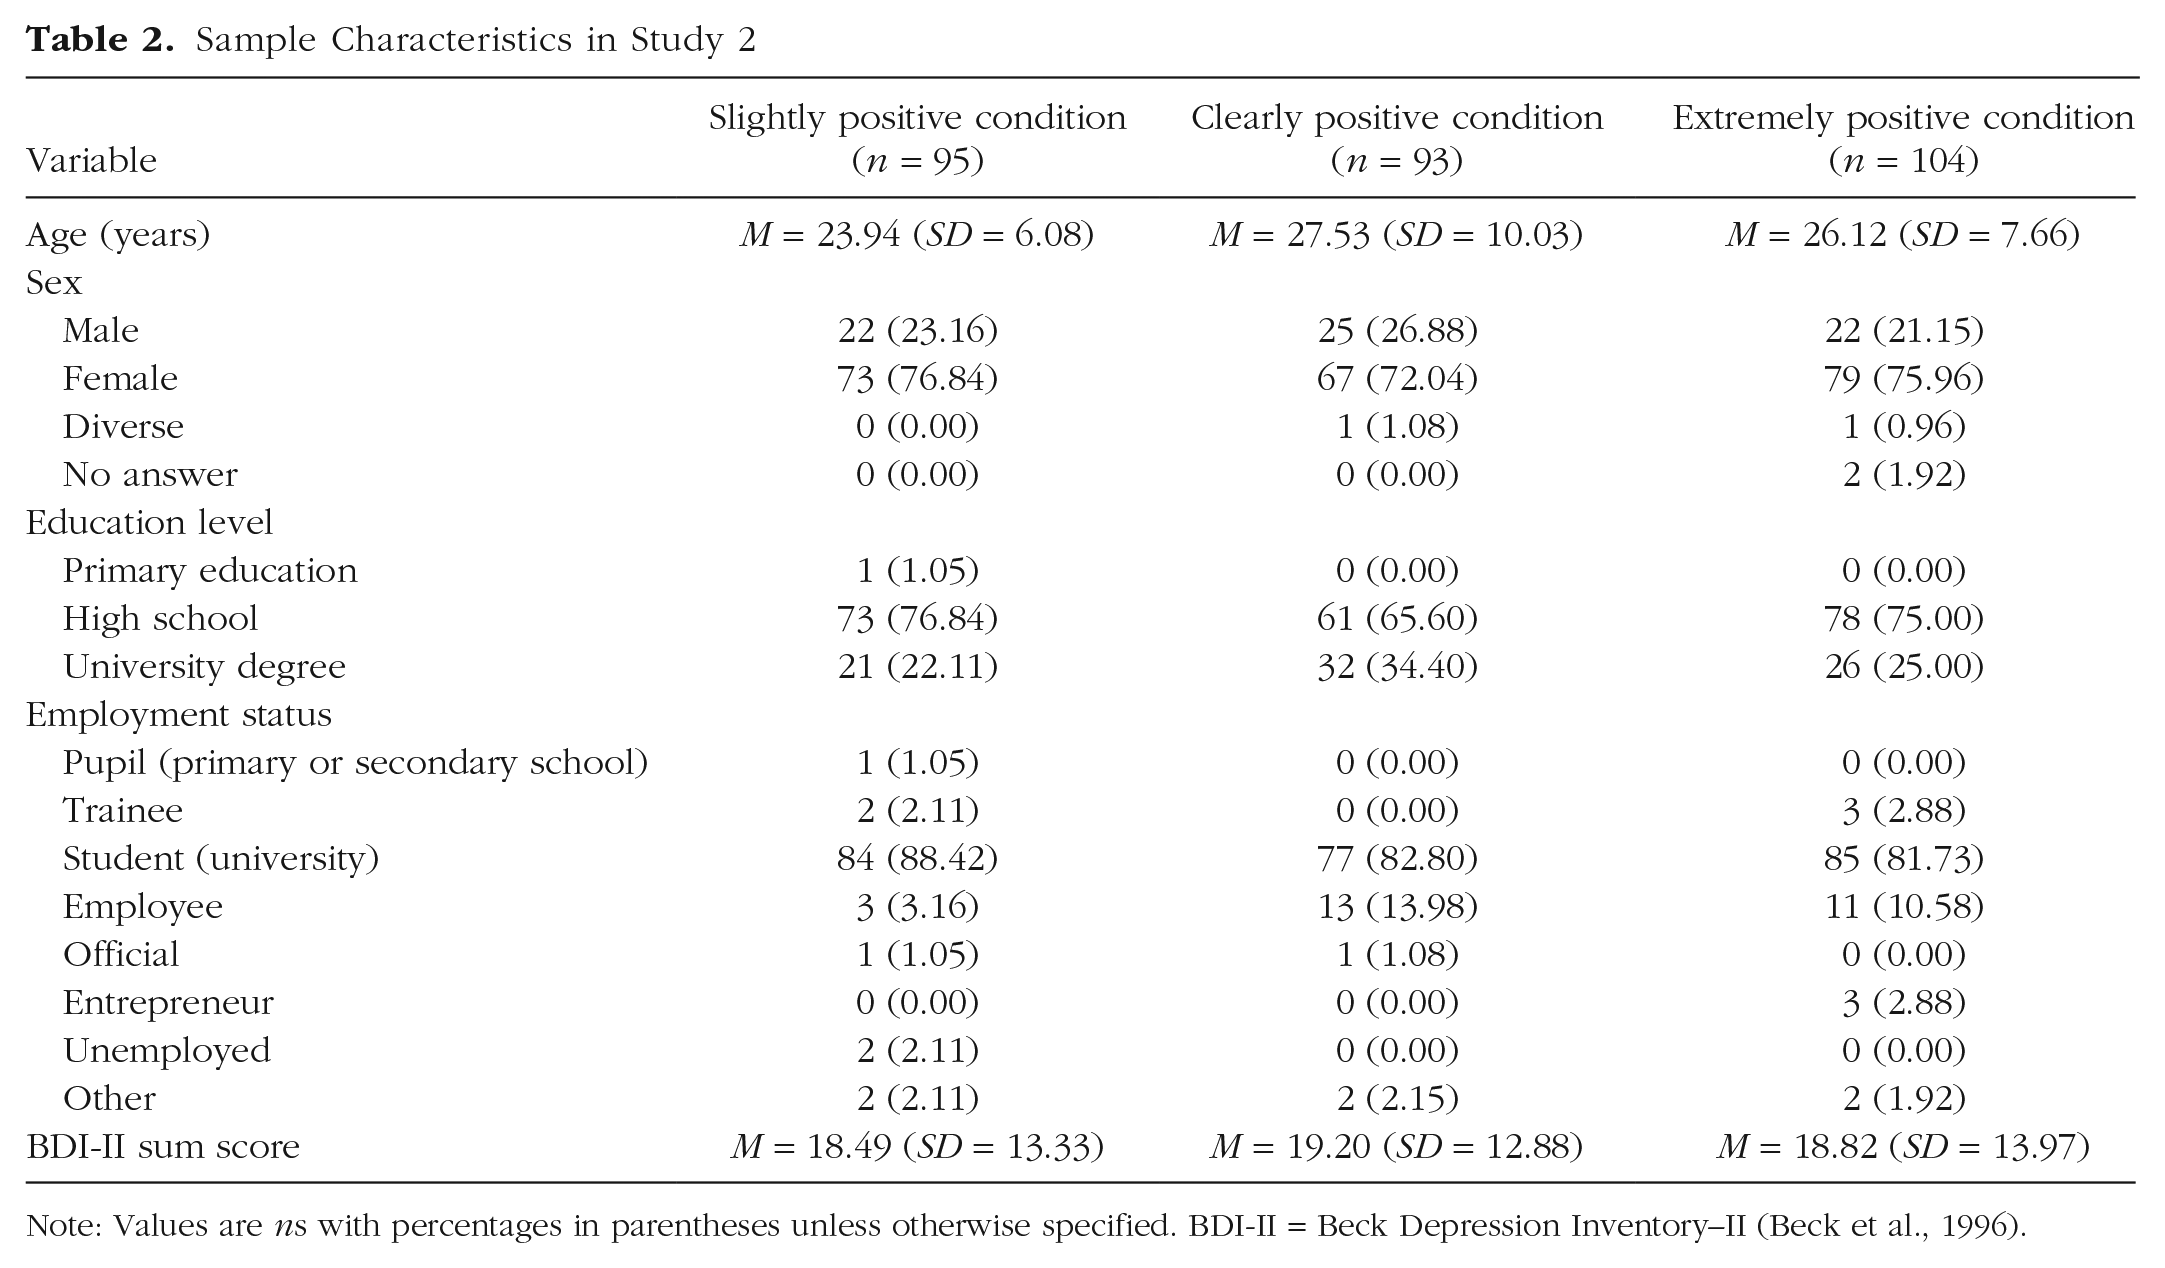
Note: Values are ns with percentages in parentheses unless otherwise specified. BDI-II = Beck Depression Inventory–II (Beck et al., 1996).
Main analyses
Differences in cognitive immunization
The ANCOVA indicated significant differences between the three feedback groups, F(2, 288) = 75.393, p < .001, η p 2 = .344. Pairwise comparisons revealed that participants from the clearly positive condition showed the lowest cognitive-immunization tendencies; they had significantly lower CISI total scores than the slightly positive condition (for the descriptive values, see also Table S3 in the Supplemental Material), t(186) = 11.388, p < .001, d = 1.661, and the extremely positive condition, t(197) = −5.931, p < .001, d = 0.846. Participants from the extremely positive condition reported significantly lower CISI total scores than participants from the slightly positive condition, t(197) = 5.733, p < .001, d = 0.814. All effect sizes were large according to Cohen (1988). BDI-II scores had significant unique effects on the CISI scores, F(1, 288) = 40.948, p < .001, η p 2 = .124; overall, participants with elevated levels of depression used more cognitive-immunization strategies (M = 86.76, SD = 25.45) than participants without depressive symptoms (M = 76.76, SD = 26.40) to devalue the positive social interactions described, which reflects a small to medium effect (d = 0.385). 4 For the group differences in cognitive immunization for people with and without increased depression levels, see Figure S3 in the Supplemental Material.
Changes in expectations
The ANCOVA indicated a significant main effect of time, F(1, 288) = 53.404, p < .001, η p 2 = .156, and there were more positive expectations after the presentation of the social interactions (M = 37.52, SD = 9.36) than before the presentation (M = 31.70, SD = 8.51). The main effect of condition was also significant, F(2, 288) = 6.787, p = .001, η p 2 = .045, and the most positive expectations were in the clearly positive condition. For the descriptive values of the three conditions at the two assessments, see Table S3 in the Supplemental Material. The Time × Condition interaction was significant, F(2, 288) = 38.383, p < .001, η p 2 = .210. Pairwise comparisons revealed that participants from the slightly positive condition updated their expectations to a lower degree than participants from the clearly positive condition, t(186) = −8.672, p < .001, d = 1.265, and the extremely positive condition, t(197) = −6.437, p < .001, d = 0.915, which reflects large effects. Although there was a trend suggesting that expectation update was greatest in the clearly positive condition, the difference between the clearly positive and the extremely positive condition did not reach significance, t(195) = 1.921, p = .056, d = 0.275. BDI-II scores had unique effects on social expectations, F(1, 288) = 93.123, p < .001, η p 2 = .244, and there were more negative expectations among people with elevated symptoms of depression. The Time × Depression interaction was not significant, F(1, 288) = 0.893, p = .345, η p 2 = .003. The Depression × Condition interaction was not significant, either, F(2, 289) = 0.838, p = .434, η p 2 = .006. 5 For the results for the update of expectations for social interactions in people with and without elevated levels of depression, see Figure S4 in the Supplemental Material.
Mediation analysis
In a mediation analysis, we found that both the CISI total scores (β = −0.390, p < .001) and condition (β = 0.235, p < .001) had significant effects on expectation update. Furthermore, the mediation analysis revealed that there was a significant direct effect of the feedback condition on expectation update, BCa 95% CI = [1.262, 3.257], as well as a significant indirect effect via cognitive immunization, BCa 95% CI = [0.074, 0.183]. That is, cognitive immunization partially mediated the effects of condition on the update of participants’ social expectations. In total, this mediation model explained 33.8% of the variance in expectation update. Note that when including only the clearly positive condition and the extremely positive condition in that mediation analysis, the direct effect was not significant any longer, BCa 95% CI = [−2.533, 1.702], but the indirect effect was still significant, BCa 95% CI = [−0.359, −0.097], which speaks to a full mediation. The mediational effect of condition on update via immunization was not moderated by BDI-II sum scores, BCa 95% CI = [−0.028, 0.033].
Discussion
The findings of Study 2 reveal that participants from the three groups differed in their engagement in cognitive-immunization strategies after being presented with social interactions with varying degrees of positivity. As hypothesized, participants who were provided with clearly positive social interactions showed the lowest degree of cognitive immunization, that is, they perceived the social interactions most positively. Consistent with this finding, participants from the clearly positive condition updated their expectations for social interactions to the greatest degree, whereas participants from the slightly positive condition exhibited the smallest expectation update. Further corroborating these findings, the results of the mediation analysis indicated that the engagement in cognitive-immunization strategies mediated the effects of condition on expectation update, and there was a relatively high amount of overall explained variance. That is, clearly positive social interactions were related to a positive perception of those interactions, and such a perception positively influenced the update of expectations in line with the positive social interactions described.
These findings are relatively consistent with the hypothesis of a tipping point at which social interactions are perceived as being so positive that doubts about their authenticity are raised (as can be seen in more cognitive-immunization tendencies in the extremely positive condition than in the clearly positive condition), thus entailing reduced expectation update. However, note that although the expectation update was descriptively lower in the clearly positive condition than in the extremely positive condition, this difference did not reach significance (p = .056).
In line with the findings from Study 1, the second experiment indicated that participants with elevated levels of depression (BDI-II ≥ 14) showed more negative reappraisal of the positive social interactions than participants without depressive symptoms. Moreover, participants with elevated levels of depression had overall more negative expectations for social interactions than people without depressive symptoms. However, Study 2 did not find support of the hypothesis that participants with depressive symptoms update their expectations to a smaller extent in line with positive social information. In addition, as in Study 1, Study 2 found no significant interaction between feedback and depressive symptoms.
General Discussion
The aim of this work was to examine in two different contexts—performance feedback and social interactions—how people update their expectations in response to novel positive information when the extent to which that information deviates from prior expectations is varied. Whereas traditional learning models (e.g., the RW model) would predict expectation update to be larger when the discrepancy between expectation and outcome is larger, we tested the hypothesis that expectation update would be largest for moderate discrepancies.
Consistent with this hypothesis, both experiments provided evidence that the engagement in cognitive immunization against new information is lowest for moderately positive information, whereas both slightly positive and extremely positive information was related to a less positive perception. The latter might be interpreted in terms of reduced credibility that is given to extremely positive information, as indicated also in the pretest of Study 1. The former, that is, high cognitive-immunization tendencies for slightly positive information, suggests that both people with and without depressive symptoms place little confidence in mildly positive feedback (being in the upper half in Study 1 and having a superficially nice conversation in Study 2, respectively). This suggests that people anticipate receiving more positive feedback and become suspicious when the feedback is only slightly positive. Although this finding is well in line with research on an optimistically biased self-perception in healthy people (Korn et al., 2012; Schwert et al., 2018; Sharot et al., 2011), it is surprising to see that this finding also applied to people with elevated depressive symptoms.
Regarding the update of prior expectations as a function of the positivity of new information, however, the two studies do not allow definite conclusions concerning the hypothesized pattern of expectation update. Although in both experiments the overall expectation update was indeed highest in the clearly positive condition, in Study 1, this effect could be observed only on a descriptive level and failed to reach statistical significance. Study 2 revealed that the difference between the slightly positive condition and the clearly positive condition and the difference between the slightly positive condition and the extremely positive condition were significant. In addition, there was a nonsignificant trend in Study 2 that suggests that the extent of expectation adjustment drops somewhat from clearly positive information to extremely positive information. Thus, the present results do not support the hypothesis of the RW model, which states that the larger the prediction error, the larger the update; on the other hand, the results also do not clearly support our hypothesis of a tipping point at which the discrepancy between expectation and outcome is so large that updating is reduced.
With respect to the influence of depressive symptoms on expectation updating, the two experiments provided inconclusive findings. On the one hand, both experiments confirmed the hypothesis that cognitive immunization against positive new information is increased among participants with elevated symptoms of depression. On the other hand, both studies failed to replicate the finding from previous research that depression is related to difficulties in revising negative expectations in line with novel positive information.
Theoretical implications
The present findings raise some novel questions as to how people integrate new information as a function of its positivity. Previous research into belief updating in depression used to treat confirming information and disconfirming information as rather binary concepts. However, the extent to which new information can deviate from prior beliefs in fact varies dimensionally. We took this aspect into account by providing participants with slightly positive feedback, clearly positive feedback, and extremely positive feedback. The results regarding cognitive immunization suggest that there might be a tipping point at which new information appears overly positive and is thus perceived as lacking credibility. However, the present study did not find clear evidence for the hypothesis that extremely positive information is also related to reduced expectation updating in response to new information, although there was a descriptive trend for the greatest update if new information was moderately positive.
The failure to reveal the hypothesized relation of expectation updating and the degree of expectation violation could imply that there is no such thing as a tipping point; instead, positive information may entail a relatively constant degree of expectation update as long as it exceeds a certain threshold of positivity. An alternative interpretation, however, is that there is, in fact, a tipping point but that the variation of the information provided to the participants in our studies was not ideal to unfold that tipping point. To test this competing interpretation, researchers may consider using even more extreme expectation-disconfirming information (e.g., “You are among the best 0.01%”) or a different format in which the feedback is provided (e.g., more verbalized feedback, such as, “These results suggest that you are the most intelligent person that has ever participated in that study”). In pursuing these hypotheses, future research may also consider computational modeling that might be a powerful approach to examine whether the data are more consistent with the model of a linear relationship than an inverse U-shaped relationship between the magnitude of the prediction error and the degree of expectation updating (Adams et al., 2016; Friston et al., 2014).
In terms of underlying mechanisms of expectation updating, both studies consistently found in mediation analyses that the extent to which participants negatively reappraised novel positive information mediated the effects of that information on expectation updating. These findings are consistent with recent computational work that suggests that the update of prior beliefs critically depends on the weight that is given to new information (i.e., the precision of new information; Paulus et al., 2019). Given that cognitive immunization has been theorized to be the psychological equivalent of aberrant precision in Bayesian belief updating (Kube & Rozenkrantz, 2021), the results of the current mediation analyses are consistent with such computational accounts in that they indicate that negative reappraisal reduces the weight that is afforded to new information, thereby lowering its influence on the posterior expectation. However, note that the design of the present study did not allow a formal test of this account using computational modeling.
The present findings also provide some implications for the understanding of depression, although we recognize that we did not examine samples that were formally diagnosed with a major depressive disorder. In contrast to previous findings (Everaert et al., 2018, 2020; Kube, Rief, et al., 2019), depressive symptoms in both studies were not significantly associated with a reduced integration of novel positive information. These discrepant findings are possibly related to the lack of a sufficient number of people with clinically relevant depressive symptoms in the present work. Indeed, other research has shown that people with a diagnosed depressive disorder differ from subclinically depressed individuals in the extent to which expectation updating is impaired (Kube et al., 2021). Aside from the overall results for expectation updating in relation to depression, Study 1 pointed to some interesting trends regarding the distinction between task-specific and generalized expectations. In particular, people with elevated levels of depression had no difficulty updating their expectations for their performance in a specific task if provided with positive feedback on that task; descriptively, they updated their task-specific performance expectations even somewhat more than participants without depressive symptoms. However, as suggested by the results for cognitive immunization, people with increased symptoms of depression tended to consider the positive feedback as an exception and thus were reluctant to update their generalized performance expectations in response to the positive feedback received: In terms of a nonsignificant trend, the update of generalized expectations was somewhat lower in participants with elevated levels of depression.
These results suggest that depression might be related to a lack of generalizing unexpectedly positive learning experiences. This might be further investigated in future research examining samples with higher rates of clinical depression. Moreover, in view of the results from the pretest of Study 1 that showed an independence of positivity and credibility of new information, it might be worth investigating in future research how the deviation from expectations relative to the credibility of new information influences expectation updating—and whether this effect is moderated by depression.
Clinical implications
Although we see our work primarily as a contribution to the understanding of determinants of expectation updating in people with and without depressive symptoms, it may also have some implications for psychological treatments of depression. With reference to inhibitory learning approaches in anxiety disorders (Craske et al., 2014), it has been proposed that the modification of negative expectations in people with depression might be enhanced by providing them with disconfirming positive experiences (e.g., through the conduction of behavioral experiments; Rief & Glombiewski, 2016). These inhibitory learning approaches assume that the greater the discrepancy between predicted and actual outcome, the greater the update of patients’ expectations. Accordingly, researchers recommended to “maximally violate expectancies regarding the frequency or intensity of aversive outcomes” (Craske et al., 2014, p. 12). To some extent, our results question this assumption in that they do not indicate that extremely positive information entails the largest update of (generalized) expectations. Rather, our results suggest that there might be a drop of expectation update if new information is overly positive. Clearly, this needs to be further investigated, but if future work were to confirm the hypothesis of an inverse U-shaped relationship between the positivity of new information and expectation update, this would imply that therapists may aim to provide patients with information that is clearly positive, yet not unrealistically positive, to prevent patients from disregarding it through cognitive-immunization strategies.
Strengths and limitations
To our knowledge, the present studies are the first to systematically investigate how the strength of unexpectedly positive feedback (technically, the magnitude of a prediction error) influences expectation updating in people with and without depressive symptoms. Further strengths of our contribution can be seen in the implementation of two consecutive experiments with sufficiently large samples, the examination of expectation updating in two different contexts (performance feedback and social interactions), and the use of different types of tasks (i.e., a false-feedback task and a vignette task). This may underscore the robustness of our findings given that we did not study the subject of scrutiny in only a single task/context. Moreover, we did not decide on the operationalization of the positivity of new information “out of the blue” but performed a pretest before each experiment, which helped us design the feedback conditions on the basis of the data. Notwithstanding these strengths, the present studies also have clear limitations that need to be considered.
A significant limitation refers to the sample and the diagnostic assessment: Our assessment of depressive symptoms relied solely on the BDI-II as a self-report measure, and we did not use an external (i.e., clinician-rated) diagnostic assessment of the depression status. Another limitation relating to our samples is that both studies examined—on average—highly educated people with a mean age around 25. Therefore, the generalizability of the findings to elder samples with lower educational degrees might be questioned. Furthermore, although our studies were the first to vary the strength of positive feedback dimensionally in research on expectation updating in depression, it would be valuable to have had even more variations of the degree of positivity of new information (e.g., five experimental conditions) to be able to examine the relationship between the magnitude of the prediction error and expectation update in a more fine-grained manner. In addition, we focused only on unexpectedly positive feedback but did not examine unexpectedly negative feedback because previous research revealed no abnormalities for the latter in individuals with depression (Everaert et al., 2018; Kube, Kirchner, et al., 2019); yet it might be worthwhile for future work also to examine the relationship between the strength of negative feedback and expectation updating in people with and without depressive symptoms. Moreover, the present studies examined only short-term effects of updating, and it remains unclear how stable the changes in expectations are over time. An additional limitation is that participants were not required to spell out their specific prediction explicitly, as is typically done in clinical practice (i.e., exposure treatment). This could have led to a greater adjustment of predictions. A further limitation is that some potentially interesting sociodemographic data were not collected, such as a measure of income and socioeconomic status. In Study 1, one may criticize that the number of items in the key outcomes measures (i.e., the performance expectations scale and the cognitive-immunization scale) was fairly low and that the reliability of the cognitive immunization was not optimal.
Furthermore, note that the factor structures revealed by the factor analyses conducted on the performance expectations and cognitive-immunization scales in Study 1 did not support the assumption of meaningful content-related distinctions between the respective subscales of the two questionnaires. A limitation regarding the assessment of expectations in Study 1 is that participants rated their expectations for an unknown test in the first assessment, whereas they were familiar with the test at the second assessment, which limited conclusions about how the provision of feedback within each condition influenced expectations (because change in expectations would have been jointly influenced by both the impact of this particular type of feedback and the task experience). A further limitation pertaining to the expectation measurement in Study 1 is that the first assessment referred to the expected performance in the upcoming task (which might also have been influenced by current situational factors), whereas in the second assessment, participants rated their expectations to be successful in similar tasks in the more distant future. However, as with the previous limitation, it is unlikely that this issue compromised the results of the main analysis (i.e., the Time × Condition interaction) because it applies to each condition in the same way. Another important limitation of Study 2 is that this study, in contrast to Study 1, did not rely on actual experience, but hypothetical experience. Specifically, whereas Study 1 assessed what participants expected to occur given what they had experienced, Study 2 required them to convey how they expected their expectations to be affected were something to occur. Thus, individual differences in expectations observed in Study 2 could reflect either a variation in how expectations actually would be influenced by such occurrences or individual differences in expectations concerning how expectations would be influenced by such occurrences (which may or may not be accurate).
Conclusions
The present research examined the extent to which people with and without depressive symptoms update their expectations in response to new information of varying positivity. It was hypothesized that expectation update would be greatest for moderate discrepancies between prediction and outcome. The current findings suggest that although moderately positive information was—in line with our hypothesis—perceived most valid compared with slightly positive information and extremely positive information, the effects of the positivity of new information on expectation updating were small or even null. Thus, the present results do not provide clear support of the hypothesized tipping point at which new information deviates so largely from the expectation that it has reduced influence on the updated expectation. At the same time, the current results clearly challenge the central prediction of traditional learning models like the RW model of a linear relationship between prediction error and update given that both studies pointed to a drop in (generalized) expectation update from moderately to extremely positive information. Both studies confirmed the hypothesis that the appraisal of new information mediates the effects of that information on expectation updating. Regarding the understanding of depression, our results suggest that people with depression use positive feedback to update their expectations in a specific task but have difficulty generalizing this positive learning experience.
Supplemental Material
sj-pdf-1-cpx-10.1177_21677026211024644 – Supplemental material for How the Discrepancy Between Prior Expectations and New Information Influences Expectation Updating in Depression—: The Greater, the Better?
Supplemental material, sj-pdf-1-cpx-10.1177_21677026211024644 for How the Discrepancy Between Prior Expectations and New Information Influences Expectation Updating in Depression—: The Greater, the Better? by Tobias Kube, Lukas Kirchner, Gunnar Lemmer and Julia Anna Glombiewski in Clinical Psychological Science
Footnotes
Acknowledgements
We are very grateful to Jascha Löbel, Marsha Helmstädter, and Laura Kittel for their contribution to the conduction of Study 1. In addition, we are very grateful to Elisabeth Rüdiger for her support of Study 2. Special thanks go to Tara Vonessen for her great help with the development of the imagined-social-interactions task.
Transparency
Action Editor: Colin MacLeod
Editor: Kenneth J. Sher
Author Contributions
T. Kube developed the study concept. All of the authors contributed to the study design. Testing and data collection were performed by T. Kube. T. Kube and L. Kirchner performed the data analysis and interpretation under the supervision of G. Lemmer and J. A. Glombiewski. T. Kube drafted the manuscript, and L. Kirchner, G. Lemmer, and J. A. Glombiewski provided critical revisions. All of the authors approved the final manuscript for submission.
Notes
References
Supplementary Material
Please find the following supplemental material available below.
For Open Access articles published under a Creative Commons License, all supplemental material carries the same license as the article it is associated with.
For non-Open Access articles published, all supplemental material carries a non-exclusive license, and permission requests for re-use of supplemental material or any part of supplemental material shall be sent directly to the copyright owner as specified in the copyright notice associated with the article.