
Abstract
A reciprocal relationship between repetitive negative thinking (RNT) and negative affect (NA) has been found in various types of psychopathology. Recent studies have suggested that the magnitude of this association can vary across time and individuals, which may inform future psychopathology. Here, we explored how these dynamics and interplays are manifested in student and general populations using a statistical clustering algorithm. Across three experience-sampling data sets, our clustering analyses consistently identified two groups of individuals; one group had a higher bidirectional association between RNT and NA (and also higher inertia) than the other group. Furthermore, a prospective analysis revealed that the group with the higher bidirectional association is at risk of developing depressive symptoms during the 3-month follow-up period if they had experienced high levels of NA over the experience-sampling phase. These findings suggest that the dysfunctional affective and cognitive dynamics would be a promising target of preventive intervention.
Keywords
Repetitive negative thinking (RNT) is found to be elevated across various mental disorders and is now regarded as an important transdiagnostic process (Ehring & Watkins, 2008; Harvey & Watkins, 2004). RNT conceptually covers depressive rumination, defined as “repetitive and passive thinking about one’s symptoms of depression and the possible causes and consequences of these symptoms” (Nolen-Hoeksema, 2004, p. 107), and worry, defined as “a chain of thoughts and images, negatively affect-laden, and relatively uncontrollable” (e.g., Borkovec et al., 1983, p. 10). Traditionally, worry and rumination have been studied in isolation from a disorder-focused perspective (e.g., rumination in depression; worry in anxiety). However, there is now broad evidence that both rumination and worry are transdiagnostic phenomena in that they are associated with and even predict a wide range of psychopathology, including depression, anxiety, insomnia, and binge eating (e.g., Borkovec et al., 1998; Carney et al., 2006; Hoyer et al., 2002; Nolen-Hoeksema, 2000; Nolen-Hoeksema et al., 1993; Purdon & Harrington, 2010; Roberts et al., 1998). On the other hand, there are somewhat different views in the literature regarding the precise nature of the relationship between worry and rumination. Whereas some authors have suggested that they are best regarded as distinct—albeit related—processes (e.g., Papageorgiou & Wells, 1999), other authors have proposed that worry and rumination are two variants of the same underlying process that can be defined as RNT (e.g., Ehring & Watkins, 2008). Note that the latter view suggests that the process characteristics of RNT that worry and rumination have in common are responsible for its dysfunctional effects rather than the disorder-specific content. There is now accumulating evidence supporting this view (e.g., McEvoy et al., 2018; Spinhoven et al., 2018; Topper et al., 2014). The current study was therefore also based on the concept of RNT as a transdiagnostic process.
For the past decades, research has explored how RNT contributes to psychopathology, and one of the most robust findings in the literature is that RNT increases negative affect (NA; Huffziger et al., 2013; Nolen-Hoeksema & Morrow, 1993). Furthermore, research has established a feedback loop of NA enhancing RNT (e.g., Moberly & Watkins, 2008), which is part of the definition of depressive rumination as a response to dysphoria (e.g., Nolen-Hoeksema, 2000; Nolen-Hoeksema et al., 2008). This bidirectional association is supported by studies using experience-sampling method (ESM; Reed & Csikszentmihalyi, 2015), which is a standard approach to observing participants’ moment-to-moment psychological experiences and their dynamics in daily life settings. In a typical design, participants report their current feelings, thoughts, and/or behavior via mobile devices in response to signals that are emitted several times per day for 1 or 2 weeks. Using ESM, Moberly and Watkins (2008) showed that ruminative self-focus in a moment predicts NA in the next moment and vice versa, although other ESM studies have suggested that the effect of RNT on affect may vary across the types of RNT (i.e., rumination vs. worry; Kircanski et al., 2018) and may have substantial individual differences (Pasyugina et al., 2015). Furthermore, the increased association between RNT and NA is highlighted as a precursor of depression. A single-case study using ESM suggested that worry becomes more strongly associated with positive affect and NA as a sudden shift in depressive symptoms (or the moment of relapse) approaches (Wichers & Groot, 2016). This strong association is regarded as an early warning sign that informs a near-future transition into depression, which is typically accompanied by other statistical features, such as increased autocorrelation (so-called inertia) in the repeatedly assessed cognition and affect scores (van de Leemput et al., 2014; Wichers, 2014; Wichers et al., 2019).
Note that an early warning sign was originally studied as a “state” predictor, which can vary across time within a person. However, the same phenomenon (i.e., RNT-NA association) has been related to individual differences in depressive symptoms (Moberly & Watkins, 2008) and neuroticism in personality (Bringmann et al., 2013), which therefore could be used to identify individuals who are at high risk of developing psychopathology in the future (Brose et al., 2015; Pasyugina et al., 2015). 1 Despite the potential predictive value, it is largely unknown how the rigidity in the association between RNT and NA is manifested in a population and whether individuals with such rigidity are to develop psychopathology over time.
In the current study, we applied a statistical clustering method to three ESM data sets to explore how individuals in student and general populations can be clustered according to the strength of the RNT-NA associations, and we also tested whether these clusters are predictive of future depressive symptoms. Because our focus was on examining RNT-NA associations as indicators of risk for developing depressive symptoms (and not a marker of current psychopathology), we collected data in nonclinical populations. In addition, unlike previous studies relating depressive symptoms to the unidirectional effect of RNT on NA or that of NA on RNT separately (e.g., Moberly & Watkins, 2008; Pasyugina et al., 2015), we used a clustering approach (a) to demonstrate that there is a group of individuals showing the bidirectional relationship between RNT and NA and (b) to explicitly test how vulnerable those individuals are for depressive symptoms. Although clustering on an ESM data set has been rarely conducted, an exceptional study (Bulteel et al., 2016) clustered individuals for the day-to-day associations between various depressive symptoms (e.g., loss of energy, poor sleep quality, rumination). The authors identified two groups of individuals in their nonclinical sample: One was labeled rigid responders, who showed higher associations between the symptoms, whereas the other group was labeled flexible responders and showed lower symptom associations.
Another important dimension in a model of affective dynamics is the autoregressive components of the outcome variables (e.g., the effect of NA at a given time point predicting NA at the next moment). This autoregressive effect is understood as inertia (or emotional inertia), representing the degree to which affect (and cognition) is resistant to change over time (Kuppens et al., 2010). Studies have found that high emotional inertia is a good predictor of the current and future levels of depressive symptoms (Koval et al., 2012; Kuppens et al., 2012). Van de Leemput et al. (2014) also found that emotional inertia was elevated among general as well as clinical populations who consequently experienced significant changes in depressive symptoms. Because inertia is known to be predictive of psychopathology, our clustering also considered the two inertia (or autoregressive) parameters for RNT and NA as well as the two directional (or cross-regressive) effects of RNT on NA and of NA on RNT.
As an overview, we analyzed three ESM data sets across Studies 1 through 3. In Study 1, we explored potential clusters of individuals who share similar dynamics features for worry and NA, as assessed via ESM. In Study 2, we aimed to replicate the findings of Study 1 on another ESM data set with slightly different items (i.e., focusing on RNT instead of worry). The goal of Study 3 was to test the risk of the identified group or groups to develop depressive symptoms at a 3-month follow-up. This prospective analysis was performed to extend the knowledge of the predictive value of the combined dynamics features, which has been based almost exclusively on cross-sectional evidence (e.g., Bringmann et al., 2013; Bulteel et al., 2016; Moberly & Watkins, 2008).
Study 1
The purpose of Study 1 was to cluster individuals according to the dynamics of worry and NA. In this ESM study, we assessed momentary levels of worry and NA 10 times per day for 4 days. We expected that the clustering would identify a group of individuals who are characterized by the bidirectional relationship between worry and NA, although we did not have a specific hypothesis for the number and types of clusters that would emerge in the analyzed sample.
Method
Participants
In total, 142 participants were recruited via flyers distributed in the buildings of Ludwig Maximilian University (LMU) of Munich, online university portals, and social-networking services. In the flyers, it was stated that the aim of the study was to investigate the relationship between worry and mood in participants’ daily lives. There were no specific inclusion and exclusion criteria. The majority of participants were psychology students (40%). We did not perform a priori power analysis to designate the sample size because of the exploratory nature of this study. However, our sample size was larger than that of Bulteel et al. (2016), who used the same clustering method as the current study and found the cluster of rigid responders among 56 participants.
Twelve participants were excluded from the data analyses for the following reasons: (a) aborted participation and/or technical problems with software (n = 10) and (b) low compliance with ESM, five or fewer responses (n = 2). The final sample size was 130: 15 men and 115 (88.5%) women. The mean age was 23.9 years (SD = 5.7).
Measures
Momentary negative affect
Momentary levels of NA were assessed by the following eight items: anger, disgust, fear, sadness, tension, shame, guilt, and disgust (Gross & Levenson, 1993; Llera & Newman, 2014). Participants rated the extent to which each item represented their current mood using a 5-point Likert scale (1 = not at all, 5 = very much).
Worry
Momentary levels of worry were assessed by the following three questions: (a) How much did you worry in the past 30 min? (b) How much did you feel bothered by worrying in the past 30 min? and (c) How uncontrollably did you experience worry in the past 30 min? These items were adapted from previous ESM studies that have focused on worry, and they reflect each dimension of impairment and uncontrollability for the current worrisome thoughts (Pieper et al., 2007, 2010; Szabó & Lovibond, 2002; Thielsch et al., 2015; Verkuil et al., 2007). Note that these earlier studies established the good psychometric properties of the worry items (e.g., convergent validity for the association with trait measures of worry). Each item was rated on a 5-point Likert scale (1 = not at all, 5 = very much).
Both worry and NA scales exhibited good reliability in the current data: rkf = .99 and rc = .72 for NA; rkf = .99 and rc = .87 for worry (Shrout & Lane, 2012).
Baseline questionnaires
Penn State Worry Questionnaire
The Penn State Worry Questionnaire (PSWQ; Meyer et al., 1990; Stöber, 1995) is a self-report questionnaire consisting of 16 items designed to measure a general tendency to worry. The items capture the intensity, impairment, and uncontrollability of worry (e.g., “When I am under pressure, I worry a lot” and “Many situations make me worry”), which are rated on a 5-point Likert scale (1 = not at all typical for me, 5 = extremely typical for me). The internal consistency was very good (α = .91).
Perseverative Thinking Questionnaire
The Perseverative Thinking Questionnaire (PTQ; Ehring et al., 2011) is a 15-item questionnaire designed to assess repetitive negative thinking. Participants rate each item (e.g., “The same thoughts keep going through my mind again and again”) on a 5-point Likert scale (0 = never, 4 = almost always). The questionnaire showed a very high internal consistency (α = .93).
State-Trait Anxiety Inventory
The State-Trait Anxiety Inventory (STAI; Spielberger, 1983) is a self-administered questionnaire assessing long-term chronic levels of anxiety (STAI-T) and current level of anxiety (STAI-S) with 20 items each. Participants rate statements such as “I feel calm” or “I am worried” on a 4-point Likert scale (1 = not at all, 4 = very much). The internal consistency was good for both scales (α = .91 and α = .90, respectively).
Beck Depression Inventory II
The Beck Depression Inventory II (BDI-II; Beck et al., 1996) is a 21-item questionnaire assessing the symptoms of depression at the affective, cognitive, behavioral, somatic, and motivational levels and suicidal thoughts within the past 2 weeks. For each item, different statements are provided, and participants are asked to choose the most appropriate variant (e.g., 0 = I am not sad, 3 = I’m so sad or unhappy that I cannot stand it). The internal consistency was good (α = .88).
Procedure
After arrival at the lab, participants received an explanation of the study procedure and then provided written informed consent. Next, participants completed the baseline questionnaires. The 4-day ESM phase started on the next day of the baseline assessment. Participants received 10 signals per day on their mobile phones that prompted participants to respond to questions concerning their current moods and thoughts.
These ESM signals were emitted 10 times per day from 10 a.m. to 10 p.m. at semirandomized intervals of around 1 hr. Participants had to enter their responses within 5 min of receiving each signal emission, although they could choose to answer within the 5 min or to postpone it once for a maximal 15 min. MovisensXS software (Versions 0.4.2437 and 0.7.416; movisens GmbH, Karlsruhe, Germany) was used to control the signals and to record participants’ responses.
After completing the ESM assessment, participants received course credit or monetary compensation (average €20); the amount of the compensation was discounted according to the number of uncompleted signals. The study protocol was approved by the ethics committee of the Department of Psychology at LMU Munich.
Statistical analyses
Our statistical analyses consisted of the following three steps: (a) clustering individuals via the alternating least squares (ALS) algorithm on ESM-assessed worry and NA (Bulteel et al., 2016), (b) testing whether each dynamics parameter varied across the identified groups, and (c) exploring group differences in depressive symptoms. The ALS algorithm clusters individuals according to the estimates of a vector autoregressive (VAR) model. Here, the VAR model was specified as two regression models: Either worry or NA at time T was predicted by worry and NA at time T – 1. This formulation provides the following four dynamics parameters: two autoregressive effects (for worry and NA) and two cross-regressive effects (of worry on NA and of NA on worry). To keep the interval between times T and T – 1 consistent, we did not include the initial responses on each day in the analyses.
The ALS algorithm fits the VAR model separately on given groups of participants and then updates the group partitioning in search of the (local) minimum residuals of the VAR models. This means that the ALS algorithm requires the number of groups and initial group partitioning as hyperparameters before the optimization routine. Users may give a specific number of groups from their knowledge about the data, or they may evaluate the goodness of fit for each number of groups exhaustively (see the next paragraph). The group partitioning is typically given by random group assignment and/or a hierarchical clustering method (e.g., Ward method) on individual VAR estimates per participant. In each step of the optimization routine, a VAR model is estimated on each of the partitioned groups, whose residuals are evaluated to update the group partitioning; that is, the algorithm searches the best partitioning that minimizes the sum residual across all groups.
The number of groups is determined by the CHull procedure (Ceulemans & Kiers, 2006; Wilderjans et al., 2013), which searches the maximum scree-test (st) ratio. The st ratio evaluates relative information gain when adding one extra group. This ratio score can be defined for any number of groups that the user of the ALS algorithm assumes. The local maximum of st ratios indicates the number of groups that best explains the data because this means that adding another group does not improve the model fit meaningfully.
The CHull procedure considers the complexity of the models and selects the smallest number of groups with a (locally) maximum explanation of the data. A disadvantage of this procedure is that by default, it cannot select the model with the lowest complexity (i.e., the model with only one group; Wilderjans et al., 2013). For example, the st ratio for the model with two groups (k = 2) is given as the relative reduction in the sum residual form k = 1 to k = 2 to the reduction from k = 2 to k = 3. Because the model with k = 0 does not exist (i.e., zero group in a data set), an st ratio cannot be defined for k = 1. To circumvent this zero-complexity issue, Wilderjans et al. (2013) suggested including in the comparison an even simpler model, such as a regression without any predictors but with only an intercept. At the same time, they warned that this null model should not be too simple to avoid an inflation of the st ratio at k = 1. Following this recommendation, we defined the null (k = 0) model to have the intercept and autoregressive (but not cross-regressive) effects because we were more interested in the cross-regressive effects in the current analyses.
All variables used in the ALS clustering were first standardized with the grand means and standard deviations (for comparability across studies using different measures of RNT and NA), and then person-mean centered to specifically focus on the intraindividual dynamics in worry and NA. The person-mean centering eliminates the individual differences in the mean levels of the predictors, which allows for estimating the autoregression and cross-regression effects without the influences of the between-persons variance.
As the second step of the analyses, group differences in the autoregression and cross-regression coefficients were tested by multilevel models (for more details, see Takano et al., 2021). We estimated two multilevel models that are parallel to the VAR model used in the ALS clustering; that is, (a) worry at time T was predicted by worry and NA at time T – 1, and (b) NA at time T was predicted by worry and NA at time T – 1. On top of this Level 1 structure, the models included ALS-assigned group memberships as a Level 2 predictor and their interactions with worry and NA as cross-level interactions. Each autoregression and cross-regression coefficient was assumed to vary across participants (i.e., random effects). We were specifically interested in the cross-level interactions, which clarified whether the autoregressive and cross-regressive coefficients significantly differed across groups. We also tested the conditional effects (or simple slopes) of worry and NA for each group to determine whether the worry-NA association is unidirectional or bidirectional (or null) for each group (Preacher et al., 2006). We used the R package lme4 (Bates et al., 2015) to estimate the models with restricted maximum likelihood estimation.
The third step of the analyses was to relate the ALS-identified groups to concurrent levels of psychopathology. We performed simple t tests to explore the group differences in depressive symptoms and other psychopathology measures.
Results
Descriptives and compliance
There were 24 participants who had a BDI-II score above the cutoff (> 13) for moderate levels of depressive symptoms (Beck et al., 1996). As for the compliance with ESM, we calculated the mean number of ESM responses across participants, which was 37.26 (SD = 3.86) out of 17 to 43 ESM signals that were actually sent to each participant. Given that most participants received more than 35 signals over the ESM period, the lower limit of the observed compliance rate was regarded as approximately 40% (see Study 2). Because of system errors, some participants received more than the scheduled number (i.e., 40) of signals (n = 15), which made the response-to-response intervals more variable than we initially planned. Because a VAR model assumes that intervals between consecutive measurements are of equal length (e.g., Bulteel et al., 2016), we excluded 30 responses that were too close to the previous responses (i.e., made within 30 min of the previous response). We also excluded 198 responses that were made more than 120 min after the previous response (e.g., when a response was missing).
ALS clustering
First, we clustered participants using the ALS algorithm for the worry and NA dynamics. To determine the number of clusters, we examined the sum residuals for k = 0 – 4 clusters, which showed the largest reduction between k = 1 and k = 2. Indeed, the CHull procedure indicated k = 2 as the best model, with st ratios of 0.20, 2.37, and 1.83 for ks = 1, 2, and 3, respectively.
Second, we estimated two multilevel models in which either NA or worry at time T was predicted by NA and worry at time T – 1 as well as their cross-level interactions with the ALS groups. Figure 1 represents the estimated autoregressive and cross-regressive effects for each group.
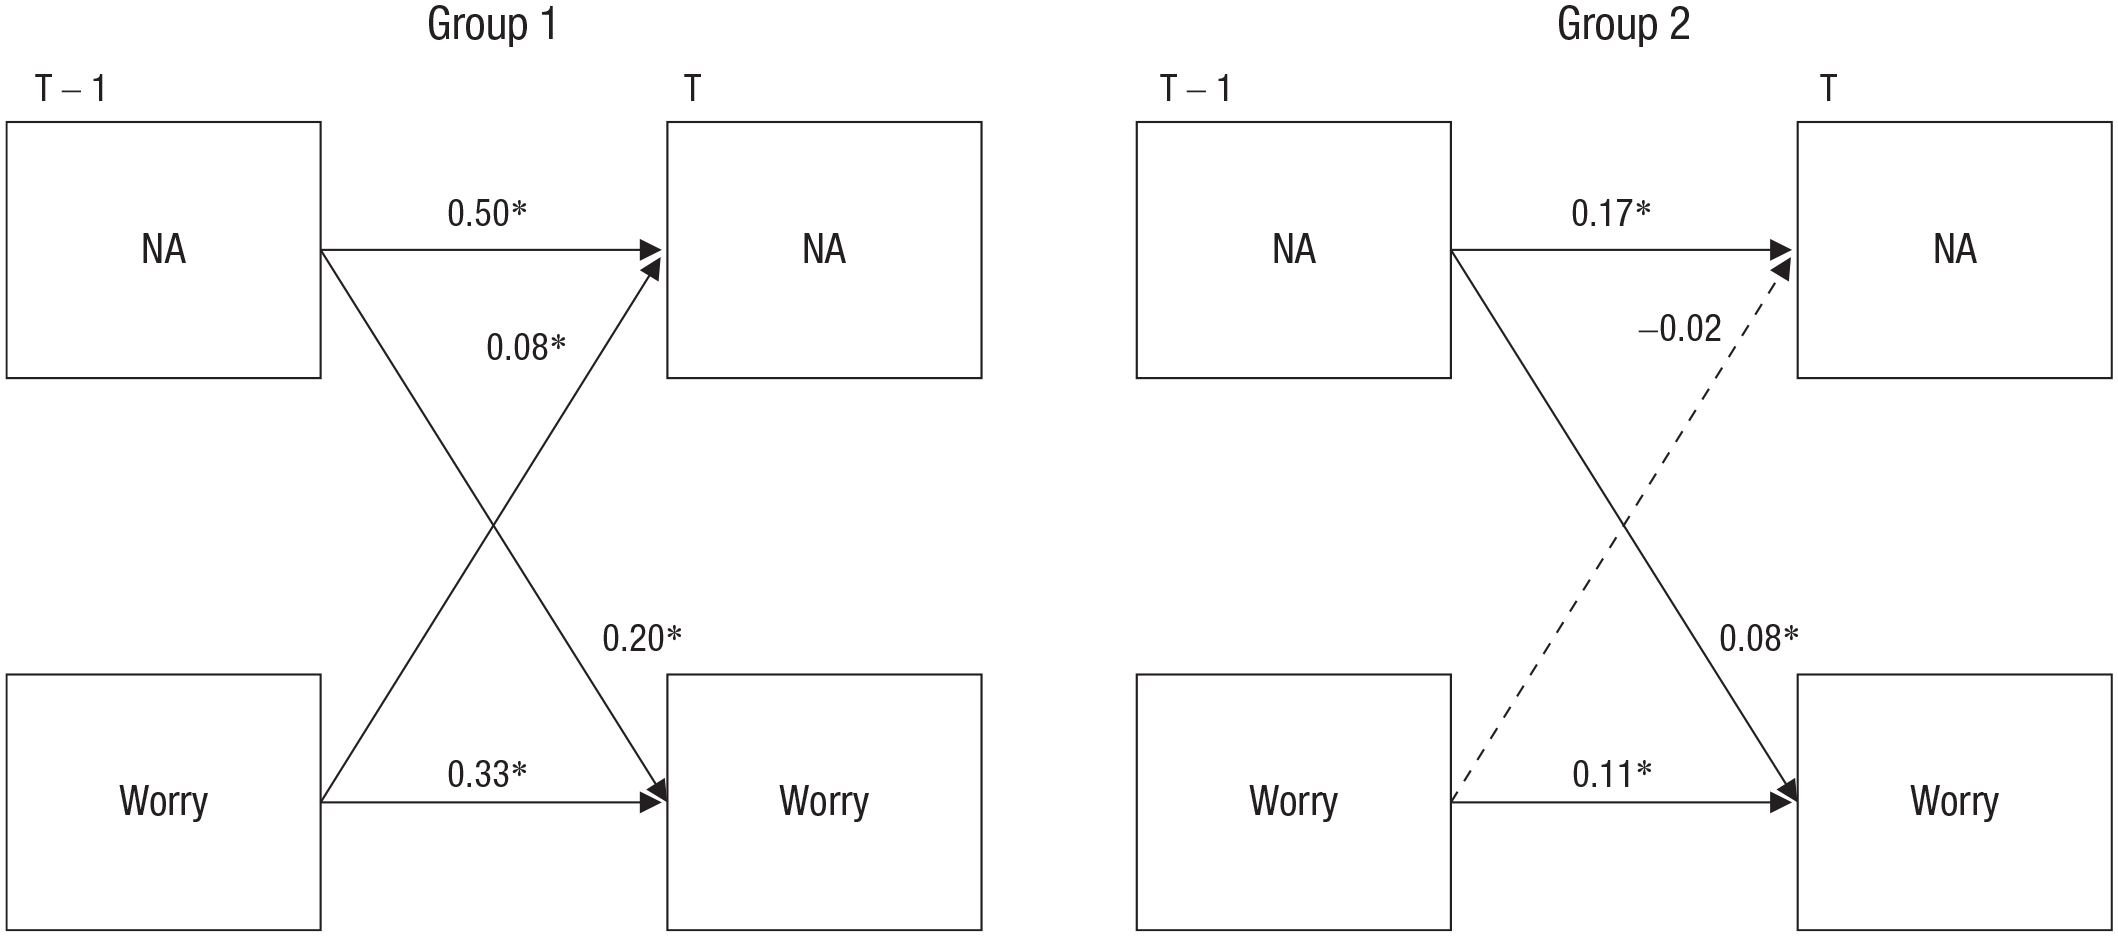
Groups identified by the alternating least squares algorithm. Group 1 (n = 53) is characterized by higher autoregression and cross-regression coefficients than Group 2 (n = 77; the group differences were statistically significant for all regression coefficients). NA = negative affect; T = time; RNT = repetitive negative thinking. Asterisks indicate that the coefficient is significantly different from zero (*p < .05).
When predicting NA at time T, both NA and worry at time T – 1 had significant cross-level interactions with the groups, suggesting that the autoregressive effect of NA is higher in Group 1, b = 0.50, SE = 0.03, t(162.17) = 14.72, p < .01, than in Group 2, b = 0.17, SE = 0.03, t(134.44) = 5.81, p < .01. Likewise, the effect of worry on NA is higher in Group 1, b = 0.08, SE = 0.03, t(134.80) = 3.08, p < .01, than in Group 2, b = −0.02, SE = 0.02, t(159.90) = −0.81, p = .42.
When predicting worry at time T, both NA and worry at time T – 1 had significant cross-level interactions with the groups, suggesting that the effect of NA on worry is higher in Group 1, b = 0.20, SE = 0.03, t(131.22) = 5.90, p < .01, than in Group 2, b = 0.08, SE = 0.03, t(95.59) = 2.90, p < .01. The autoregressive effect of worry is higher in Group 1, b = 0.33, SE = 0.03, t(134.80) = 11.62, p < .00, than in Group 2, b = 0.11, SE = 0.03, t(184.99) = 3.93, p < .01. Taken together, Group 1 is characterized by a bidirectional relationship between worry and NA, whereas Group 2 has overall smaller autoregressive and cross-regressive coefficients with only a significant unidirectional effect of NA on worry.
A series of t tests (for the complete results, see Table S1 in the Supplemental Material available online) showed significant group differences in the baseline questionnaire scores as well as the mean levels of the ESM variables. Compared with the participants in Group 2, participants in Group 1 (i.e., the group characterized by the bidirectional relationship between worry and NA) had significantly higher levels of (a) worry assessed by ESM (Cohen’s d = 0.53), (b) worry assessed by the PSWQ (d = 0.39), and (c) depressive symptoms assessed by the BDI-II (d = 0.39). However, the group differences in the PTQ and STAI did not reach statistical significance (ds = 0.22, 0.24).
Discussion
In Study 1, the ALS algorithm identified two groups. Compared with Group 2, Group 1 showed higher bidirectional associations between worry and NA as well as higher levels of inertia for both worry and NA. Furthermore, Group 1 had significantly higher mean levels of worry and also exhibited higher levels of depressive symptoms than Group 2. These findings may suggest that a rigid association between NA and cognition, combined with their temporal stability, can be an important feature of depressive symptoms.
Study 2
The primary aim of Study 2 was to test the robustness of the clustering results that we found in Study 1. Specifically, we tested whether the two groups of high compared with low associations between worry and NA could be replicated in another ESM study in which we assessed momentary levels of RNT and NA eight times per day for 2 weeks. The main difference from Study 1 was that the ESM items assessed the broader transdiagnostic concept of RNT rather than the more specific, future-oriented process of worry (Ehring & Watkins, 2008; Harvey & Watkins, 2004).
Method
Participants
We analyzed the ESM data collected by Rosenkranz et al. (2020) for a different research question. The sample consisted of 150 participants between 18 and 40 years old (M = 22.46, SD = 4.01; 66.8% women) who had been recruited via posters and online announcements in Munich, Germany. The parent study was advertised as a “smartphone study” investigating rumination that occurs in everyday life. Inclusion criteria were that participants were fluent in German and that they were currently not in treatment for mental disorders. The latter criterion was applied because our ethics committee raised the concern that frequent assessments of mood and RNT in the ESM phase might affect highly vulnerable individuals and/or negatively affect the treatment they were receiving.
Responses from 30 participants were excluded from statistical analyses for the following reasons: currently in psychological treatment (n = 1), noncompletion of the ESM assessment because of technical problems and/or personal reasons (n = 9), low response rate of less than 40% to ESM signals (n = 9), and repetition of the same response on more than one item throughout the course of the ESM assessment (n = 11). Thus, the final sample size was 120 (71% women) with the mean age of 22.25 years (SD = 3.89). The study protocol was approved by the local ethics committee at the Department of Psychology at LMU Munich.
Measures
Momentary negative affect
Participants rated their momentary levels of affect using two items that assessed valence and arousal. Each item was rated on a bipolar scale. For valence, the choices ranged from 1 = discontent/bad to 7 = content/well; for arousal, the choices ranged from 1 = agitated/tense to 7 = calm/relaxed (Huffziger et al., 2012; Wilhelm & Schoebi, 2007). A previous study established good reliability of these items (Wilhelm & Schoebi, 2007).
Repetitive negative thinking
Momentary levels of RNT were assessed by four items of subjective burden, repetitiveness, intrusiveness, and difficulty disengaging from RNT. The item assessing subjective burden (“How much do you feel weighed down by these thoughts at this moment?”; Thielsch et al., 2015) was rated on a 7-point Likert scale (1 = not at all, 7 = very much). The other three items were from the PTQ, which covers the core components of dysfunctional RNT (Ehring et al., 2011): repetitiveness (“The same thoughts keep going through my mind again and again”), intrusiveness (“Thoughts come to my mind without me wanting them to”), and difficulty disengaging from negative thoughts (“I get stuck on certain issues and can’t move on”). The time frame was “at this moment” for all items (i.e., “Please indicate to what degree these statements apply to you at this moment”). These items were rated on a 7-point Likert scale (1 = not at all, 7 = very much). Both NA and RNT scales exhibited good reliability in the current data: rkf = .99 and rc = .51 for NA; rkf = .99 and rc = .84 for RNT. The original studies providing data for Studies 2 and 3 had the aim to investigate the psychometric properties of the momentary RNT measure. The EMA RNT scale was significantly correlated with trait measures of worry and RNT (i.e., PSWQ: r = .30; PTQ: r = .37); for detailed information on psychometric properties of the momentary RNT and NA measure, see Rosenkranz et al. (2020).
Baseline questionnaires
The Patient Health Questionnaire (PHQ-9; Kroenke et al., 2001) is a symptom depression checklist for a current depressive episode. Participants are asked to indicate for a total of nine items (e.g., feeling down, depressed, or hopeless) how much they were bothered by given problems in the preceding 2 weeks (response format: not at all, several days, more than half the days, nearly every day). The internal consistency was α = .78.
The seven-item Generalized Anxiety Disorder Scale (GAD-7; Spitzer et al., 2006) is a self-report questionnaire assessing symptoms of generalized anxiety disorder. Participants rate how often in the preceding 2 weeks they have felt bothered by the problems listed, from 0 (not at all) to 3 (nearly every day). Internal consistency was moderate with α = .78.
See description in Study 1 for the PSWQ (Meyer et al., 1990; Stöber, 1995). Internal consistency was good with α = .90.
See description in Study 1 for the PTQ (Ehring et al., 2011). Internal consistency was good with α = .93.
Procedure
In the first meeting, participants received an explanation of the study procedures, including how to use the ESM application on a smartphone. Participants then provided written informed consent and subsequently completed the baseline questionnaires. The ESM phase started on the day following the first appointment and lasted for 14 consecutive days. During this period, participants received eight signals per day that prompted them to complete the ESM measures. The signals were emitted with pseudorandomized intervals of approximately 2 hr. The initial signal was sent around 10 a.m. on weekdays and 12 a.m. on weekends; the last signals were scheduled around 10 p.m. on working days and 12 p.m. on weekends. After receiving each signal, participants had to start answering the ESM questions within 15 min. Reminders were sent 5 and 10 min after each signal emission unless participants had responded to the signal.
Participants received course credit or €8 per hour for face-to-face appointments and were included in a lottery for a voucher (four online-shopping vouchers worth €50 each); their chances in the lottery depended on their compliance rate in ESM.
Statistical analyses
We used the same analytic approach as in Study 1. First, we performed the ALS clustering. Second, we estimated multilevel models to test which regression coefficients significantly differed between the ALS-identified groups. Third, we examined the group differences in depressive symptoms (for a detailed description, see Study 1). Before the analyses, we standardized and person-mean centered the ESM-assessed variables. To keep the response-to-response intervals constant, we excluded responses that were made more than 200 min after the previous response.
Results
Descriptives and compliance
There were 13 participants who had a PHQ-9 score at the baseline assessment above the cutoff (≥ 10) for moderate levels of depressive symptoms (Kroenke et al., 2001). The mean compliance rate for the ESM assessment was 74% (SD = 0.21) after excluding invalid responses.
ALS clustering
First, we applied the ALS algorithm to cluster participants according to the RNT and NA dynamics. The CHull procedure indicated st ratios of 0.20, 3.51, and 1.13 for one, two, and three clusters, respectively. This replicates our findings in Study 1 that two clusters fit the data better than one or three clusters.
Second, we estimated multilevel models in which either RNT or NA at time T was predicted by (a) RNT and NA at time T – 1 and (b) their cross-level interactions with the ALS-assigned group memberships. The estimated autoregressive and cross-regressive effects for each group are presented in Figure 2.
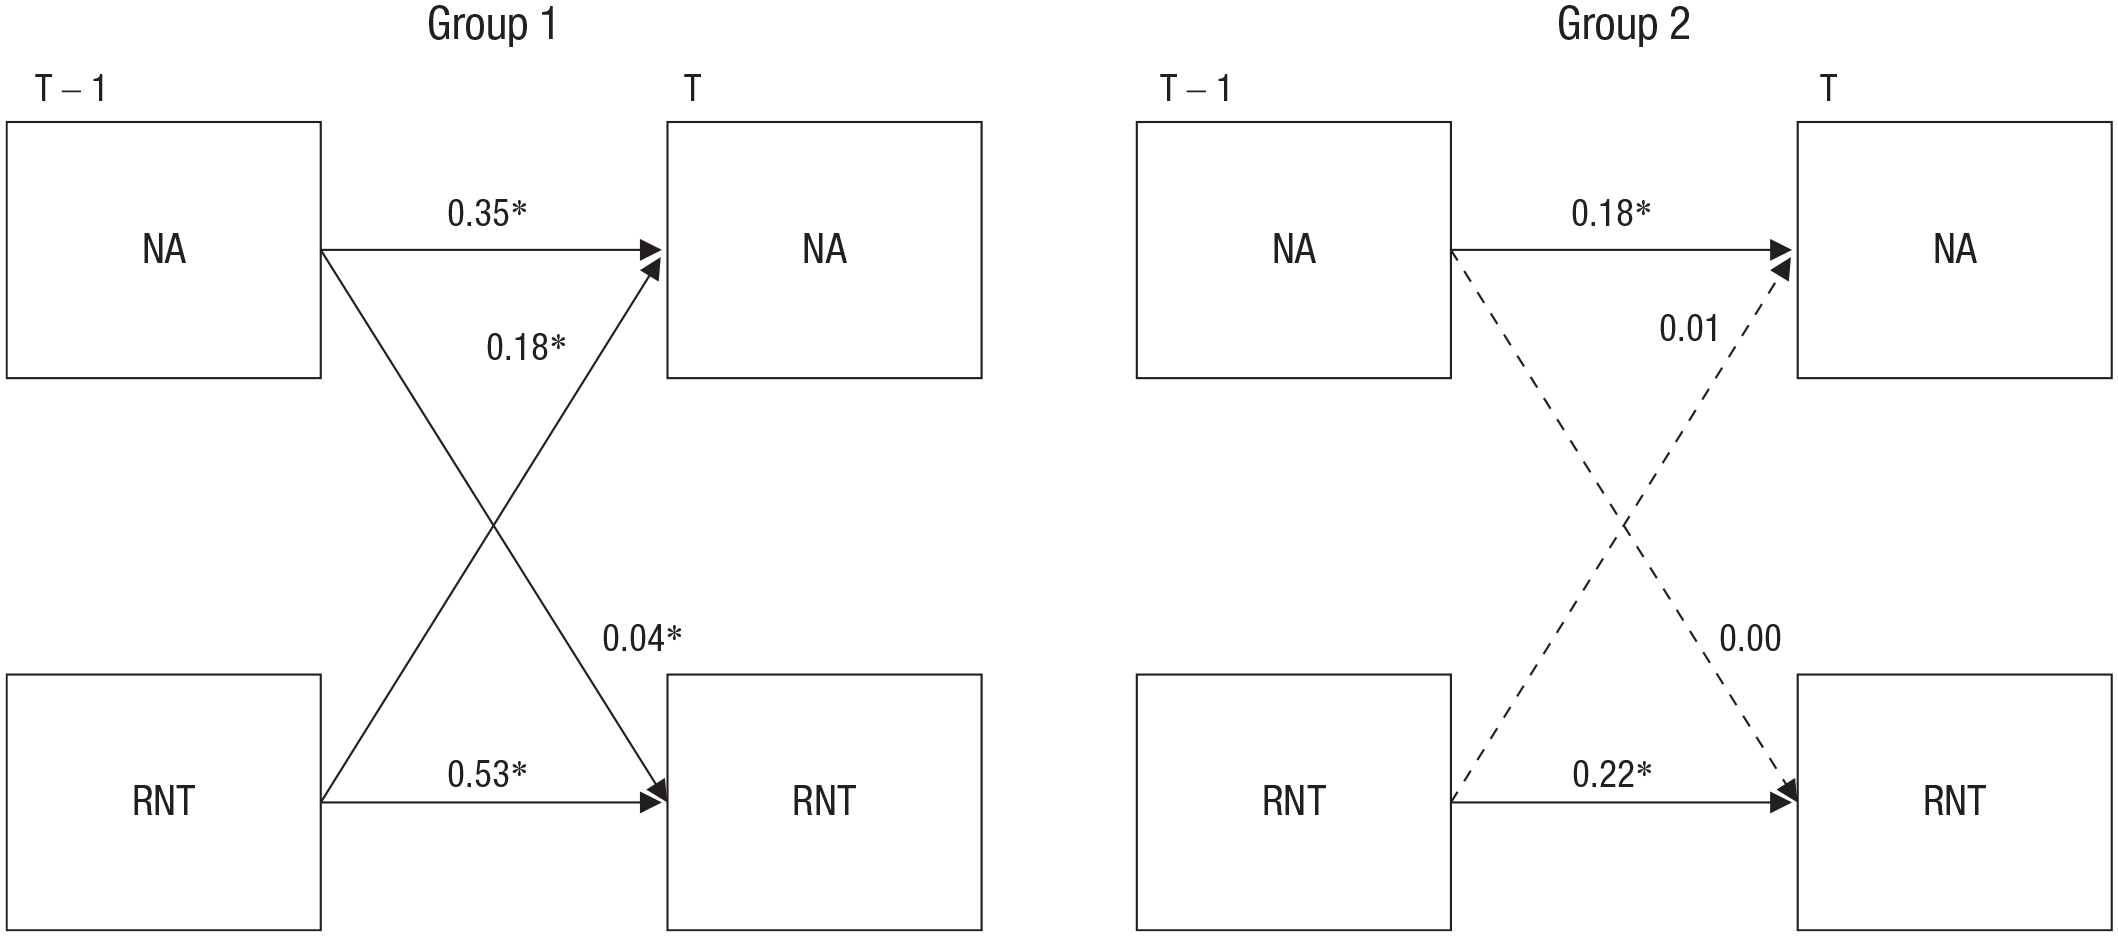
Groups identified by the alternating least squares algorithm. Group 1 (n = 87) was characterized by higher autoregressive and cross-regressive coefficients than Group 2 (n = 99; the group differences were statistically significant for all regression coefficients except for the effect of NAT–1 on RNTT). NA = negative affect; T = time; RNT = repetitive negative thinking. Asterisks indicate that the coefficient is significantly different from zero (*p < .05).
When predicting NA at time T, both NA and RNT at time T – 1 had significant cross-level interactions with the groups, suggesting that the autoregressive effect of NA is higher in Group 1, b = 0.35, SE = 0.02, t(130.03) = 16.00, p < .01, than in Group 2, b = 0.18, SE = 0.02, t(130.69) = 8.79, p < .01. The effect of RNT was also higher in Group 1, b = 0.18, SE = 0.02, t(100.92) = 7.90, p < .01, than in Group 2, b = 0.01, SE = 0.02, t(135.27) = 0.64, p = .53.
When predicting RNT at time T, only the autoregressive effect (i.e., the effect of RNT at time T – 1) showed a significant group difference, suggesting that the effect is higher in Group 1, b = 0.53, SE = 0.01, t(108.3) = 22.50, p < .01, than in Group 2, b = 0.22, SE = 0.02, t(128.3) = 9.71, p < .01. Although the interaction between NA at time T – 1 and the groups did not reach statistical significance (p = .09), the effect of NA on RNT was significant in Group 1, b = 0.04, SE = 0.01, t(103.6) = 2.34, p = .02, but not in Group 2, b = 0.00, SE = 0.02, t(102.9) = 0.00, p > .99. These results suggest that Group 1 can be characterized by the bidirectional association between RNT and NA, whereas Group 2 has overall smaller autoregressive and cross-regressive effects without significant association between NA and RNT.
Third, we tested whether the ALS groups differed in the baseline depression and other psychopathology measures (see Table S3 in the Supplemental Material). A series of t tests indicated that there were no significant group differences in the baseline questionnaires or in the person-mean levels of ESM-assessed RNT and NA (|d|s < 0.26).
Discussion
The results of the ALS clustering replicated the two-cluster findings from Study 1, highlighting Group 1 to have higher associations between RNT and NA as well as higher levels of inertia for both RNT and NA, than Group 2. However, unlike Study 1, Group 2 had no significant association between RNT and NA (note that Group 2 in Study 1 had a significant unidirectional effect of NA on worry). Another difference was that in Study 2, there were no significant group differences in depressive symptoms (or in any other psychopathology measures) at the baseline. Likewise, no group differences were identified for the person-mean levels of RNT and NA during the ESM period.
Results showed good consistency for the clustering outcomes between Studies 1 and 2, distinguishing a group with a bidirectional relationship between RNT and NA as well as high inertia from a second group with lower inertia and rigidity. However, the implications of these differences for symptoms remain unclear given that the group differences in the symptoms that we found in Study 1 were not replicated in Study 2. Although these inconsistencies could be explained by the difference in the ESM items (i.e., RNT vs. worry), a critical limitation of both studies was the lack of follow-up assessment. Note that we did not explicitly expect significant group differences in the concurrent levels of depressive symptoms and other psychopathology measures. This is because a rigid association between RNT and NA and between RNT and elevated inertia have been considered precursors of symptom changes that take place in the future (e.g., van de Leemput et al., 2014; Wichers & Groot, 2016). Therefore, a cross-sectional group difference is not a necessary condition to establish the predictive value of our clustering approach.
To this end, a test on the prospective effect of the ALS groups was warranted to ultimately determine whether the clustering approach is informative to study psychopathology. The goals of Study 3 were, first, to attempt to replicate the clustering findings from Studies 1 and 2 and, second, to extend the results from the first two studies by testing prospective associations between the ALS groups and depressive symptoms.
Study 3
We performed an ESM study in which momentary levels of RNT and NA were assessed five times per day for 10 days. We followed up participants for 3 months after the completion of the ESM assessment, which allowed for testing the prospective effect of the ALS groups on depressive symptoms. Specifically, we hypothesized that the group with a bidirectional association between RNT and NA would show higher levels of depressive symptoms at the follow-up time point compared with the group with the unidirectional (or no) association between RNT and NA.
When testing the prospective effect of the ALS groups, we were also interested in the person means of RNT and NA. Given the recent findings that a single index of affective dynamics is not a better predictor of well-being than the mere person mean of the affect (Dejonckheere et al., 2019), we controlled the effects of the person means in our prospective analysis. Furthermore, because the dynamics parameters (and the ALS groupings) seem to be overall independent of the person means of RNT and NA (Study 2; see Table S3 in the Supplemental Material), our prospective analysis also tested the interaction between the person means and ALS groups. This interaction would clarify whether people with higher mean NA and/or RNT would be more vulnerable for depressive symptoms within the bidirectional group. Such a vicious cycle has been highlighted in the theories and empirical findings of depressive rumination (e.g., Moberly & Watkins, 2008; i.e., RNT and NA influence each other, escalating into and self-maintaining a very high, pathological level). Thus, we expected that the group with highly rigid and inert dynamics of RNT and NA would be most vulnerable for depressive symptoms when combined with elevated mean levels.
Method
Participants
We analyzed part of some unpublished ESM data. In this study, 220 participants ages 18 to 35 years (M = 21.34, SD = 3.50; 76% women) were recruited via posters and online announcements. In these advertisements, participants were informed that the aims of the study were to assess rumination and worry in daily life and to test whether these negative thinking styles would predict depressed mood and anxiety at a future time point. Inclusion criteria were (a) being a native German speaker, (b) being enrolled as a student at a university, (c) being between 18 and 35 years old, and (d) not currently suffering from any mental disorders (see also the Participants section of Study 2). Despite these inclusion criteria, two participants indicated that they suffered from a mental disorder at the baseline assessment; these participants were not invited to the ESM phase. For statistical analyses, we excluded data from participants who had low compliance with the ESM assessment: participants who had a response rate of less than 60% (n = 10) 2 and repeated the same response to more than one item throughout the ESM assessment (n = 22). The final sample consisted of 186 participants (age: M = 21.18 years, SD = 3.34; 76% women). The study protocol was approved by the local ethics committee of the Department of Psychology at LMU Munich.
Measures
The same measures as in Study 2 were used in the current study. The baseline assessment and follow-up included the PHQ-9 (α = .72), GAD-7 (α = .81), PSWQ (α = .90), and PTQ (α = .94). In the ESM assessment, RNT was measured by the same four items of subjective burden, repetitiveness, intrusiveness, and difficulty disengaging from RNT, with only slight differences in phrasing. Both NA and RNT scales exhibited good reliability in the current data: rkf = .98 and rc = .60 for NA; rkf = .99 and rc = .90 for RNT (Shrout & Lane, 2012).
Procedure
Data were collected in the following three phases: (a) baseline assessment at the start of a semester (teaching term), (b) ESM immediately following baseline assessment, and (c) follow-up assessment, during an exam period that was approximately 3 months after the baseline assessment. We scheduled the follow-up in this way because one of the aims of the overarching study was to examine the effect of increased stress for students (exam) on relationship between rumination and NA. During the first appointment, participants received an explanation of the study procedures and provided written informed consent. They then completed the baseline questionnaires and received an introduction to how to use the ESM application on a smartphone. The ESM period started on the day after the baseline assessment and continued for 10 consecutive days. During this ESM phase, participants received five signals per day, prompting them to fill in brief questionnaires for RNT and NA. The initial signal of a day was sent around 9 a.m., 10 a.m., or 11 a.m., depending on each participant’s preference. The rest of the signals were emitted with pseudorandomized intervals of approximately 2 hr over a 10-hr time window. Participants had to answer questions about their current levels of affect and RNT and the occurrence of a negative event since the previous signal. Participants received three reminders (i.e., 5, 10, and 20 min) after the first notification if they had not answered the question and had 30 min to answer. The follow-up assessment was conducted online at the end of the same semester (i.e., around 3 months after the baseline assessment) and took place during the exam period. The same questionnaires used during the baseline were repeated. Participants received €8 per hour or course credit for baseline and follow-up assessments. In addition, they also had a chance to win extra Amazon vouchers (four vouchers worth €50 each) in the lottery; their chances of winning depended on their compliance rate in ESM.
Statistical analyses
We used the same overall statistical approach as in Studies 1 and 2. We first applied the ALS algorithm to identify groups according to RNT and NA dynamics. Second, we estimated multilevel models to establish the group differences in the autoregressive and cross-regressive coefficients. Third, group differences in baseline depressive symptoms were explored. Before the analyses, all ESM-assessed variables were standardized and person-mean centered. We excluded responses that were made more than 4 hr after the previous response to keep the response-to-response intervals constant.
To test the prospective effect of the ALS groups, we estimated regression models in which follow-up depressive symptoms were predicted by (a) the baseline symptoms, (b) person means of RNT and NA over the ESM course, (c) the dummy-coded group memberships given by the ALS algorithm, and (d) the interactions between the person means and ALS groups.
Results
Descriptives and compliance
Twenty-nine participants had a PHQ-9 score equal or greater than the cutoff (≥ 10) for moderate levels of depressive symptoms at the baseline assessment; at the follow-up, 64 participants scored equal or greater than the cutoff (Kroenke et al., 2001). The mean compliance rate for the ESM assessment was 87% (SD = 13).
ALS clustering
The CHull procedure indicated st ratios of 0.09, 2.47, and 1.69 for one, two, and three clusters, respectively. This replicates the findings from Studies 1 and 2 that two clusters fit the data better than one or the other number of clusters. We estimated multilevel models in which either RNT or NA at time T was predicted by (a) RNT and NA at time T – 1 and (b) their cross-level interactions with the ALS groups. Figure 3 represents the estimated autoregressive and cross-regressive effects for each group.

Groups identified by the alternating least squares algorithm. Group 1 (n = 87) was characterized by higher autoregressive and cross-regressive coefficients than Group 2 (n = 99; the group differences were statistically significant for all regression coefficients except for the effect of negative affect [NA] on repetitive negative thinking [RNT]). T = time. Asterisks indicate that the coefficient is significantly different from zero (*p < .05).
In predicting NA at time T, both NA and RNT at time T – 1 had significant interactions with the groups, suggesting that the autoregressive effect of NA is higher in Group 1, b = 0.36, SE = 0.02, t(272.77) = 15.73, p < .01, than in Group 2, b = 0.16, SE = 0.02, t(328.2) = 7.01, p < .01. The effect of RNT is higher in Group 1, b = 0.14, SE = 0.02, t(4388.52) = 5.99, p < .01, than in Group 2, b = −0.02, SE = 0.02, t(5.31) = −0.74, p = .46.
When predicting RNT at time T, only RNT (but not NA) at time T – 1 showed a significant interaction with the groups, suggesting that the autoregressive effect of RNT is higher in Group 1, b = 0.48, SE = 0.02, t(180) = 20.87, p < .01, than in Group 2, b = 0.10, SE = 0.02, t(274.3) = 4.11, p < .01. The effect of NA on RNT did not significantly differ between the two groups: Group 1, b = 0.07, SE = 0.02, t(220.3) = 3.87, p < .01; Group 2, b = 0.03, SE = 0.02, t(268.3) = 2.01, p = .04. These results suggest that Group 1 is characterized by the bidirectional association between NA and RNT, whereas Group 2 has overall smaller autoregressive and cross-regressive effects with a statistically significant unidirectional effect of NA on RNT. In addition, we tested whether the ALS groups differ in the levels of depressive symptoms at the baseline assessment (see Table S5 in the Supplemental Material). A series of t tests showed that there were no significant differences between the two groups either in the questionnaire scores or in the person means of RNT and NA (|d|s < 0.26).
Prospective analysis
To test the prospective effect of the ALS groups, we estimated a regression model with the follow-up depressive symptoms as the outcome and with the person mean of NA, the ALS groups, and their interaction as the predictors. Here we controlled for the baseline levels of depressive symptoms. The person mean of RNT was not included in the model because it had a moderate to high correlation with the person mean of NA and could cause multicollinearity. The ALS groups were dummy coded as 0 for Group 1 and 1 for Group 2. The results suggested that (a) both the baseline symptoms, b = 0.54, SE = 0.09, t(175) = 6.24, p < .01, and the person mean of NA, b = 1.58, SE = 0.47, t(175) = 3.38, p < .01, were significant predictors; (b) the ALS groups had a nonsignificant main effect, b = −0.14, SE = 0.58, t(175) = −0.24, p = 0.81; (c) but the ALS groups had a significant interaction with the person mean of NA, b = −1.87, SE = 0.59, t(175) = −3.18, p < .01. To explore this significant interaction (see Fig. 4), we tested the conditional effect of the person mean of NA for each group (post hoc simple slope tests: Aiken & West, 1991). The person mean of NA had a higher effect on follow-up depressive symptoms for Group 1, b = 1.58, SE = 0.47, t(175) = 3.38, p < .01, than for Group 2, b = −0.29, SE = 0.38, t(175) = −0.78, p = .43. This prospective interaction appears to be unique for depressive symptoms given that we found no such effect on the other measures (i.e., GAD, PSWQ, and PTQ; ps > .05).
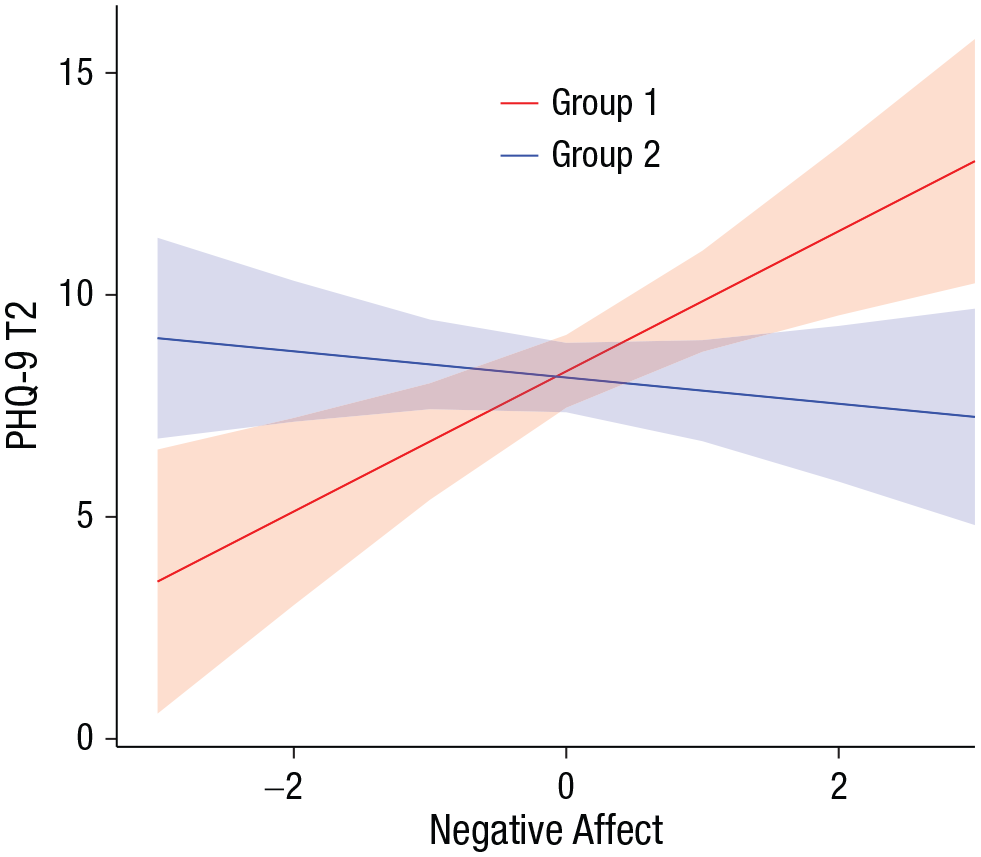
Depressive symptoms at the 3-month follow-up (Patient Health Questionnaire [PHQ-9], Time 2 [T2]) predicted by the person mean of negative affect assessed by the experience-sampling method (ESM). Members of Group 1 (characterized by a bidirectional relationship between repetitive negative thinking and negative affect) experienced higher levels of depressive symptoms if they had higher mean levels of negative affect during the ESM phase. The baseline levels of depressive symptoms were controlled. Shaded areas represent 95% confidence intervals.
Discussion
The results of the ALS clustering replicated the findings of Studies 1 and 2, highlighting the robustness of the two-cluster solution. The clustering identified a consistent pattern of the groupings: Group 1, characterized by a bidirectional relationship between RNT and NA and by increased inertia for both RNT and NA, and Group 2, which had smaller autoregressive and cross-regressive coefficients with only a significant unidirectional effect of NA on RNT (which is more consistent with the results of Study 1 than Study 2). The specific focus of Study 3 was on the prospective effect of the groups on depressive symptoms. We found that the ALS groups are interacted with the person mean of NA to predict the follow-up levels of depressive symptoms—that is, people who have more rigid and inert dynamics in RNT and NA (so belong to Group 1) and are experiencing higher levels of NA are more likely to develop depressive symptoms at the 3-month follow-up. However, we found no significant group differences in the concurrent (or baseline) levels of psychopathology, which replicates the results of Study 2 but is at odds with Study 1. The ALS clustering therefore may not be informative to investigate the current symptoms but may hold a predictive value for future depressive symptoms.
General Discussion
The aim of the current study was to cluster individuals according to the within-persons association between RNT and NA (i.e., cross-regressive effects) and participants’ inertia (i.e., autoregressive effects), which can be captured by ESM. Results of the clustering were replicated across the three studies, showing that typically two groups emerge in nonclinical samples regardless of the differences in the used items and ESM setups. The most consistent finding was that across the three studies, one group was characterized by high levels of inertia and a strong bidirectional association between persistent cognition (RNT or worry) and NA.
Previous ESM studies have shown that RNT and NA generally influence each other (e.g., Moberly & Watkins, 2008) and that the strength of this RNT-NA association is related to depressive symptoms (Brose et al., 2015). The literature also suggests that emotional inertia is a good predictor of depressive symptoms, as demonstrated in both cross-sectional and prospective studies (Koval et al., 2012; Kuppens et al., 2012).
Our results extend these findings by showing that in the student and general populations, there are systematic and possibly meaningful individual differences in the strength of the RNT-NA associations and inertia. Note that a strong bidirectional association between RNT and NA is present together with elevated inertia for both RNT and NA in the same group of individuals (see rigid responders; Bulteel et al., 2016). These individuals may easily get stuck in a spiral of NA and cognition (Koval et al., 2012) because the bidirectionality represents a self-sustaining loop of RNT triggering NA and vice versa; in addition, high inertia means that RNT and NA tend to persist over time. Furthermore, our prospective analysis (in Study 3) revealed that the mean levels of NA that individuals experienced during the ESM phase are another important dimension, interacting with the ALS groups to predict depressive symptoms at the follow-up assessment. This significant interaction may suggest that the triad of high rigidity, high inertia, and high mean levels of negative cognition and affect are key to understanding the psychological etiology of depression.
The current study had an exclusive focus on the within-persons dynamics of RNT and NA, which were expected to predict future depressive symptoms, among nonclinical general and student populations. Although the results provide preliminary evidence for the predictive values of the RNT-NA dynamics (which may be useful to identify individuals at risk of developing depressive symptoms), caution should be used when generalizing our findings to clinical levels of depression. However, given the continuity between clinical and nonclinical symptoms, we expect that the dynamics parameters would similarly predict the recurrence of depression in remitted patients and the maintenance of depressive symptoms in currently depressed individuals. Indeed, previous ESM studies have suggested that worry becomes more strongly associated with positive affect and NA as a sudden shift in depressive symptoms (or the moment of relapse) approaches (van de Leemput et al., 2014; Wichers, 2014; Wichers et al., 2019). Another study on patients with a history of unipolar depression showed that ruminative inertia is positively associated with current levels of depressive symptoms and is negatively associated with the number of past depressive episodes (Bean et al., 2020). However, a direct replication on a clinical sample would still be warranted to establish the clinical relevance of our findings.
The three studies provided somewhat inconsistent results for the concurrent levels of depressive symptoms and other psychopathology variables. In Study 1, the ALS groups significantly differed in depressive symptoms and worry. However, these cross-sectional associations were not replicated in Studies 2 or 3. As noted earlier, we do not regard these inconsistent findings as counterevidence for the predictive value of the ALS clusters. Instead, we speculate that individuals may exhibit high rigidity and high inertia without any depressive symptoms at a given time point but that they are more likely to experience increased levels of depressive symptoms at a later time point than individuals with low rigidity and inertia. Nevertheless, it is of interest to discuss possible reasons for the inconsistent findings, which may be due to methodological differences between studies. First, the time intervals between ESM signals were not identical across studies (Study 3 used a longer interval than the other two studies). This could have influenced the estimates of RNT-NA associations and inertia given that a longer time interval typically results in a lower autoregressive (inertia) effect, which directly or indirectly affects the magnitude of the cross-regressive effects (Cole & Maxwell, 2003). There is no uniform solution to determine the optimal time window between ESM signals, and a more systematic investigation is required to find the exact interval with which RNT-NA association becomes the strongest. Second, persistent cognition was operationalized differently across studies. In Study 1, we specifically focused on worry, whereas Studies 2 and 3 used the transdiagnostic construct of RNT. The RNT measure was designed to capture the repetitiveness and persistency of negative thinking as a process. Therefore, the items do not tap into the content of thinking. Because worry is characterized as future-oriented thinking, it is essential to specify the temporal orientation of the thought content to assess worry. In future studies, it would be informative to directly compare the results for worry measures and RNT measures, which may help to clarify whether differences in cross-sectional findings across studies were related to differences in conceptualizations of RNT.
Several limitations are noteworthy when interpreting our findings. First, we tested nonclinical samples, and most of them were female university students, which may question the generalizability of our findings. Replication in a wider range of samples (e.g., for the severity of symptoms, gender, and age) is warranted. Nevertheless, recent studies showed that 32% of graduate students are at risk of having or developing a common psychiatric disorder, especially depression (Levecque et al., 2017); therefore, we believe that studying a student or young population is of high clinical relevance. In addition, we did not collect information about ethnic identification. Second, it is known that the ALS algorithm is not sensitive to small group differences; in other words, it is still possible that there are unidentified groups or subgroups (Takano et al., 2021). Unlike Gaussian mixture models, the clustering technique used here (i.e., ALS algorithm) does not assume normality on each regression coefficient estimated through VAR models. However, this does not immediately mean that the algorithm is robust for data with outliers. We performed computer simulations to evaluate the accuracy of the ALS algorithm to identify the number of clusters and the cluster allocation of each participant. A typical error of the algorithm was that it overlooked a third cluster when data have three clusters. Given this conservative nature of the algorithm, it is more likely to overlook a potential cluster than to overextract a meaningless cluster (Takano et al., 2021).
Third, we specifically applied the clustering analysis on the bivariate relationship between RNT and NA, which can be, of course, expanded into a greater number of variables (Bulteel et al., 2016). Such multivariate associations are sometimes understood as a complex psychological network (Epskamp et al., 2016; Pe et al., 2014). Given the recent progress in network psychometrics (Fried, 2020), applying the ALS clustering to a more comprehensive set of cognitive and affective variables would be an interesting direction for future research. In addition, future studies should examine relation between RNT and positive affect to test the specificity of the association between RNT and NA. Fourth, we did not have an opportunity to replicate the prospective effect that we found in Study 3. Although this result is quite consistent with the central theories of rumination and depression, a direct or conceptual replication is still appropriate.
Despite these limitations, the current study shows that clustering individuals according to the dynamics in RNT and NA leads to a stable and replicable identification of a group exhibiting high inertia and high rigidity in the association between RNT and NA. Although more research is needed to conclude whether clustering individuals in this way helps identify individuals at risk for psychopathology, this clustering approach has a large potential to identify people who would benefit from preventive intervention targeting the pathological affective and cognitive dynamics.
Supplemental Material
sj-pdf-1-cpx-10.1177_21677026211009495 – Supplemental material for Is a High Association Between Repetitive Negative Thinking and Negative Affect Predictive of Depressive Symptoms? A Clustering Approach for Experience-Sampling Data
Supplemental material, sj-pdf-1-cpx-10.1177_21677026211009495 for Is a High Association Between Repetitive Negative Thinking and Negative Affect Predictive of Depressive Symptoms? A Clustering Approach for Experience-Sampling Data by Mina Stefanovic, Tabea Rosenkranz, Thomas Ehring, Edward R. Watkins and Keisuke Takano in Clinical Psychological Science
Footnotes
Acknowledgements
We thank Sarah Hügel and Claudia Lang for their assistance in data collection for Study 1 and Charlotte Ebrecht, Anika (Maria) Schiller, and Lilly Hermannstaller for their assistance in data collection for Studies 2 and 3.
Transparency
Action Editor: Christopher G. Beevers
Editor: Kenneth J. Sher
Author Contributions
T. Ehring developed the study concept and design for Study 1, and T. Ehring, T. Rosenkranz, and E. R. Watkins developed the study concept and design for Studies 2 and 3. Data collection for Studies 2 and 3 was performed by T. Rosenkranz. K. Takano and M. Stefanovic performed the data analysis and interpretation. M. Stefanovic drafted the manuscript, and K. Takano, T. Ehring, E. R. Watkins, and T. Rosenkranz provided critical revisions. All authors approved the final version of the manuscript for submission.
Notes
References
Supplementary Material
Please find the following supplemental material available below.
For Open Access articles published under a Creative Commons License, all supplemental material carries the same license as the article it is associated with.
For non-Open Access articles published, all supplemental material carries a non-exclusive license, and permission requests for re-use of supplemental material or any part of supplemental material shall be sent directly to the copyright owner as specified in the copyright notice associated with the article.