
Abstract
The March 2011 Great East Japan Earthquake, tsunami, and nuclear leak were complex traumas. We examined psychological distress in the years following the earthquake using growth mixture modeling to classify responses from 2,599 linked respondents (2012–2016). We identified four classes of trajectories following the disaster: resilient (76% of respondents), delayed distress (8%), recovery (8%), and chronic distress (7%). Compared with the resilient class, other class members were less likely to be female and had less social support. Survivors in the recovery group were more likely to live in prefabricated housing. Although distress has decreased over time, specific populations continue to require targeted intervention.
The Great East Japan Earthquake (GEJE) off the coast of Miyagi Prefecture on March 11, 2011, was accompanied by a Level 7 nuclear accident. With more than 18,000 fatalities, the disaster led to the migration of a third of a million people. These events occurred in a deprived region already affected by high suicide rates and with limited health resources. A number of studies have illustrated the negative impact of seismic events on psychological well-being (Fergusson, Horwood, Boden, & Mulder, 2014). However, sustained, large-scale longitudinal research on the impact of such events is still rare.
A 5-year study of 224 participants following an earthquake in Niigata Prefecture, Japan, reported a significant decrease in psychological distress in each of the first 4 years after the disaster (Nakamura, Kitamura, & Someya, 2014). In Fukushima following the GEJE, both posttraumatic stress disorder (PTSD) and general psychological distress declined in each of the 3 years after the disaster (Oe et al., 2017). Responses to trauma, however, are likely to be heterogeneous across affected populations, and several studies have identified different trajectories of distress following major disasters. The most common of these groupings are resilience (stable and healthy adjustment), delayed dysfunction (in which distress worsens over time), recovery (elevated symptoms returning to normal functioning), and chronic elevation of symptoms (persistence of impairment; Bonanno, Westphal, & Mancini, 2011; Galatzer-Levy, Huang, & Bonanno, 2018; Johannesson, Arinell, & Arnberg, 2015). Demographic factors, preexisting susceptibilities, and postdisaster experiences all have effects on these trajectories (Bonanno et al., 2011). Women typically report greater psychological distress following natural disasters (Nakamura et al., 2014). A history of psychological disorder is associated with increased risk of psychological distress after a disaster (Suzuki et al., 2015). Place of residence influences likely exposure to disaster as well as the availability of community resources. Poorer conditions involving temporary housing also increase risk of depression or anxiety (Johannesson et al., 2015), although it is uncertain whether this persists over time (Sasaki et al., 2017). Emotional support from families, friends, and relatives is positively associated with resilience (Johannesson et al., 2015). Finally, age has shown mixed associations with psychological distress among earthquake survivors. Some studies have found older people to be more vulnerable (Oe et al., 2017), whereas other studies have found that previous exposure to disaster made this population more resilient (Cherniack, 2008).
In this article, we map predictors and trajectories of distress from residents of the three prefectures most affected by the GEJE (Miyagi, Iwate, and Fukushima). We consider data from 2,599 respondents linked across yearly surveys from 2012 to 2016. We use this to address three questions:
How did levels of psychological distress change in the 6 years following the GEJE?
What were the major trajectories of distress over this period?
To what extent are the above covariates associated with these distress trajectories over these 5 years?
Method
We report a prospective cohort study examining psychological distress across multiple waves. Data were collected by Miyagi Prefecture, which recorded the largest number of deaths from the disasters. Survivors whose housing was damaged by the earthquake/tsunami were provided temporary housing largely financed by the prefecture. This was randomly allocated and grouped into two types of temporary housing—privately rented homes (in 35 municipalities) or prefabricated housing (in 10 municipalities).
Data were collected by the Miyagi Prefecture using methodology standard throughout Japan for survey collection. The prefecture annually distributed self-report questionnaires to both individuals living in private residences and those in prefabricated housing beginning in September 2012. People who chose to participate returned their questionnaires by mail or directly to administrative officers. Participants were not rewarded for their responses. Family-based response rate ranged from 50% to 70% over the six waves. Table S1 in the Supplemental Material available online shows the number of families contacted, response rates, and final number of surveys in each wave. Figures S1 and S2 in the Supplemental Material indicate data retention. We were unfortunately unable to follow up with individuals who moved away from their registered temporary housings. The study profile for Waves 1 and 2 has been described elsewhere (Goodwin, Takahashi, Sun, & Ben-Ezra, 2015; Kusama et al., 2019; Matsuyama et al., 2016).
The prefecture allocated data linkage codes to respondents by name, date of birth, gender, and address at the time of disaster, which allowed individuals to be identified across waves. Following linkage, the prefecture deleted personal information to form an anonymized data set, which provided the research team with a subset of linked respondents for further analysis. In this article, we focus on trajectories of distress over time. To do this, we analyzed respondents from those 5 years for which full annual data were available (2012–2016; N = 2,599).
All procedures contributing to this work comply with the ethical standards of the relevant national and institutional committees on human experimentation and with the Helsinki Declaration of 1975, as revised in 2008. Ethical approval was obtained from the prefecture and from the relevant ethics committees of Tohoku and Warwick Universities (Ref. No. 70/17-18).
Measures
Measures were selected on the basis of previous work on psychological distress and were analogous to those employed by Japanese prefectures following earthquakes in Kobe and Niigata Provinces (e.g., Nakamura et al., 2014).
Demographic variables and support
All participants provided their sex, age (subsequently divided into quintiles), prefecture of residence at the time of the earthquake, and housing type (private or prefabricated). Respondents also indicated past history of psychiatric illness and whether they had someone to listen to their concerns (“yes”/“no”).
Outcomes
All participants completed a Japanese version of the six-item Kessler Psychological Distress Scale (K6; Kessler et al., 2002), intended to detect nonspecific psychological distress. Scores range from 0 to 24 (maximum distress; α = .91 in current cohort data). Scores from 8 to 12 indicate probable mild to moderate mental illness (MMI), and scores from 13 to 24 indicate severe mental illness (SMI).
Statistics
We report findings for all respondents age 18 years and older who completed all five waves. To examine trajectories over time in our linked data, we use latent growth mixture modeling (MPlus Version 6, Muthén & Muthén, 2010). We adopted a step-by-step approach, employing a single-group model as the baseline before comparing to more sophisticated models, using model fit statistics (Akaike information criterion, Bayesian information criterion, adjusted Bayesian information criterion, likelihood ratio test, Lo-Mendell-Rubin and bootstrapped likelihood ratio tests, and entropy criteria). This allowed us to judge number of subgroups/classes without imposing a priori limitations on number or definition of trajectories or a linear/nonlinear trajectory shape (Bonanno et al., 2011). We tested for cubic trajectories in both our unconditional and conditional models, taking into account missing data by using the full information maximum likelihood estimation. Multinomial regression, t tests, and analysis of variance (IBM SPSS Version 23) were then used to examine predictors of class membership, using the resilient class as reference group. Here, we use the covariates listed previously with the exception of original prefecture (only a small number of respondents in our linked data lived outside Miyagi at the time of the earthquake).
Results
Baseline characteristics and attrition
Table S2 in the Supplemental Material reports baseline characteristics for respondents: 53.9% of respondents were women, 97.5% originally resided in Miyagi prefecture, 73.3% had a supporter, and 97.8% had no psychiatric disease history. Respondents ranged in age from 18 to 97 years at the start of our data collection, with a mean age of 54.63 years (SD = 15.92). Figure S3 provides psychological distress over time. We report prevalence of MMI and SMI (see Table S3) and compare individuals who completed all waves of the survey with those who participated in a specific wave (see Table S4). There were no significant differences between linked respondents who completed all waves and who respondents completing only a given wave.
Growth mixture modeling
Compared with a three-class solution, the likelihood ratio test (LRT) for a four-class solution was statistically significant (p < .0001). Compared with the LRT for a four-class solution, the LRT for a five-class solution was not significant (p = .10), suggesting no substantial improvement in fit. Other fit indices (e.g., bootstrap LRT) favored a four-class solution; the sample means closely approximated the estimated means. Entropy was .85; estimated posterior probabilities for the groups ranged from .82 to .95 (see Tables S5 and S6 in the Supplemental Material).
We modeled trajectories using two methods: (a) using only K6 data (the simple model) and (b) including covariate data to aid class alignment (conditional model). Both analyses led to the same number of classes (four), which were adequately explained by linear trajectories (see Table S5 in the Supplemental Material; fit and class proportions are in Table S6). As a result, we discuss findings for only the conditional model. Further results for the simple model are available from R. Goodwin.
The four trajectory groups (classes) are illustrated in Figure 1. Resilient respondents (76.3% of the total sample) demonstrated stable levels of low distress throughout the waves (with an intercept score of 3.2 decreasing slightly over time: slope = −0.12). Only 0.2% of this group could be classified as being at risk of SMI in 2012. Rates did not exceed 1% in any wave. Class 2 (delayed distress, 8.1% of respondents overall) showed low distress at Wave 1 but a significant increase in distress over time (slope = 1.41). For this group, SMI risk rose from 3.3% (in 2012) to 34.5% (in 2016). Class 3 (chronic distress, 7.1% of respondents) exhibited consistently high levels of distress (intercept = 14.44, with only a small decrease in slope over time, −0.43). Risk of SMI was high in both 2012 (62.5%) and 2016 (44.9%). Finally, after high initial distress (intercept = 15.25), Group 4 (recovery, 8.4% of respondents) showed consistent improvement (slope = −2.13): Risk of SMI dropped from 55.4% (2012) to 0.6% (2016). More detailed scores for potential moderate or severe mental illness by group over time are shown in Table S7 in the Supplemental Material.
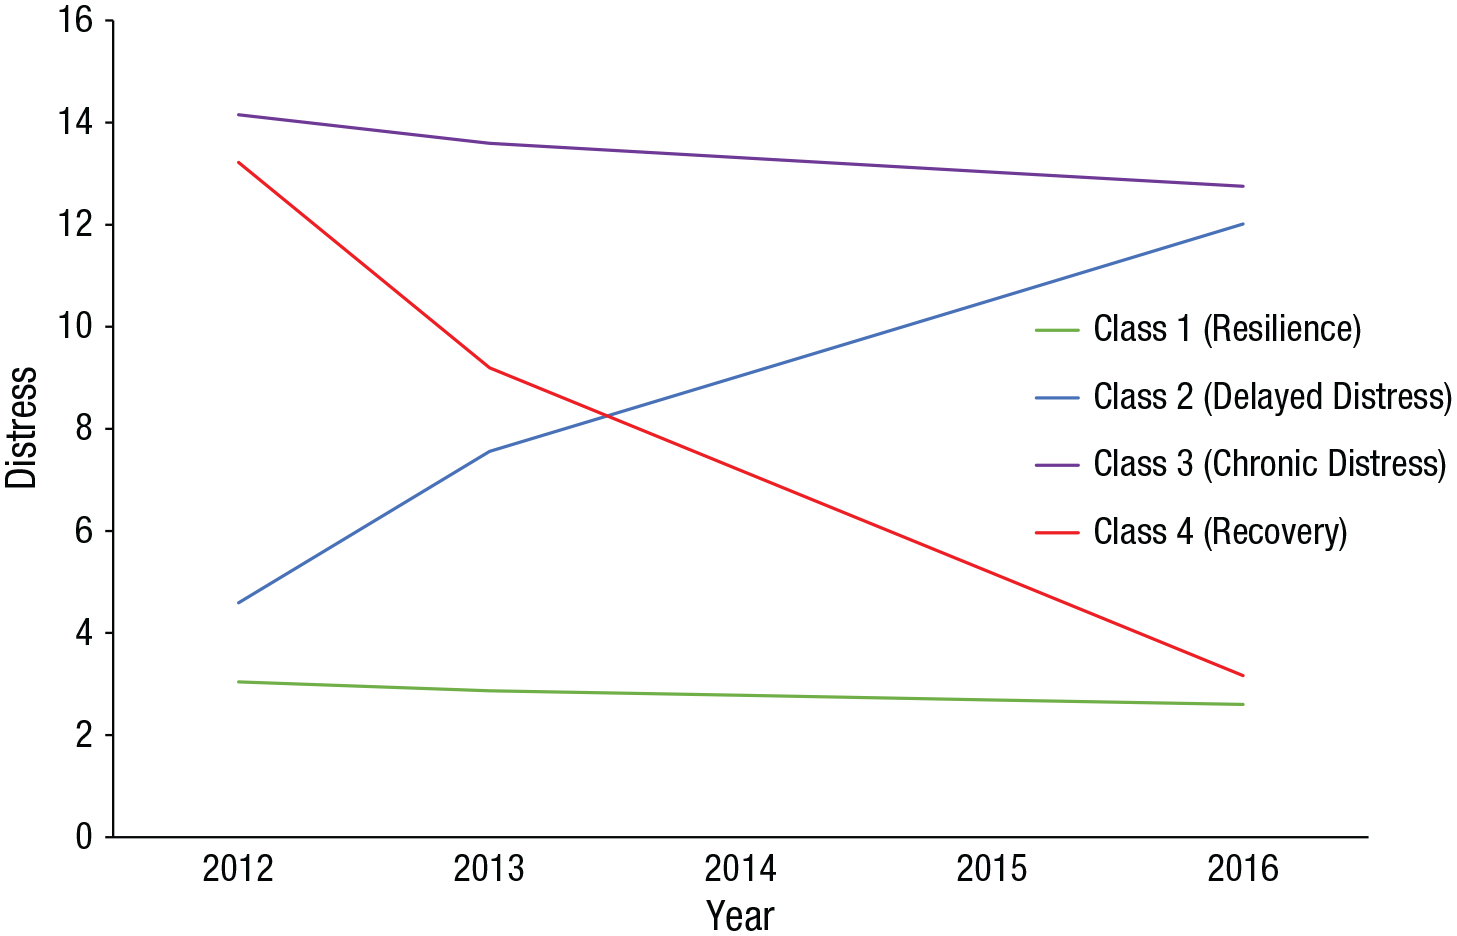
Results of growth mixture model for psychological distress (Kessler Psychological Distress Scale) with covariates, based on estimated means. Distress is graphed as a function of time. Class proportions: Class 1 (resilience), 76%; Class 2, (delayed distress), 8%; Class 3 (chronic distress), 7%; Class 4 (recovery), 8%.
We then profiled trajectories using multinomial logistic regressions (Table S8 in the Supplemental Material). Compared with the reference group (resilient trajectory), other groups were more likely to include female respondents (52% of resilient survivors were women, and Classes 2, 3, and 4 were 57%, 61%, and 64% women, respectively) and less likely to report receiving support. Participants in the chronic distress and recovery groups were also both more likely to report a psychiatric history before the earthquake (9% of group members reported this, compared with just 1% of individuals in the resilient or delayed-distress classes). Compared with the reference resilient sample, individuals in the recovery group were more likely to live in prefabricated accommodation. Age effects were small across the groups.
Discussion
Complex disasters, such as the major earthquake, tsunami, and nuclear leak in Japan in 2011, can have a severe impact on psychological health (Cherniack, 2008). In this article, we report a rare longitudinal prospective panel study of psychological distress up to 6 years after these events. As in previous work on both seismic events (Nakamura et al., 2014) and related disasters (Wickrama & Ketring, 2012), there was a decrease in psychological distress over time. Growth linear mixture modeling suggested four trajectories of distress, affirming, across five waves, groups reported over shorter periods (Galatzer-Levy et al., 2018). Although more than three quarters (76%) of respondents showed resilience, the remaining respondents demonstrated delayed distress, recovery, or chronic distress at roughly equal levels over time. These trajectories were associated with both preexisting vulnerabilities and posttrauma housing conditions and support.
Average (mean) levels of psychological distress were generally low throughout our data. Eighty-four percent of our respondents reported positive trajectories (resilience or recovery), and, as reported elsewhere (Bonanno et al., 2011; Bryant et al., 2015; Galatzer-Levy et al., 2018; Johannesson et al., 2015), resilience was the most common response. This may reflect the high levels of resilience in the Japanese population in general, often associated with the concept of shouganai (“it cannot be helped”). As elsewhere, respondents who recovered usually did so within 2 years after the stressful event (Bonanno et al., 2011; the recovery group risk of several mental illness more than halved between 2012 and 2013). One reason for this recovery may lie in the higher proportion of prefabricated-housing residents within this group. Although cross-sectional data showed that prefabricated housing, with its greater noise and extreme temperatures, is a risk factor for psychological well-being (Sasaki et al., 2017), the close proximity of these prefabricated homes also means it was easier for individuals in these dwellings to obtain municipal and voluntary support (Kusama et al., 2019; Murakami et al., 2017). This support can be a major bulwark against distress (Johannesson et al., 2015). Additional logistic regressions (Table S9 in the Supplemental Material) demonstrated the association between the presence of a supporter at first time of survey completion and psychological well-being in the subsequent 3 years.
However, for the minority of survivors who fail to recover, there may be a sustained risk of trauma (Bui et al., 2010). The negative impact of prior psychiatric disorders on psychological well-being was demonstrated by the higher proportion of individuals with prior (before the earthquake) diagnoses in the chronic and recovery trajectories. Previous psychiatric diagnosis was also related to increased exposure to risk following an earthquake in New Zealand (Fergusson et al., 2014). Sex effects were as anticipated, with greater distress among female respondents and fewer women in the stable resilient trajectory.
Strengths and weaknesses
Our study had several strengths. Previous studies on psychological distress following seismic events have been largely cross-sectional (risking conflating trajectories; Galatzer-Levy et al., 2018) and primarily have been conducted in Western settings. We used latent growth mixture models to consider trajectories of distress over a period of 5 years. We provide novel insights into the input of housing over a protracted time period. Survival analyses show we maintained participants with comparable levels of distress to those who did not complete all survey waves. At the same time, we recognize a number of limitations. We lacked several additional socioeconomic details, such as income and education level. We had more participants than families, running the risk of nonindependence of participants in our analyses. However, because very few members of the same family participated throughout the five waves (with only one or two family members linked in 78% of families), we were not able to meaningfully conduct multilevel analysis clustering by family and linked participants by their individual identification numbers rather than families. Future studies could make particular efforts to include participation by family in order to conduct analyses at this additional level. We were unable to determine additional measures of personal exposure or additional stressors, including the need to provide medicinal aid to others.
More extensive information on a range of individual variations before an event would have been valuable (Galatzer-Levy et al., 2018). Location at the time of an earthquake may also be significant but could not be formally assessed in our models because few respondents lived outside Miyagi. Victims of atomic events can suffer long-lasting anxieties that threaten their identity (Ben-Ezra et al., 2015). Fukushima refugees suffered serious disruption to their social networks, often involving the separation of spouses and children. High rates of distress in Fukushima have been reported elsewhere, reflecting public stigma toward those living in the prefecture as well as family dissension around the decision to evacuate (or return; Hasegawa et al., 2015). Finally, data were self-reported. Although the K6 measure is widely used in Japan, it is not necessarily equivalent to clinical interviews and may lead to conservative estimates (Goto & Wilson, 2003).
Despite these shortcomings, we believe our work has a number of important implications. This is one of the largest longitudinal studies of natural disasters using representative samples over a protracted period. Our longitudinal data underline the significance of identifying vulnerable populations after a disaster and the need to orient health services accordingly. This is important in avoiding a simplistic “one size fits all” for interventions (Bonanno et al., 2011). Individuals most at risk are likely to include survivors with previous psychological illnesses, women, and people who had to move home. This has implications for estimates of likely treatment effects as well as efficacy of these interventions (Galatzer-Levy et al., 2018). Expert communication is needed to gain trust of these individuals and better explain the risks following such an event. Finally, despite evidence of decline in psychological distress over time, social support retains importance for several years after the event. The random allocation of housing for survivors may make this problematic, with communities easily fractured during movement (Koyama et al., 2014). Sustained support may therefore be needed, even among individuals in apparently comfortable housing arrangements.
Future research
Our study suggests several avenues for future work. A large percentage of our respondents exhibit a “resilient” trajectory. This response may result from the relative absence of further natural threats facing our populations (e.g., the emergence of new diseases). Multiple threats are associated with more negative postdisaster trajectories (Galatzer-Levy et al., 2018); the emergence of cascading threats is particularly challenging when resources are already stretched (e.g., in locations with low levels of economic development). Further research could profitably explore trajectories in these settings, particularly in those hazard-prone areas neglected in prior research (including many locations in Africa and Asia). Second, we must be wary of reifying the “cat’s cradle” pattern of trajectories we observed in our study. Such trajectories may not be simply linear or stable over time (Sher, Jackson, & Steinley, 2011), and different study designs are likely to lead to different class memberships (e.g., prospective studies report higher resilience than longitudinal analyses; Galatzer-Levy et al., 2018). Finally, one interesting avenue for research may explore mental health implications when an individual’s trajectory is significantly different from that of his or her societal group (e.g., when an individual’s chronic trajectory is at odds with others in his or her ethnic group). Such work could complement other emerging research that emphasizes a combination of individual- and community-level relationships in the development of mental health after disaster (Matsumaya et al., 2016).
Supplemental Material
Goodwin_Supplemental_Material – Supplemental material for Trajectories of Distress Following the Great East Japan Earthquake: A Multiwave Prospective Study
Supplemental material, Goodwin_Supplemental_Material for Trajectories of Distress Following the Great East Japan Earthquake: A Multiwave Prospective Study by Robin Goodwin, Kemmyo Sugiyama, Shaojing Sun, Masahito Takahashi and Jun Aida in Clinical Psychological Science
Footnotes
Acknowledgements
We appreciate the generous help from the Miyagi prefectural officers and all the people who participated in all waves of the study. We also thank Ken Osaka, who helped facilitate the collaboration, and the acting editor and reviewers for their invaluable input. The content is solely the responsibility of the authors and does not reflect the views of the Miyagi Prefecture.
Transparency
Action Editor: Scott O. Lilienfeld
Editor: Scott O. Lilienfeld
Author Contributions
R. Goodwin, K. Sugiyama, and S. Sun conducted the data analyses. M. Takahashi, J. Aida, and S. Sun reviewed and revised initial data waves and aided in interpretation. R. Goodwin, J. Aida, and M. Takahashi helped conceptualize the study and reviewed and revised the manuscript. All of the authors approved the final version of the manuscript for submission.
References
Supplementary Material
Please find the following supplemental material available below.
For Open Access articles published under a Creative Commons License, all supplemental material carries the same license as the article it is associated with.
For non-Open Access articles published, all supplemental material carries a non-exclusive license, and permission requests for re-use of supplemental material or any part of supplemental material shall be sent directly to the copyright owner as specified in the copyright notice associated with the article.