
Abstract
Retaining participants in longitudinal survey studies is critical for ensuring data quality but is especially difficult with emerging adults, who are navigating developmental transitions. We tested whether a low-cost intrinsic motivator—either a study specific or national data infographic—could improve participation in the seventh wave of a longitudinal study, compared to a no infographic control. Logistic regression models (N = 559) examined the effects of infographic condition, gender, ethnicity, and prior participation on current wave participation. Prior participation was the strongest predictor, with returning participants over eight times more likely to respond. Although infographics did not significantly increase overall participation, interaction effects showed higher participation among non-Latinx participants of color in the national infographic condition. Women were also significantly more likely to participate than men, regardless of condition. Findings highlight the importance of early engagement strategies and the value of developmentally and culturally grounded approaches in retaining participants.
Researchers consistently highlight the need for more longitudinal work. Among its many key benefits, longitudinal research enhances our understanding of developmental processes, causation, directionality, and stability. Despite these benefits, retention of participants over a prolonged period of time has always been challenging. Participant retention has been especially difficult in social and health sciences, where attrition rates are typically very high. This often forces researchers to employ analytical techniques to reduce bias in their data caused by nonrandom missingness (e.g., West & McCabe, 2017). The groups exhibiting the lowest levels of engagement and the highest rates of dropout from longitudinal studies tend to be younger individuals, men, people of color, and those with lower levels of education (Gustavson et al., 2012; Mendelson et al., 2021; Ramirez Hall & Nishina, 2019; Teague et al., 2018; Zhang et al., 2023). Even with statistical manipulation, high attrition, particularly from specific subgroups of the sample, can limit the generalizability of findings, making effective approaches to minimize attrition and maximize engagement all the more important.
Retention challenges may be especially pronounced during emerging adulthood, a distinct developmental period marked by heightened mobility, identity exploration, and instability across multiple life domains (Arnett, 2000). These transitions can make it more difficult for participants to maintain longitudinal engagement, particularly in web-based studies where researchers cannot rely on institutional or community anchors (e.g., schools). Moreover, participation decisions during this life stage may be shaped not only by logistical barriers but also by whether the study feels developmentally relevant or affirming to their current life context. This may help explain why longitudinal studies with youth and emerging adults in the health sciences—particularly those addressing specific health conditions—often experience higher and more consistent participation across years compared to studies in the social sciences (e.g., Hanna et al., 2014).
There may also be an interaction between individual characteristics and study topic, resulting in higher attrition among certain subgroups in particular types of research. For instance, studies on mental health may experience greater dropout rates among men and emerging adults of color, who often face heightened stigma and are less likely to seek help than women or White individuals (Sigal & Plunkett, 2024; Woodall et al., 2010). This is especially relevant during emerging adulthood, a developmentally sensitive period in which mental health challenges—particularly mood disorders—are most likely to peak (Abelson et al., 2021; Solmi et al., 2022). As such, studies that make mental health issues more salient may feel less engaging or even aversive to some participants, reducing long-term study commitment.
Moreover, demographically targeted strategies (e.g., community liaisons) may be less effective in web-based contexts that lack interpersonal connection. In these settings, participants must derive a sense of value or relevance from the study itself, as researchers have limited opportunities to foster personal rapport. For emerging adults, whose developmental needs include autonomy and relatedness, retention may depend on whether the study aligns with their intrinsic motivations or offers meaningful extrinsic incentives.
Engagement and Retention Strategies
Researchers use multiple engagement and retention strategies in the same study to compound and maximize their positive effects to boost participant motivation (Wong et al., 2021). These strategies can be broadly grouped into increasing extrinsic motivations (i.e., participation for attainment of separable outcome or external reward) and/or intrinsic motivations (i.e., participation for its inherent enjoyment or personal satisfaction; Ryan & Deci, 2000).
Extrinsic Motivation
Extrinsic incentives are often the first strategy researchers employ when trying to increase participant engagement. Incentives, in the form of direct financial compensation or material rewards (e.g., money, merchandise), have been found to be highly effective in both engaging and retaining participants (Booker et al., 2011; Jong et al., 2023; Wong et al., 2021). However, ethical concerns about coercion via monetary compensation, particularly in vulnerable populations that may be in significant financial need, should be considered (e.g., Millum & Garnett, 2019). Furthermore, increasing financial or material incentives may not be feasible due to the budget constraints faced by many researchers, particularly junior researchers or those in limited-resource contexts. The cost of incentives can also restrict the number of participants invited, and limit the number of data collection waves the research budget allows.
Incentive effects may also vary by study design. For instance, a daily diary study demonstrated that offering emerging adults consistent daily compensation significantly increased retention and survey completion rates, outperforming both incrementally increasing and end-of-week lump sum payments (Ramirez Hall & Nishina, 2019). This may be important during emerging adulthood when financial insecurity, transitional employment, and fluctuating living arrangements are common (Arnett, 2000). During this time, even modest compensation may help offset competing demands on time and resources, making continued participation more feasible and appealing (Booker et al., 2011). The value placed on financial incentives may also vary depending on participants’ educational or occupational status, with emerging adults not enrolled in higher education or working in precarious jobs potentially finding compensation more compelling than their college-enrolled or stably employed peers. Evidence suggests that such strain can also increase reliance on parental support which, while materially helpful, has been shown to undermine psychological well-being by diminishing self-efficacy and threatening the sense of independence during this life stage (Mortimer et al., 2016). Further work is needed to better understand differential participation as a function of financial need in emerging adulthood. Thus, while extrinsic motivators are effective, they require mindful implementation that take into account factors such as financial viability and ethics, emphasizing the need to consider alternative strategies.
Intrinsic Motivation
Strategies focused on intrinsic motivation provide cost-effective ways to complement, enhance, or replace the impact of extrinsic motivators, while providing an added benefit of participation to the participant. These strategies align the study’s objectives with participants’ personal values and beliefs, fostering a sense of autonomy, relatedness, and competence (Ryan & Deci, 2000). For example, sharing research findings with participants can act as an additional incentive, helping them understand the value and significance of their contributions (Wong et al., 2021). Intrinsic motivation strategies may be especially effective for engaging emerging adult participants, as they allow individuals to connect study activities with their personal values and long-term goals. Research shows that when young people perceive opportunities for self-reflection, growth, and contribution to a larger purpose, their sustained engagement and motivation increase (Larson & Rusk, 2011). These approaches align with the core developmental needs of emerging adulthood and can enhance participants’ investment in longitudinal research beyond what extrinsic incentives alone might achieve. Notably, among highly intrinsically motivated participants (i.e., participating for enjoyment or to share their opinion) extrinsic motivators, such as financial incentives, may have a negative impact on participation (Brüggen et al., 2011). Thus, taken together, this nuance highlights the need to carefully balance intrinsic and extrinsic approaches to engagement.
Building social connections and trust between researchers and participants is another effective, no-cost retention strategy that encourages long-term engagement (Jong et al., 2023). This can be particularly valuable in recruiting minority participants, as they may be more motivated by altruistic reasons but are often deterred by mistrust of research (George et al., 2014). One low-cost strategy to build rapport with participants is to maintain frequent communication, not only by sending survey reminders, but also by expressing appreciation for their involvement and acknowledging special occasions (e.g., holidays, birthdays) (Booker et al., 2011; Davis et al., 2016; Grape et al., 2018; Hanna et al., 2014; Wong et al., 2021). Social connections can also be fostered indirectly by recruiting participants within peer groups and having people who know each other be involved in the study together, which has been found to be effective in young and racial minority samples (Jong et al., 2023; Price et al., 2016).
Current Study
Given the importance of motivation in research participation, this study aimed to test whether a cost-effective intrinsic motivator, such as an infographic, combined with the extrinsic motivator of monetary compensation, could facilitate continued participation in an ongoing longitudinal study in its seventh year. Originally designed to only follow adolescents through their high school years, the study was extended into emerging adulthood to examine the potential impact of the COVID-19 pandemic. This extension provided an opportunity to address a gap in the retention literature by evaluating participant retention in the context of a multi-year longitudinal study based entirely on survey data. To this end, we tested: (1) whether a randomly assigned infographic—featuring either study-specific or national information—would increase the likelihood of participation in the current wave compared to a no-infographic control, and (2) whether infographic effects interacted with gender or ethnicity, while accounting for previous participation in the last two waves.
Although extrinsic motivation was not specifically tested or manipulated in this study, consistent with prior waves, all participants, regardless of their infographic condition, were provided with an extrinsic incentive in the form of a $25.00 gift card. To boost the effects of the monetary compensation, we increased the amount by $5.00 from the previous two years, and introduced a choice between an Amazon or VISA gift card (compared to just Amazon in prior years), offering more versatility. Participants were informed of these changes in the email invitations.
We hypothesized that participants exposed to the study-specific infographic would have the highest odds of continued participation due to its direct relevance to their previous contributions. This would be followed by those exposed to the national data infographic, which addressed trends within their age group (i.e., emerging adults), while the no-infographic control group was expected to have the lowest likelihood of continued participation. Additionally, based on established gender and racial differences in research participation, we expected women (compared to men) and White participants (compared to Latinx and non-Latinx people of color [POC]) to be more likely to participate. Furthermore, we hypothesized that women would be more likely to be positively influenced by infographic exposure than men. Finally, we hypothesized that Latinx and non-Latinx participants of color would exhibit a stronger positive response to any of the infographics compared to White participants, as the infographic may have a greater impact on those who traditionally have lower baseline participation rates and may benefit more from tailored engagement strategies related to intrinsic motivation. Lastly, we hypothesized that those who participated in any of the previous two waves would be more likely to continue their participation compared to those who had not consistently participated.
Method
Participants
This study is part of an annual follow-up within a six-year longitudinal project that tracked a cohort of public school students from ninth grade through three years post–high school in two West Coast states. For the current wave, 613 emerging adults were invited to participate. Thirty-seven individuals were excluded from analyses: five due to completely missing baseline data and 32 due to repeated email delivery failures (e.g., inactive or bounced addresses), resulting in a final eligible sample of 576. Of these, 29.3% had not participated in either of the two previous post–high school waves, 20.8% had participated in one, and 49.8% had participated in both. Notably, 11 participants who had not engaged since high school rejoined the study in this wave. In total, 289 participants (50.2%) completed the current survey, while 287 (49.8%) did not.
The sample was ethnically and racially diverse, with 67% identifying as an ethnicity other than European White or Caucasian (33% Caucasian/White; 25% Latinx; 15% Asian American; 15% Multiethnic; 12% Other, including African American/Black, Native American/Alaskan Native, Pacific Islander/Filipino). Gender distribution was approximately even, with 50% identifying as women, 47% as men, and 3% as non-binary. Most participants in this wave indicated they were attending college (43% in four-year colleges, 33% in two-year colleges, 2% in vocational, technical, or trade schools, and 22% not in school) and employed (26% full-time, 36% part-time, 4% in the military, 3% as volunteers, and 31% unemployed).
Measures
Demographics
Participants were asked to identify their gender (i.e., girl, boy, not sure, other/non-binary) and ethnicity. Gender options were collapsed into men, women, and non-binary categories. Similarly, ethnicity was collapsed into the three largest ethnic groups: White, Latinx, and all other non-Latinx ethnic minority categories (see Participants section above). Previous participation was measured on a continuous scale as follows: 0 = did not participate in post-high school data collection, 1 = participated in only one data collection wave post-high school, and 2 = participated in both data collection wave post-high school.
Infographic
Prior to being invited, the participant mailing list was grouped by original high school, then randomly assigned to one of three conditions (i.e., study data infographic, national data infographic, no-infographic control). This ensured an even distribution across the three experimental conditions (i.e., approximately one-third of the sample in each condition), controlling for high school.
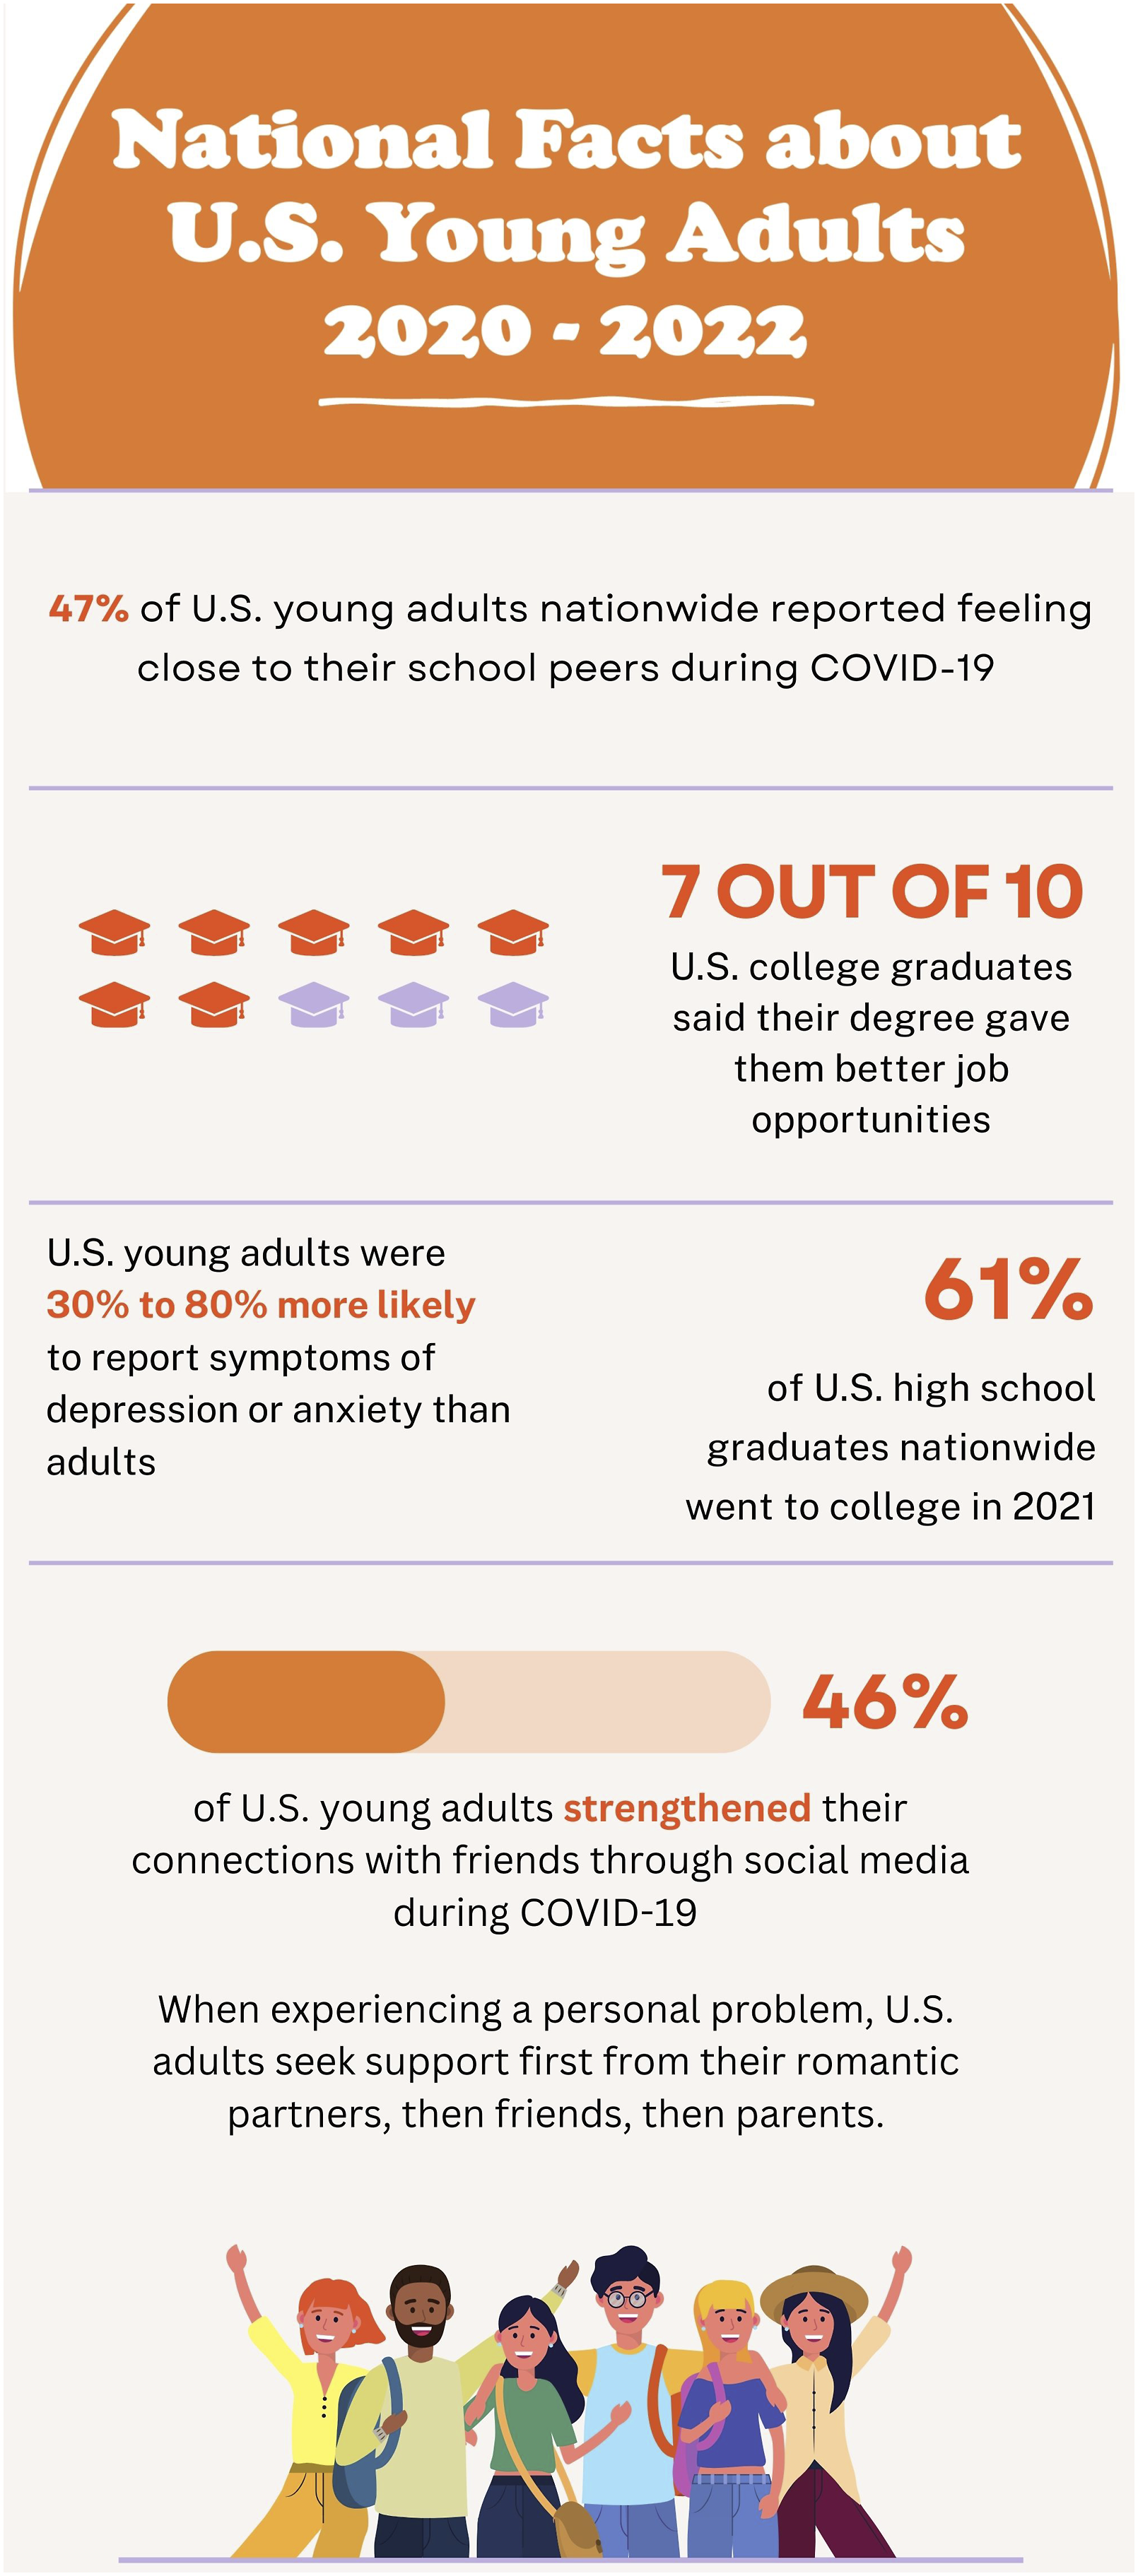
There were no significant differences in the distribution of participants across experimental conditions by gender (χ2 = 0.28, df = 2, p = .87) or by race-ethnicity (χ2 = 2.00, df = 4, p = .74). The study email invitation was the same across all conditions with the exception of the infographic (study-specific or national) that was an image embedded in the email only for the experimental conditions. Five email reminders to take the survey were sent across the two months that the survey remained open. For those who completed the survey, the study-specific infographic was included in the final compensation email regardless of condition. The study-specific infographic (Figure 1) shared findings from the three previous data collection waves for this study (i.e., 2020-2022). The national data infographic (Figure 2) shared parallel findings from national surveys conducted within the same timeframe (i.e., 2020-2022). The infographics in both experimental conditions were intentionally designed to cover the same broad topics (e.g., college attendance, mental health) to ensure that any influence on participants was not due to the specific content of the findings but rather the type of infographic (study-specific vs. national findings). The same design and color scheme were also used for both infographics. Canva, an online graphic design platform, was used to create the infographics. Study-specific Data Infographic. National Data Infographic. 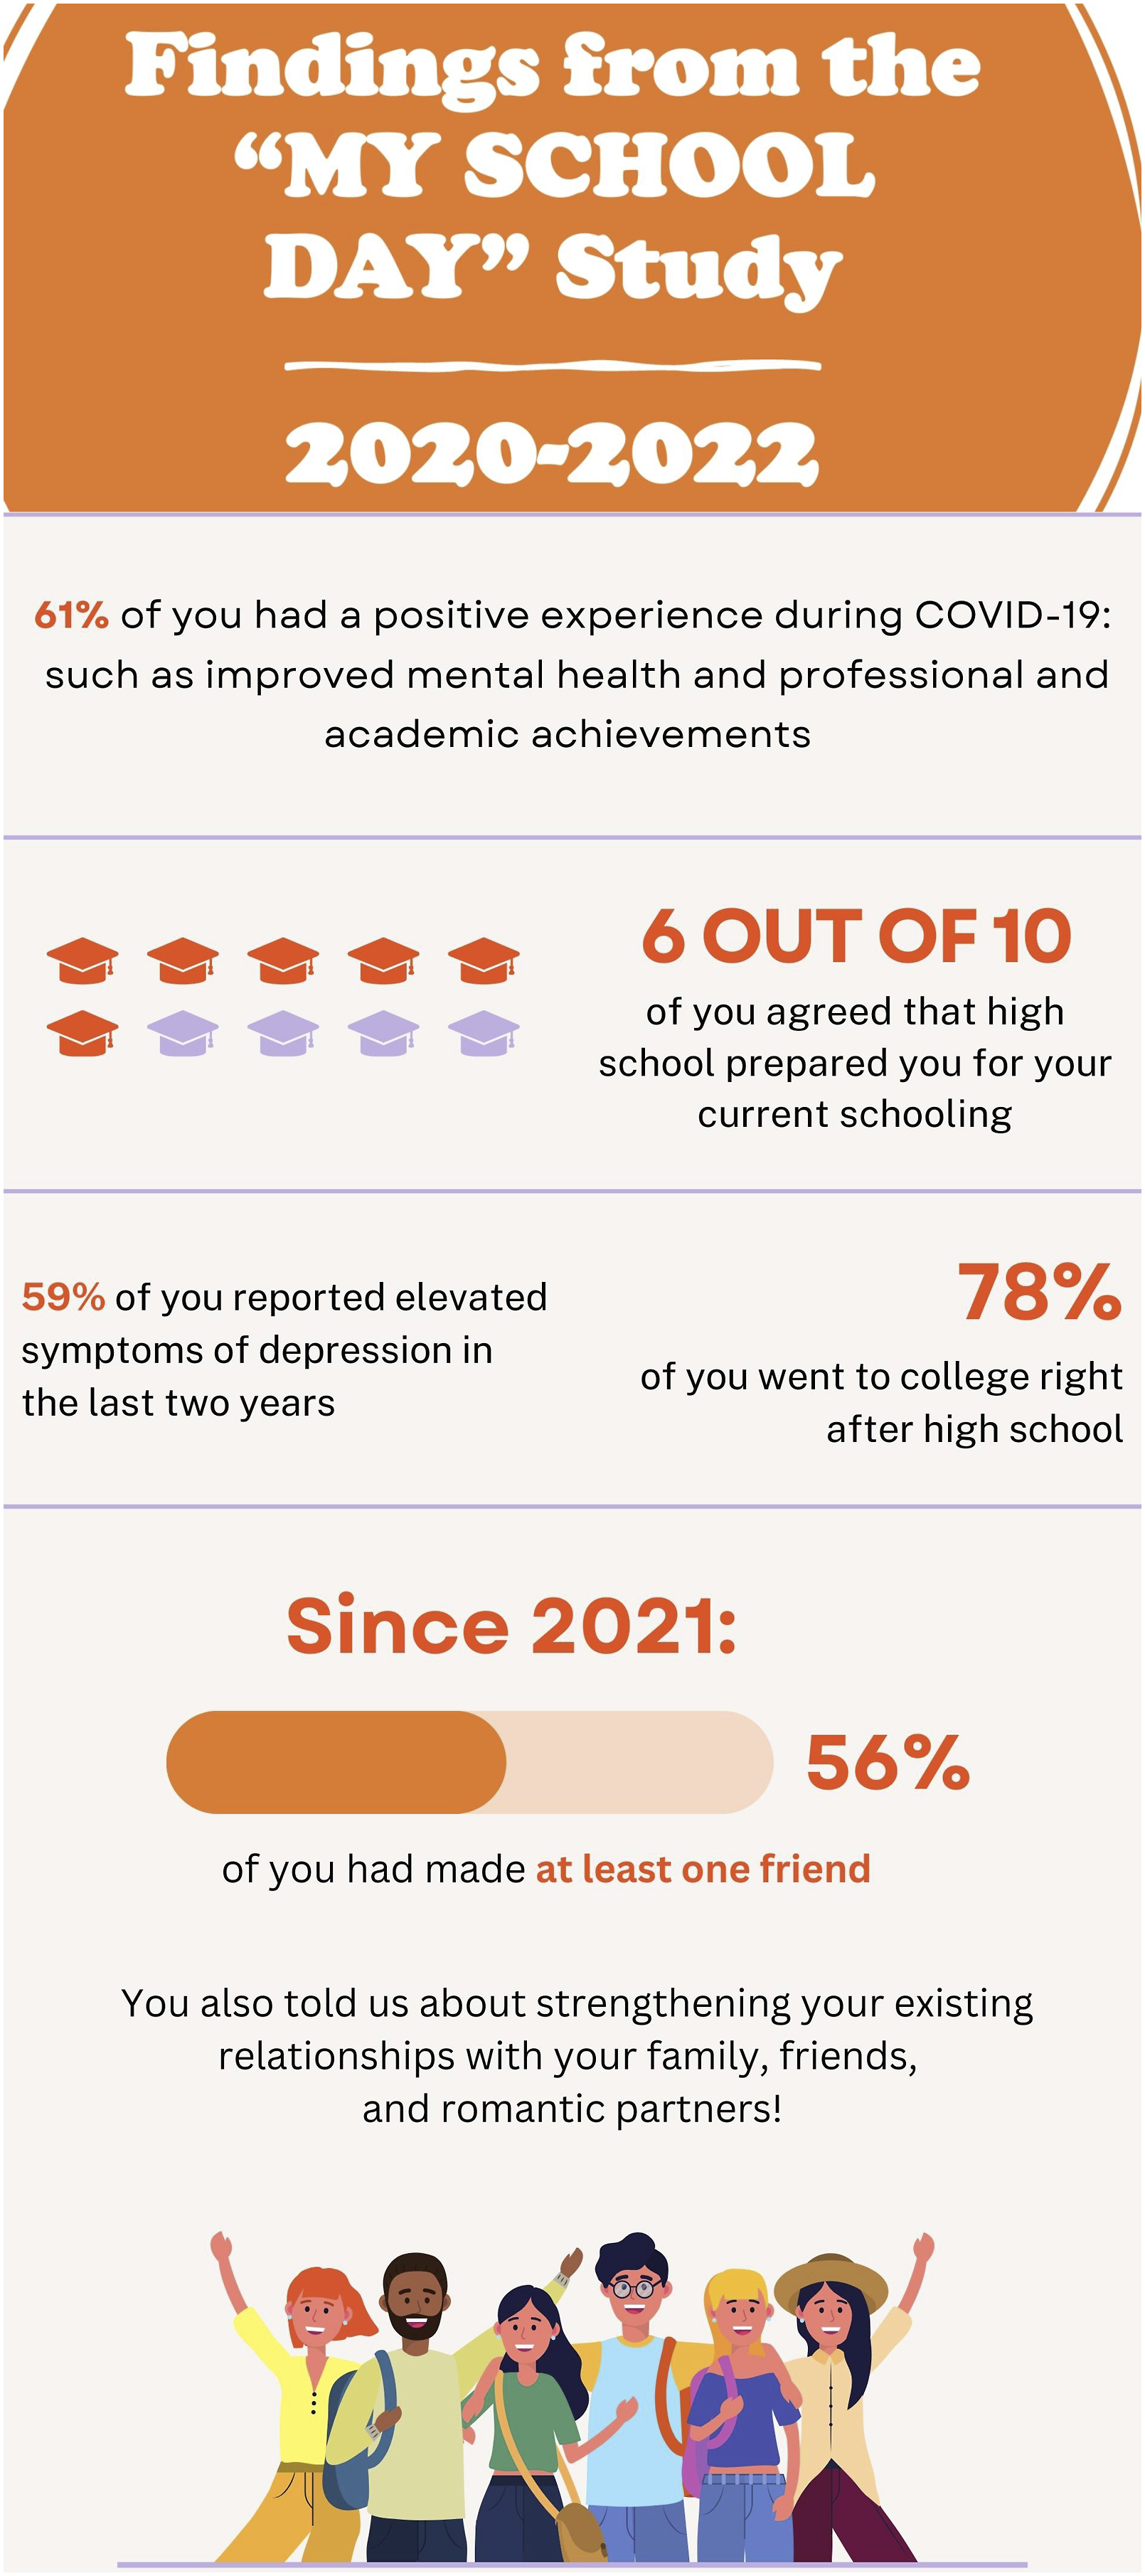
Procedure
A mailing list of participants from their 11th and 12th grades was used to email invitations to recruit for the current wave. In 2023, participants were informed they were being invited to take part in an additional year of data collection as a follow-up to a study they were a part of during high school (2016-2020). Participants were told the survey contains questions related to their feelings, identity, social life, and COVID-19. Survey duration was approximately 20 to 30 minutes and participants would be offered a choice between a VISA or an Amazon digital gift card valued at $25.00 for survey completion. Of those who completed the survey, 54% chose an Amazon gift card and 46% chose a VISA gift card as their compensation method. The survey was administered through SurveyMonkey (online survey platform) and analyses were conducted using StataSE 18.0 (statistical software). This study was approved by the Institutional Review Board at the authors’ institution.
Results
Primary Analysis
Logistic Regression Results Predicting Likelihood of Participation
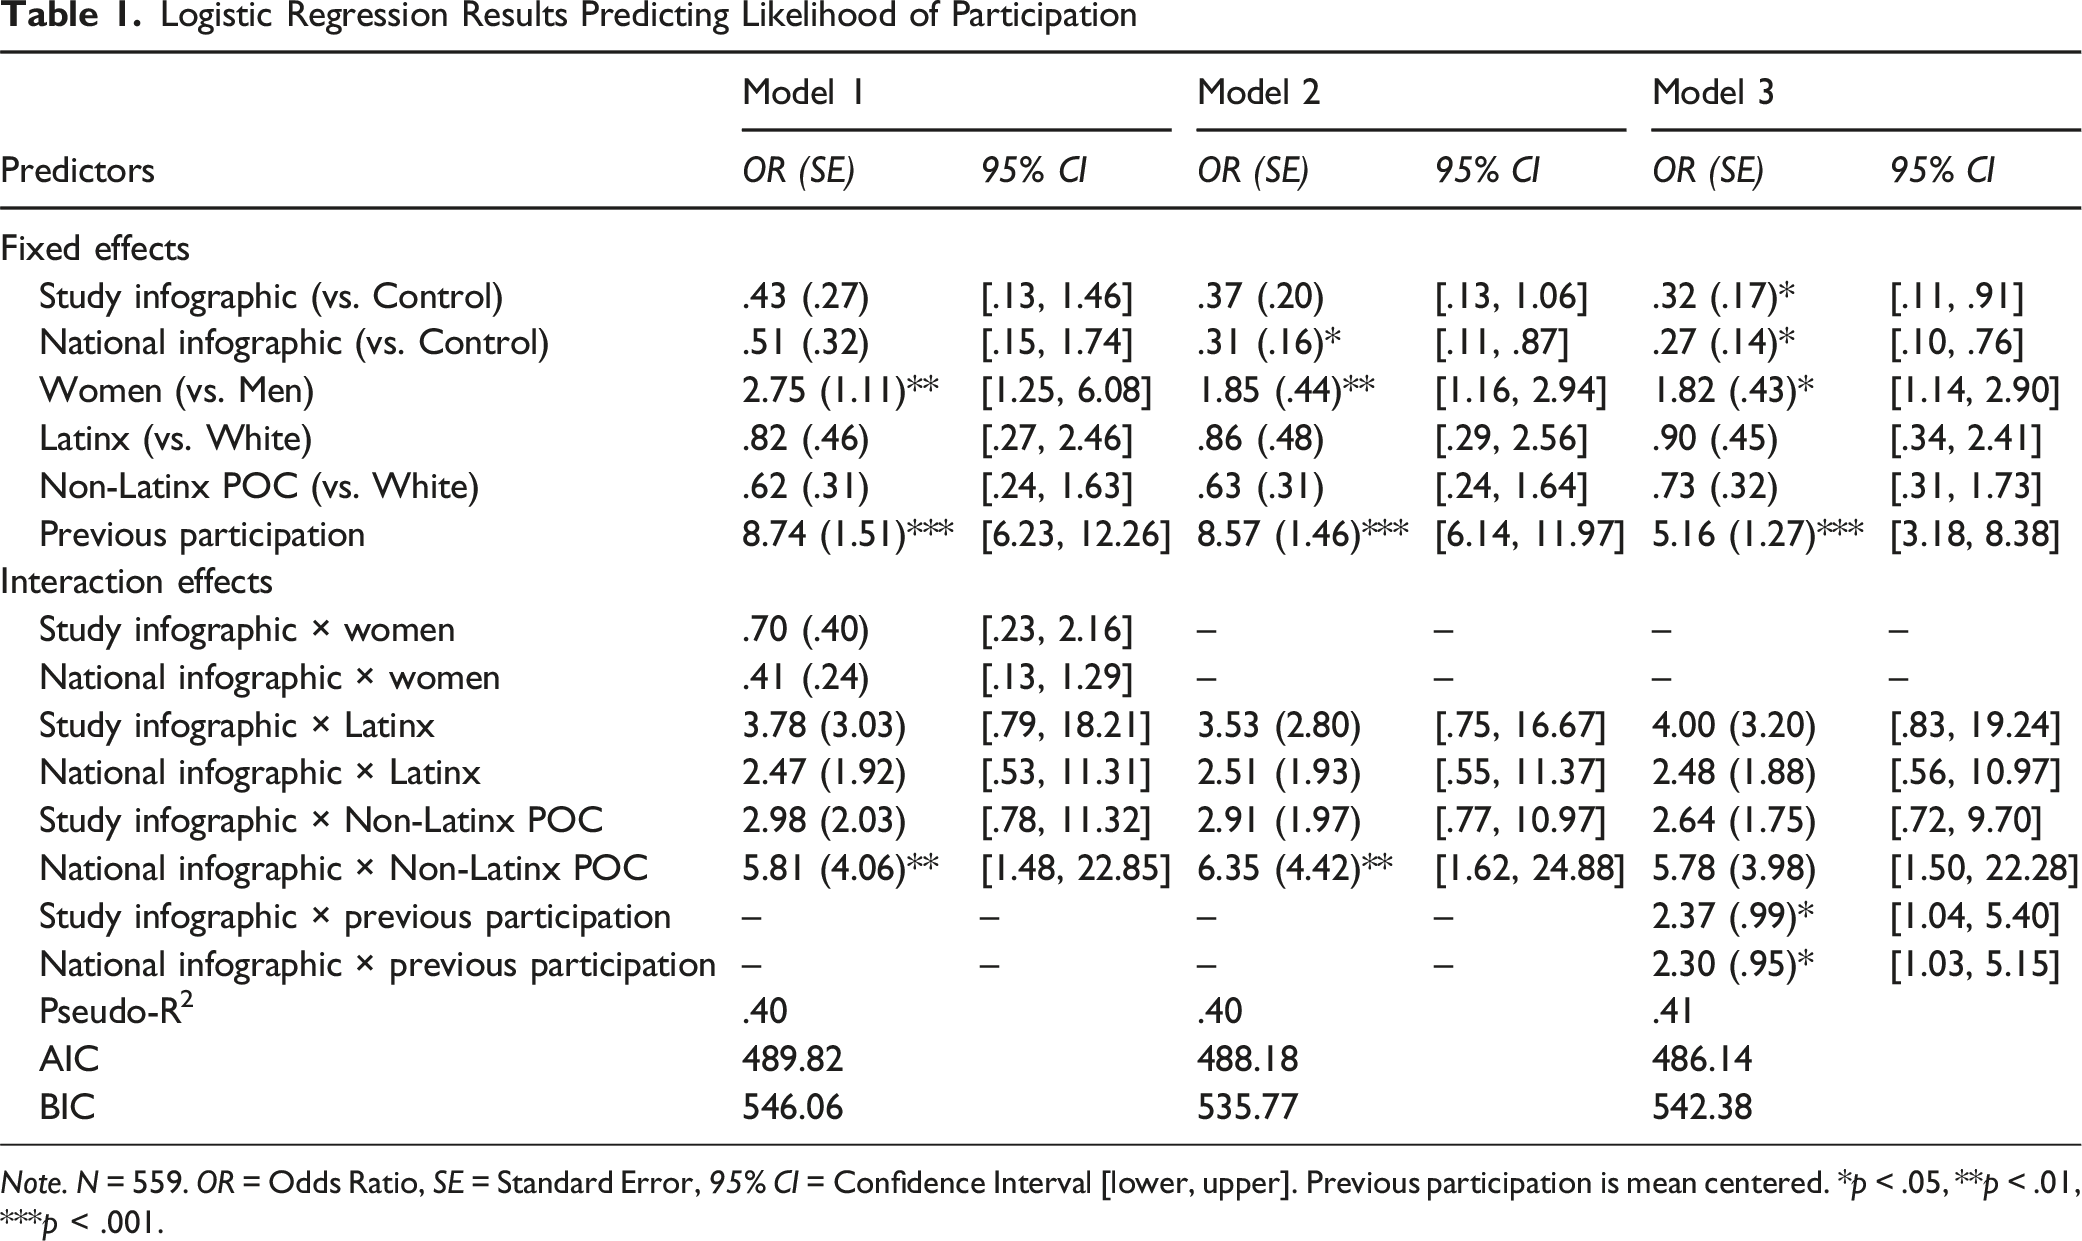
Note. N = 559. OR = Odds Ratio, SE = Standard Error, 95% CI = Confidence Interval [lower, upper]. Previous participation is mean centered. *p < .05, **p < .01, ***p < .001.
Results indicated that previous participation was the strongest predictor of participation in the current wave, OR = 8.74, 95% CI [6.23, 12.26], p < .001. For each additional wave completed (out of two possible prior waves), the odds of participating again in the current wave increased more than eightfold, holding all other predictors constant. However, infographic condition and ethnicity alone were not significant predictors of participation. Compared to participants in the no-infographic control group, neither the study infographic (OR = 0.43, 95% CI [0.13, 1.46], p = .18) nor the national infographic (OR = 0.51, 95% CI [0.15, 1.74], p = .28) significantly increased the odds of participation. Similarly, Latinx participants (OR = 0.82, 95% CI [0.27, 2.46], p = .72) and non-Latinx participants of color (OR = 0.62, 95% CI [0.24, 1.63], p = .33) did not differ significantly in participation likelihood from White participants overall.
However, a significant interaction emerged between infographic condition and ethnicity, indicating that infographic effects varied across ethnic groups. Specifically, non-Latinx participants of color exposed to the national infographic were significantly more likely to participate than White participants in the same condition (OR = 5.81, 95% CI [1.48, 22.85], p = .01). No other infographic by ethnicity differences were found. Specifically, Latinx participants in the national infographic condition did not differ significantly from their White peers (OR = 2.47, 95% CI [0.54, 11.31], p = .25), nor did Latinx (OR = 3.78, 95% CI [0.79, 18.21], p = .10) or non-Latinx participants of color (OR = 2.98, 95% CI [0.78, 11.32], p = .11) in the study infographic condition. There was also a significant main effect of gender, such that women had higher odds of participation than men (OR = 2.75, 95% CI [1.25, 6.08], p = .01). However, the effect of infographic by gender interaction was not significant. Specifically, the study infographic (OR = 0.70, 95% CI [0.23, 2.16], p = .54) and national infographic (OR = 0.41, 95% CI [0.13, 1.29], p = .13) did not have different effects on participation odds for men versus women.
While the study did not have enough power to test for a three-way interaction (infographic x gender x ethnicity), to better visualize these effects, this logistic regression model was used to estimate and plot predicted probabilities of participation by infographic condition and ethnicity, separated by gender, and while holding previous participation constant at the sample mean. Across gender, Latinx participants showed high predicted probabilities of participation across all conditions (Figure 3, yellow bars), followed by non-Latinx participants of color (Figure 3, blue bars), and then White participants (Figure 3, black bars). Among women, White participants exhibited the steepest decline in participation across conditions: predicted probabilities dropped from 65.9% in the control condition, to 37.0% with the study infographic, and further to 28.8% with the national infographic. Latinx women demonstrated high participation, with predicted probabilities of 61.2% (control), 64.5% (study infographic), with the exception of a notable drop for the national infographic condition to 44.8%. Non-Latinx women of color showed somewhat lower but stable estimates: 54.5% (control), 52.1% (study infographic), and 59.3% (national infographic). Among men, White participants showed the lowest predicted participation rates overall, with probabilities ranging from 41.2% (control) to 23.3% (study infographic) and 26.4% (national infographic). Latinx men demonstrated higher predicted participation, ranging from 36.4% (control) to 48.4% (study infographic) and 41.9% (national infographic). Notably, non-Latinx men of color showed the highest predicted participation under the national infographic condition, with estimates rising from 30.3% (control) and 36.0% (study infographic) to 56.4% (national infographic). Predicted Probability of Participation by Ethnicity and Gender Across Infographic Conditions. Note. N = 559. Confidence Intervals Omitted for Visual Clarity. Previous Participation was Mean-Centered and Held Constant at the Sample Mean. Non-Latinx POC = Participants of Color that Self-Identified as an Ethnicity Other than White or Latinx.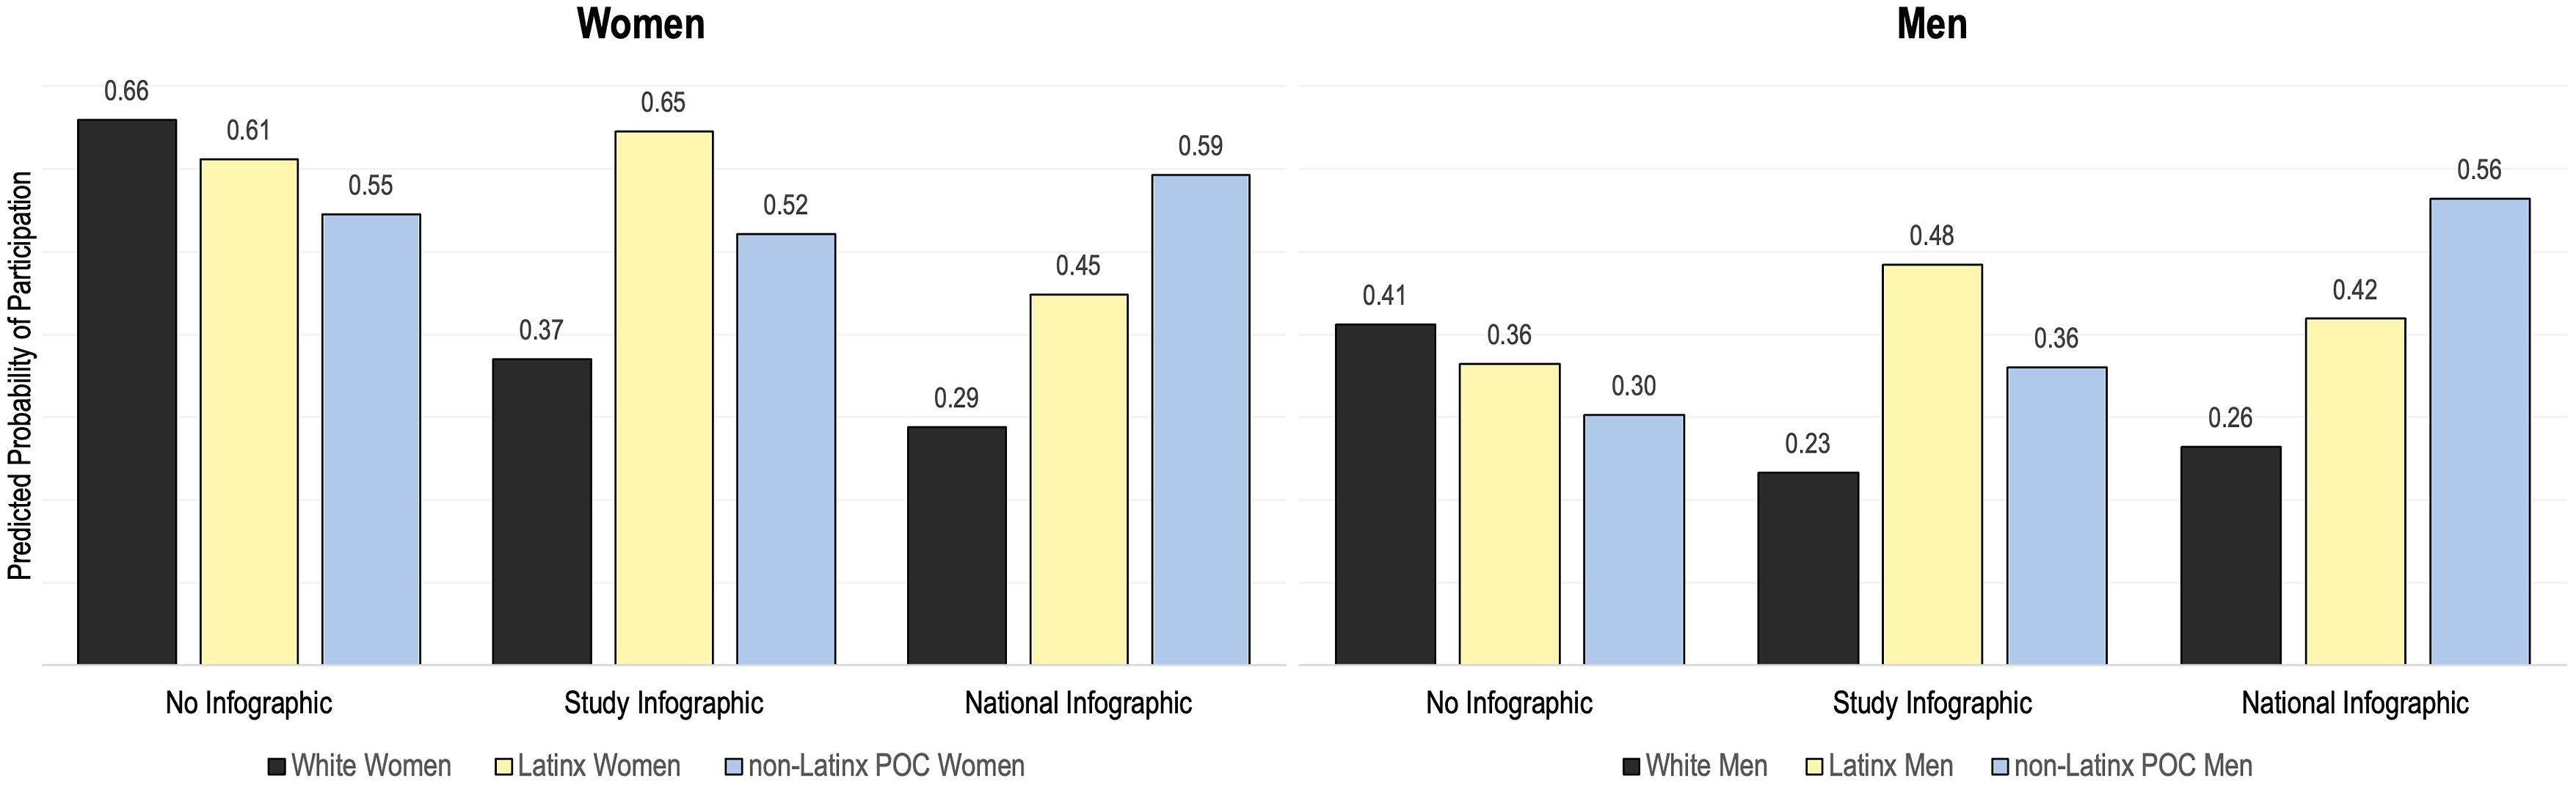
Post Hoc Analyses
To improve model parsimony, a post hoc logistic regression model was estimated that removed the non-significant infographic by gender interaction terms from the hypothesized model (Model 1), while retaining gender as a main effect. The revised model (Model 2) demonstrated good fit, χ2 (10) = 308.67, p < .001, and showed a slight improvement in model fit over the hypothesized model, as indicated by lower AIC (488.18 vs. 489.82) and BIC (535.77 vs. 546.06) values. However, a likelihood-ratio test comparing Model 2 to the hypothesized model was not statistically significant, χ2 (2) = 2.35, p = .31, suggesting that the removal of gender interaction terms did not significantly worsen model fit (see Table 1, Model 2 for full results).
A third and final logistic regression model (Model 3) was then estimated to explore whether the effect of infographic condition on participation varied by prior participation history. The model demonstrated good fit, χ2 (12) = 314.71, p < .001, and improved model fit relative to Model 2 based on AIC (486.14 vs. 488.18), though BIC increased slightly (542.38 vs. 535.77). A likelihood-ratio test comparing Model 3 to Model 2 yielded marginal statistical significance, χ2 (2) = 6.04, p = .05, suggesting that the addition of the interaction terms may have contributed to minor improvement in model fit. This model’s results provide tentative evidence that the effect of infographic exposure on participation may have varied based on participants’ prior participation history. Specifically, participants who had completed previous waves appeared more likely to participate when assigned to either the study infographic (OR = 2.37, 95% CI [1.04, 5.40], p = .04) or the national infographic (OR = 2.30, 95% CI [1.03, 5.15], p = .04), compared to peers in the same condition who had not participated earlier (see Table 1, Model 3 for full results).
Discussion
This study contributes new evidence to a relatively limited body of social science research on developmentally-informed, scalable strategies for improving retention in web-based longitudinal studies of emerging adults. While retention is widely recognized as essential for producing valid, generalizable findings, especially in diverse populations, empirical guidance on how to maintain engagement in online, postsecondary follow-up studies remains scarce. This gap is particularly salient during emerging adulthood, a life stage characterized by identity exploration, shifting commitments, multiple transitions and structural instability (Arnett, 2000), which can complicate sustained participation in research. Our study addresses this gap by testing whether brief, low-cost infographic messages—designed to either highlight participants’ individual contributions or contextualize their responses within broader social patterns—could enhance participation in an ongoing longitudinal cohort of emerging adults.
Contrary to our hypotheses, neither infographic condition yielded significant main effects on participation. This aligns with prior research suggesting that light-touch retention approaches may be insufficient in later study waves, where participants are already highly self-selected in terms of motivation (Booker et al., 2011). It is possible that a ceiling effect occurred among those who had remained engaged through six previous waves, leaving little room to further increase motivation to participate. Alternatively, participants’ responsiveness to interventions may depend on deeper factors, including personal relevance and prior study investment.
Indeed, our interaction findings highlight the importance of participant characteristics. Non-Latinx participants of color were significantly more likely to participate when exposed to the national infographic, compared to their White peers in the same condition. While these broad ethnic categories should be interpreted cautiously, the finding aligns with theories suggesting that identity-relevant cues can enhance motivation and engagement. Specifically, identity-based motivation theory posits that individuals are more likely to act when a behavior feels congruent with their social identity and future self (Oyserman, 2015), and self-protective models of stigma suggest that feelings of group-based devaluation can heighten sensitivity to inclusion and recognition (Crocker & Major, 1989). The national infographic contextualized individual responses within broader societal patterns, which may have enhanced relevance for participants who perceive their experiences as historically marginalized or underrepresented. Such identity-affirming messaging may have conveyed a sense of social value or a broader community benefit for the participants of color, thereby fostering engagement and follow-through among this group (Singh et al., 2018). In contrast, White participants may have found this framing less personally resonant, potentially leading to lower perceived relevance and reduced motivation to participate. Interestingly, Latinx participants demonstrated consistently high predicted participation across all conditions, suggesting that their engagement may reflect strong study familiarity, intrinsic motivation, or a sustained sense of alignment with the study’s long-term aims.
We also observed a significant gender difference: women were more likely to participate than men, a pattern consistent with past research showing higher survey retention among women (Becker, 2022; Porter & Whitcomb, 2005). This pattern has been repeatedly observed across survey modes and panels, with women tending to participate earlier and at higher rates than men, particularly in self-administered web-based surveys. However, there was no evidence that infographic exposure had differential effects between men and women. This suggests that women’s greater participation may reflect broader patterns in communication responsiveness or social engagement, rather than sensitivity to study-specific interventions.
From a developmental perspective, these patterns are meaningful. Emerging adulthood is a phase of increasing financial responsibility, and retention strategies may benefit from aligning with participants’ goals during this life stage. In this context, the study’s $5 increase in compensation and flexible gift card options may have contributed meaningfully to re-engagement among participants who had not participated in years. While only a small subset (1.9%) rejoined the study after being fully inactive since high school, their re-engagement was not concentrated in any one condition, suggesting that other intrinsic factors (e.g., recommitment to the study) or extrinsic motivators (e.g., increased payment) were more influential than experimental framing. This finding is consistent with literature emphasizing the importance of aligning research participation with participants’ values, developmental context, and sense of autonomy—factors shown to support retention, particularly among underrepresented or historically disengaged groups (Mortimer et al., 2016; Patel et al., 2003; Yancey et al., 2006).
The most robust predictor of participation was prior wave completion: participants who had completed one or both of the previous follow-up surveys were significantly more likely to participate again. This aligns with prior findings on the power of engagement history and habit formation in sustaining retention (Cotter et al., 2005; Marel et al., 2015). Post hoc analyses further suggested that any infographic exposure may be more effective among previously engaged participants, perhaps because these individuals feel greater ownership over or familiarity with the study and the infographics reinforce these feelings. From a developmental standpoint, this may reflect the growing importance of perceived consistency, investment, and accountability during emerging adulthood, where building longitudinal relationships with institutions (including researchers) may help support stable engagement.
In sum, while infographics alone did not produce universal effects, our findings suggest that their impact may depend on participants’ identity and engagement history. Future research should continue to explore how developmentally timed, identity-relevant messaging, paired with early, consistent participant engagement, can enhance long-term retention. Strategies that consider the evolving priorities and constraints of emerging adulthood (e.g., financial stress, mobility, shifting values) may prove especially impactful in sustaining diverse participant involvement across time.
Limitations and Future Directions
A key strength of this study is the use of a population-based sample drawn from an entire grade cohort across three racially and socioeconomically diverse public high schools in two U.S. states. This design offers greater generalizability than typical college-based samples of emerging adults. However, further research is needed to better understand how engagement strategies may operate across the wide range of experiences characteristic of this developmental period. For example, college-enrolled participants may be more accustomed to research participation due to institutional exposure or course requirements, while non-college emerging adults may be more motivated by the personal relevance of the study or its practical value (Jong et al., 2023). Other contextual factors, such as prior civic engagement, may also shape motivation to participate and deserve closer examination in future work.
Although this study incorporated gender and ethnicity into its models, we were constrained in our ability to explore more complex interactions due to limited subgroup sample sizes. For instance, while we did test an ethnicity-by-gender interaction, which was non-significant and did not change the interpretation of other predictors, a three-way interaction between infographic condition, gender, and ethnicity was not feasible. Some cell sizes fell below recommended thresholds, limiting our ability to interpret subgroup effects. To address this, we presented predicted probabilities by gender and ethnicity in Figure 3 to highlight descriptive patterns.
Additionally, the small number of non-binary participants (n = 17) precluded meaningful subgroup analyses; however, sensitivity checks confirmed that their inclusion or exclusion did not alter model results. Despite this, examining retention patterns among gender-diverse and sexual minority participants remains an important priority for future research. Prior work suggests that factors such as representation, perceived study safety, and tailored feedback may differentially influence sustained engagement in these populations compared to cisgender, heterosexual participants (Kuhns et al., 2008).
Similarly, although all non-Latinx participants of color were included in our analyses, limited subgroup sizes necessitated the use of aggregated ethnic categories. Consequently, the observed interaction where non-Latinx participants of color were more likely than White peers to participate in the national infographic condition cannot be attributed to any specific racial or ethnic subgroup. Future research should prioritize disaggregated analyses and consider follow-up qualitative methods to better understand how participants interpret identity-relevant messaging.
These analytic constraints also reflect a broader limitation of between-group designs. While such designs are effective for detecting average effects, they may obscure meaningful individual differences in what participants find motivating. Intrinsic motivators—such as perceived relevance, curiosity, or a sense of purpose—can vary widely across individuals. To address this variability, future research should explore adaptive engagement strategies that incorporate participant choice. For example, allowing individuals to select the type of feedback or content they receive may promote feelings of autonomy and increase connection to the study, thus being particularly effective in young and emerging adult samples.
Finally, although we relied exclusively on email outreach, we successfully reached most participants, with only 32 invitations bouncing. Thus, the majority of non-participation was clearly not due to delivery failure. In fact, 84% of emails were opened, yet only 56% of those who opened them clicked through to begin the survey, highlighting a key phase of disengagement and a promising area for future research. This brief decision window remains an underexplored barrier in longitudinal survey retention. Some work has highlighted that message design, including salience, perceived burden, and visual complexity can substantially influence participant follow-through after opening a survey invitation (Fan & Yan, 2010). In our study, it is possible that the added information burden in the treatment conditions, where emails included an infographic, may have inadvertently discouraged action compared to the simpler control message. Although all emails were brief (five sentences or fewer) and the infographic was embedded directly into the body of the email (not as an attachment), the presence of an image may have disrupted participants’ ability to quickly assess the message’s purpose or relevance. Future research should investigate how small variations in email design, such as cognitive load, length, and visual presentation, affect participant responsiveness, particularly during the narrow decision-making window between opening an invitation and choosing to participate. Additionally, while the current study did not examine psychological characteristics as predictors of engagement, future work could explore whether factors such as mental health or stress shape motivation to remain involved, particularly for emerging adults navigating ongoing instability.
Conclusion
This study offers insights into retention strategies for longitudinal survey research with diverse emerging adults, emphasizing the value of early engagement and tailored messaging, while highlighting key areas for further research. Although effects of the infographic interventions were modest, their cumulative impact over time could meaningfully influence sample representativeness and study validity. A more nuanced understanding of how intrinsic motivation interacts with participants’ identities and interests is critical for improving long-term retention. These findings suggest that developmentally informed strategies, such as emphasizing broader social contribution, aligning messages with cultural identity, and offering flexible incentives may be more effective than one-size-fits-all approaches. Designing communication that reflects emerging adults’ shifting priorities and life contexts holds promise for enhancing the inclusiveness and generalizability of longitudinal research.
Supplemental Material
Supplemental Material - Assessment of Infographics as a Retention Strategy in a Longitudinal Study of Diverse Emerging Adults
Supplemental Material for Assessment of Infographics as a Retention Strategy in a Longitudinal Study of Diverse Emerging Adults by Marika Sigal and Adrienne Nishina in Emerging Adulthood.
Footnotes
Funding
The authors disclosed receipt of the following financial support for the research, authorship, and/or publication of this article: This work was supported by the Jastro Shields Graduate Student Research Award (Departmental Internal Award to first author), Agricultural Research Service (USDA HATCH CA-D-HCE-2697-H), and Institute of Education Sciences (R305A170559).
Declaration of Conflicting Interests
The authors declared no potential conflicts of interest with respect to the research, authorship, and/or publication of this article.
Transparency and Openness Statement
The raw data and materials for this study are not openly available, as this study is part of a larger longitudinal study that is still ongoing. However, we have included the infographics used in the treatment conditions in the manuscript as figures. Quantitative analysis code is available upon request and no qualitative analyses were conducted for this manuscript. This study did not have a pre-registration plan, as the extension from high school to emerging adulthood was unplanned, as discussed in this manuscript.
Supplemental Material
Supplemental material for this article is available online.
Author Biographies
References
Supplementary Material
Please find the following supplemental material available below.
For Open Access articles published under a Creative Commons License, all supplemental material carries the same license as the article it is associated with.
For non-Open Access articles published, all supplemental material carries a non-exclusive license, and permission requests for re-use of supplemental material or any part of supplemental material shall be sent directly to the copyright owner as specified in the copyright notice associated with the article.