
Abstract
Housing insecurity is concerning at any age, but the prevalence and predictors of young adult housing insecurity are poorly described. Multivariable regression analyses using cross-national longitudinal data from a population-based sample tested prospective associations between various adolescent predictors and young adult housing insecurity. Participants from Washington State (United States) and Victoria (Australia) were surveyed at ages 13, 14 and 15 (2002–2004) and 25 and 29 years (2014–15, 2018–19; N = 1945; 46% female). The prevalence of housing insecurity was 9%. Multivariable predictors of housing insecurity included living in Washington State, antisocial behavior, a history of school suspension, and academic underachievement. School suspension was more strongly related to insecure housing in Washington State than in Victoria. Future analyses should explore state policy differences and risk and protective processes within social-ecological contexts to identify population-level modifiable upstream risk factors for housing insecurity that can be targeted earlier in the life course.
Introduction
Access to secure housing is a human right, providing safety and stability that lays a foundation for healthy development. The role of housing has been well-established as a social determinant of health (Marmot, 2003). In high-income countries housing insecurity is generally considered within a typology that ranges from a lack of security due to financial challenges (housing affordability stress, difficulty paying rent/mortgage) through to its most severe form, homelessness (Amore et al., 2011). Housing affordability stress has been defined by the 30:40 indicator where a household with an income level in the bottom 40% of the income distribution is paying more than 30% of its income in housing costs (Mansour et al., 2022). Homelessness includes people who are unsheltered (e.g., living directly on the streets or in spaces not intended for habitation), living in emergency shelter (e.g., crisis housing, refuge), living in temporary accommodation (e.g., boarding houses), or living in insecure and/or inadequate housing (e.g., couch surfing, insecure tenancies, substandard housing where the tenure is short and not extendable) (Amore et al., 2011; Mansour et al., 2022). The Institute of Global Homelessness (2019) estimates over 1.6 billion people are inadequately housed each year.
The disruptive burden of housing insecurity, including its many drivers such as family violence, mental ill-health, and substance use, is likely to be profound, especially when experienced at developmentally critical periods such as young adulthood. Young adulthood is characterized by the completion of physical maturation, and continued development of cognitive, social and emotional maturity (Sawyer et al., 2018). Young adults move into increasingly independent educational and/or occupational roles with growing responsibilities and expectations around civic engagement, responsible and ethical behavior, and family formation (Scales et al., 2016; Wood et al., 2018). They are especially vulnerable to housing insecurity, which often occurs in the context of disruptive early life incidents including school leaving or significant life events that have disrupted engagement in normative developmental opportunities (e.g. early life adversities) (Heerde & Patton, 2020). In the United States approximately 1 in 10 young adults (ages 18–25) are reported to experience homelessness per year (Morton et al., 2020). Young adults 19–24 years (followed by those 25–34 years) report the highest proportion of homelessness (rate per 10,000 population) among those considered homeless in Australia (Australian Bureau of Statistics, 2023). Vulnerability to housing insecurity in young adulthood threatens safety, health and healthy development, social, educational, and economic participation, and opportunities to improve one’s quality of life across the life course (Coulter et al., 2020).
Although the impact of housing insecurity on health and vulnerability continues to receive international attention (Alidoust & Huang, 2023; Swope & Hernández, 2019), there is a gap in understanding about the upstream risk factors across key developmental periods that predict young adult housing insecurity (Morton et al., 2020). This gap extends to understanding where these risks sit within families, schools, peer networks and communities. Many studies are limited by poor data quality, are cross-sectional in nature, draw on data from Point-In-Time counts which measure the number of housed and/or unhoused young adults on a given night, or rely on historical/retrospective recall (Heerde & Patton, 2020; Obradović et al., 2009). These studies also lack comparison samples of participants not experiencing housing insecurity (Rugg & Burrows, 2002; Tyler & Schmitz, 2013; Wade & Dixon, 2006). This means that we currently do not have good data on which to act and drive prevention efforts. Nonetheless, findings across these studies suggest a broad set of correlates of insecure housing, including a history of residing in government care (Wade & Dixon, 2006), mental ill-health and substance use problems (Tyler & Schmitz, 2013), family disadvantage (Curry, 2017), multiple childhood housing transitions (Tyler & Schmitz, 2013), structural factors associated with social and welfare policies (Coulter et al., 2020), and higher levels of community-based poverty (Rugg & Burrows, 2002). As the experience of housing insecurity during young adulthood may disrupt critical developmental tasks and have profound effects on health and wellbeing, both effective prevention strategies for young adult housing insecurity and a clear understanding of its risk factors are needed.
Critical opportunities to generate understanding of the developmental upstream risk factors for housing insecurity are afforded through data collected within longitudinal population-based cohort studies that span multiple developmental timepoints (Coulter et al., 2020). The Australian Journeys Home project is one example of a population-based longitudinal study examining factors affecting housing stability. In that study, data were collected from a selected sample of predominantly adult participants (15–65+ years, with approx. 12% aged 15–17 years and 25% 18–24 years of age) exposed to high levels of housing insecurity (including homelessness) and receiving welfare support. First studied in late 2011, there have been five follow-up surveys conducted at six-monthly intervals through to mid-2014 (Scutella et al., 2013). Study findings of the factors associated with housing insecurity include adverse childhood experiences, substance use, poor mental health, a history of incarceration or criminal involvement, unemployment and lower educational attainment, as well as broader structural factors such as familial poverty, housing and labor markets (Cobb-Clark & Zhu, 2017; Scutella et al., 2013). These findings have not been explored in relation to key developmental periods before young adulthood, information which is needed to inform upstream prevention efforts that should begin well before any imminent risk for housing insecurity develops.
What is also required is evidence about the similarities and differences in risk for housing insecurity across international contexts in order to better understand what risks are universal or subject to differences by culture and jurisdictional policy variation (Jessor, 2008; Segall et al., 1998). Pathways to housing insecurity, and its disruptive burden may be experienced similarly in various countries (Heerde et at., 2022), though differences in regulatory, financial, social support systems and relative housing costs, mean that the degree of disruption likely varies from country to country.
In the current study we use data from the International Youth Development Study (IYDS), a large cross-national population-based cohort study. The IYDS is an ongoing prospective, longitudinal study investigating the epidemiology of health and behaviors among participants in Victoria, Australia, and Washington State, in the United States. These two states were originally chosen for their different policy environments around substance use while having many similarities around socio-demographic characteristics. In both countries, policy efforts to reduce housing insecurity at the population level are primarily focused on structural factors (economic drivers, housing supply). Prior analyses have shown distinct differences in health and behavioral outcomes, specifically higher underage alcohol use in Victoria and higher school suspension in Washington State, reflecting the different drug policy orientations in the two countries (harm minimization in Victoria, abstinence/zero tolerance in Washington State - e.g., Beyers et al., 2005; Heerde et al., 2022). We have also shown that the risk and protective processes related to these health and behavioral outcomes have been remarkably similar across the two countries (e.g., Hemphill et al., 2011; Toumbourou et al., 2014).
The purpose of the current study was to examine a range of adolescent risk and protective factors (predictors) for young adult housing insecurity. Two research questions were proposed: First, to what extent do adolescent risk and protective factors predict young adult housing insecurity? Second, is the predictive nature of these factors similar in Victoria, Australia, and Washington State in the USA?
Materials and Methods
Sample
Data were drawn from a population-based sample of young adult participants in the International Youth Development Study (IYDS). Participants were initially recruited as adolescents in state-representative secondary school samples in 2002 (average age 12-13 years, Year 7). Participants in both states have most recently been followed to 2018-19 (average age 29 years).
The original study design was subjected to several processes in 2001 to ensure cross-national validity and reduce methodological differences in data collection that have been identified in many prior international comparison studies (Beyers et al., 2005; Segall et al., 1998). The original IYDS sampling, recruitment, and survey methods have been previously described (McMorris et al., 2007) and include the matching of sampling, recruitment, and survey administration procedures, and cognitive pretesting and piloting of the survey (including language review and cross-national item adaptation). State-representative samples were achieved using a two-stage cluster sampling recruitment approach in 2002: (1) public and private schools with Years 5, 7 and 9 (youngest, middle and oldest cohorts, respectively) were randomly selected for recruitment into the study using a probability proportionate to grade-level size sampling procedure (Kish, 1965) and (2) one class at the appropriate grade level was randomly selected within each school (McMorris et al., 2007). In total, 7782 eligible students (3926 in Victoria) were approached to participate in the study. Of these, 2885 students (74.8%) in Washington State and 2884 students (73.5%) in Victoria consented to and took part in the 2002 survey. To ensure seasonal equivalences, annual surveys were conducted from February to June in Washington State and from May to November in Victoria. At the time of recruitment, both states were similar in population size and urbanicity, had higher than national levels of educational participation, and low proportions of residents living in poverty (McMorris et al., 2007).
This study analysed five waves of data collected from Year 7 in 2002 to Age 29 in 2018-19 (refer Figure 1). The analysis sample included 1947 young adults drawn from the middle cohort (53% female; n = 986 in Victoria). Most of the Victorian sample identified as Australian (91%) and most of the Washington State sample identified as being White (65%), followed by 16% Hispanic/Latinx, 4% African/American, 6% Native American, and 6% Asian/Pacific Islander. Participants reported their sexual orientation in young adulthood, with a similar proportion identifying as heterosexual (81% in Victoria, 79% in Washington State). Participants reported their current employment and educational status in 2018-19; 85% were employed. Study data collection, sample characteristics and retention. Note: WASH = Washington State, VIC = Victoria.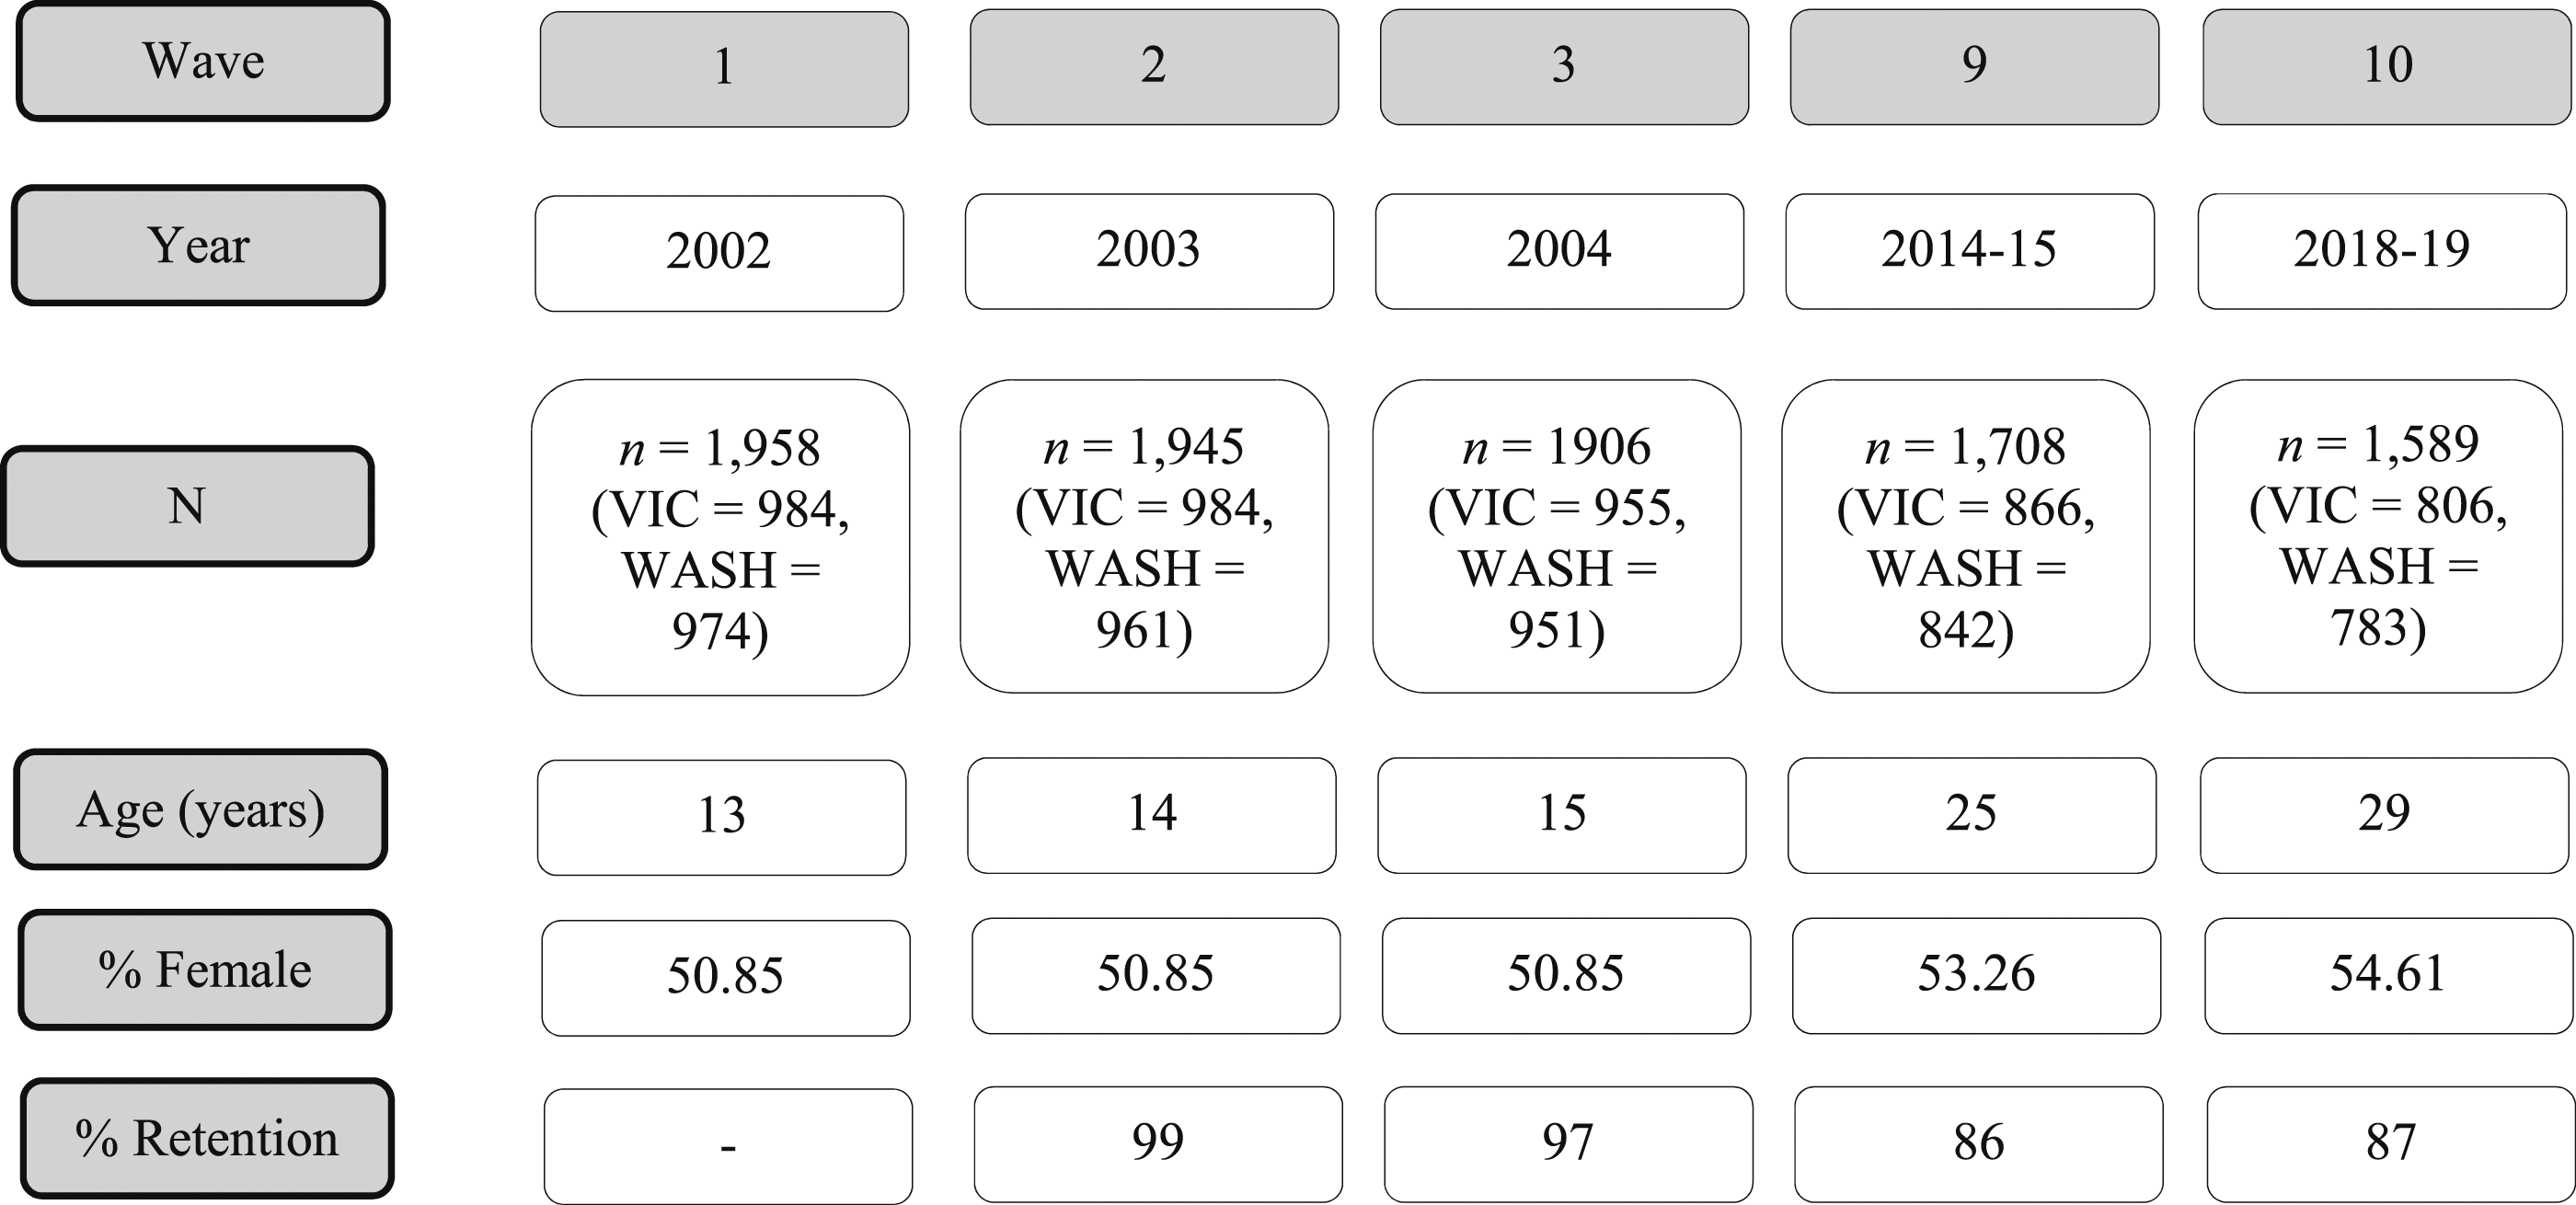
Procedures
In Australia, the University of Melbourne Human Ethics in Research Committee and the Royal Children’s Hospital approved the study. In the US, the University of Washington Human Subjects Institutional Review Board approved the study. Relevant educational authorities for public and private schools in both states provided permission to conduct the study in schools. In 2002, written parental consent and participant assent were obtained for all participants. Permission to conduct the study in schools was also provided by the relevant educational authorities for public and private schools in both states. Participant consent was obtained for both young adult waves of the survey. During formal schooling, surveys were administered to class groupings within schools. Young adult surveys were administered online. Surveys took 50–60 minutes to complete. During adolescence, Victorian participants received a small gift (e.g., stress ball) and Washington State participants received USD$10, at the completion of each survey. For the two young adult waves, participants from both states received a USD/AUD$40 gift voucher as reimbursement for their time completing the survey.
Measures
The IYDS used self-report measures adapted from the Communities That Care (CTC) youth survey (Arthur et al., 2002; Glaser et al., 2005). The survey measures were reviewed and adjusted to be developmentally appropriate as the sample aged from adolescence into young adulthood. Survey measures analysed in the current study have demonstrated longitudinal validity and reliability in the state-based samples (Heerde et al., 2022; Hemphill et al., 2011), and reflect risk and protective factors at multiple levels of the social-ecological model (i.e., individual, family, peer, school, community).
Age 25 and Age 29 Housing Insecurity
The items “In the past year, have you been homeless (i.e., not had a regular place to live)?” and “Which of the following best describes where you currently live?”, measured housing insecurity. Housing insecurity was scored as 1 (otherwise 0, securely housed) if respondents replied yes to having been homeless in the past year, or responded that they were, for example, currently ‘staying with friends temporarily’ or living in a ‘refuge/temporary accommodation,’ or ‘hotel/motel/caravan’. These items accurately reflect the forms of housing and homelessness described within the typology of housing insecurity commonly experienced among young adults (e.g., being unsheltered, couch surfing, residing in temporary accommodation) (Heerde et al., 2020).
Age 13–15 Individual Predictors
Early life adversity was measured retrospectively at age 29 using the traditional Adverse Childhood Experiences screener (Anda et al., 2007). Ten early life adversities were assessed including physical, sexual, and psychological abuse (perpetrated by a parent or adult); parental or adult substance use or mental health problems; incarceration of a household member; and loss of a biological parent (e.g., through death or divorce) (Cronbach’s α = .78). A sum score indexing the number of early life adversities experienced was formed (0–10) and then dichotomized to 1 (otherwise 0, reference group) if participants replied yes to experiencing any early life adversity event.
Six items were used to measure antisocial behavior, for example, “How many times in the past year (12 months) have you stolen something worth more than $5/10?” (Cronbach’s α = .60). The item “How many times in the past year (12 months) have you beat up someone so badly that they probably needed to see a doctor or nurse?” was one of two items measuring violent behavior (Cronbach’s α = .53). Participants reported arrests in response to the item “How many times in the last year (12 months) have you been arrested?”. Response options for the antisocial behavior, violent behavior and arrests items ranged from ‘never’ (1) through to ‘40+ times’ (8).
Impulsivity was measured using three items, for example, “I answer without thinking about it first.” (Cronbach’s α = .67). Response options for each of the three items ranged from ‘definitely, no’ (1) through to ‘definitely, yes’ (4).
Depressive symptoms were measured using the Short Mood and Feelings Questionnaire (Angold et al., 1995). Items were scored on a 3-point scale of “not true” (0), “sometimes true” (1), or “true” (2) (Cronbach’s α = .76). Item scores were summed to form a total depressive symptoms score (0–26), where higher scores indicated higher depressive symptoms.
Four items measured participants’ belief in the moral order (i.e., beliefs relating to honesty), including “I think it is okay to take something without asking if you can get away with it” (Cronbach’s α = .80). Response options for the four items ranged from ‘definitely, yes’ (1) through to ‘definitely, no’ (4).
Participants reported their current alcohol use in response to the item “In the past 30 days on how many occasions (if any) have you had more than just a few sips of an alcoholic beverage (e.g., beer)?”. The item was rated on an 8-point scale ranging from “never” (1) through to “40+ times” (8). Current use was rescored as 1 (otherwise 0, reference group) if participants indicated consuming alcohol on at least one occasion in the past month.
Age 13–15 Family Predictors
Participants reported conflict within their family using three items, such as “People in my family have serious arguments” (Cronbach’s α = .76). Poor family management strategies (e.g., parental monitoring, family rules, negative reinforcement) were assessed using nine items, for example “My family has clear rules about alcohol and drug use” (reversed; Cronbach’s α = .77). Attachment to parent(s) was assessed using four items of which “Do you feel very close to your mother/father?” and “Do you share your thoughts and feelings with your mother/father?” are examples (Cronbach’s α = .80). Three items measured opportunities for prosocial involvement, such as “My parents ask me what I think before most family decisions affecting me are made” (Cronbach’s α = .76). Response options for items within each of these four scales ranged from ‘definitely, yes’ (1) through to ‘definitely, no’ (4).
Age 13–15 Peer Predictors
Participants’ interaction with antisocial peers was measured using eight items (Cronbach’s α = .68), including “In the past year (12 months), how many of your best friends have stolen something worth more than $5/10?”. Four items, including “In the past year (12 months), how many of your best friends have used marijuana (pot, weed, grass)?” assessed friends’ use of drugs (Cronbach’s α = .77). The item “In the past year (12 months), how many of your 4 best friends have tried to do well in school” was one of two items measuring interaction with prosocial peers (r = .23). Response options for items comprising each scale ranged from ‘None of my friends’ (0) through to ‘4 of my friends’ (4).
Age 13–15 School Predictors
History of school suspension was measured by asking participants how many times in the past year they had been suspended from school. Response options ranged from ‘never’ (1) through to ‘40+ times’ (8). Academic underachievement was measured using two items, including “Putting them all together, what were your grades/marks like last year?” (Cronbach’s α = .85). Response options ranged from ‘very poor’ (4) through to ‘very good’ (1). Participants were asked about their commitment to school using seven items, such as “How often do you feel that the schoolwork you are assigned is meaningful and important?” (Cronbach’s α = .80). Response options for items ranged from ‘Never’ (5) through to ‘Almost always’ (1). Opportunities for prosocial involvement were measured using five items of which, “There are lots of chances for students in my school to get involved in sports, clubs, and other school activities outside of class.” is an example (Cronbach’s α = .65). Response options for each of the five items ranged from ‘definitely, no’ (1) through to ‘definitely, yes’ (4).
Age 13–15 Community Predictors
Low neighborhood attachment was measured using three items such as, “I’d like to get out of my neighborhood” (Cronbach’s α = .73). Community disorganization was measured using five items of which, “How much do each of the following statements describe your neighborhood: lots of empty or abandoned buildings” is an example item (Cronbach’s α = .75). Response options for the items comprising both scales ranged from “definitely yes” (1) through to “definitely no” (0). Rewards for prosocial involvement were assessed using three items, including “There are people in my neighborhood who encourage me to do my best” (Cronbach’s α = .75). Response options ranged from “definitely no” (0) through to “definitely yes” (1).
Demographic Factors
Participants reported their age (date of birth), sex (male, 0 or female, 1) and the state in which they lived (Washington State, 0 or Victoria, 1). Family socio-economic status combined measures of parent (mother and father) reported level of annual family income (ranging from ‘less than $10,000’ to ‘$200,000 and above’) and highest level of education (e.g., ‘less than secondary school’, ‘completed secondary school’, and ‘completed post-secondary school’) obtained in phone interviews with parents conducted in 2002. Scores ranged from 1 to 3.
Survey Response Accuracy
The accuracy of participants’ responses was measured during adolescence (ages 13, 14 and 15). Responses were coded as questionable if participants reported (1) “I was not honest all of the time” when asked how honest they were when completing the survey, (2) past month use of a fictitious drug included in the survey for accuracy checking, or (3) drug use on >120 occasions in the past month.
Statistical Analysis
The analyses were performed using Stata SE software for Windows, Version 15.1 (StataCorp LLC 2017). Participants with questionable responses during adolescence were excluded from the analyses (n = 15 at age 13 years, n = 35 at 14 years, and n = 27 at 15 years). The percentage of missing data across the analyzed variables ranged from 0 to 21.16% (M = 1.45%).
Tests of differences in means (t-tests) and frequencies (chi-square analyses) for adolescent predictors and young adult housing insecurity were examined. Pooled standard deviations were used to calculate effect sizes for state differences (Cohen, 1977). Zero order correlations were examined to show highly correlated pairs or sets of variables that may have resulted in collinearity in the subsequent multivariable analyses (Tabachnick & Fidell, 2013). To examine potential attrition bias, associations between attrition and demographic measures and housing insecurity were assessed using t-tests and chi-square analyses.
A series of logistic regression analyses were performed to examine predictive associations between adolescent risk and protective factors and insecure housing in young adulthood. Participant responses for each of the individual, family, peer-group, school, and community predictors were averaged to obtain a single scale score across ages 13–15 (Years 7, 8 and 9). These scores were then mean centered by subtracting the scale mean from its values. State-predictor interaction variables were calculated by multiplying each centered predictor by the state variable (coded 0 “Washington State” and 1 “Victoria”).
As a first step, bivariable models assessed each of the independent predictors (individual, family, peer-group, school, and community risk and protective factors) regressed separately onto young adult housing insecurity. Non-significant associations were dropped from further modelling (except for demographic variables). Next, adjusted multivariable models were estimated. Independent predictors were grouped by domain and entered in the analysis by group. To conduct the most conservative test possible, independent predictors were grouped from most to least proximal according to their influence on the individual (i.e., individual, family, peer group, school, and community predictors). Demographic factors (gender, state, age, and family socio-economic status) were included as controls in all stages of the modelling.
The moderating role of state, using state-predictor interaction variables, was examined in the final model. To present the most parsimonious model with the least assumptions, the final multivariable model included the addition of statistically significant state-predictor interaction terms.
Results
Attrition Analyses
Retention of individuals reporting housing insecurity from age 25 to age 29 was high (85%, ꭓ2 = 0.676, p = .411). There were significant effects for sex (ꭓ2 = 20.03, p < .001) and state (ꭓ2 = 9.601, p = .002) such that female participants and those from Washington State were more likely to be retained at age 29. There was no significant effect of age (t = 1.712, p = .087) or childhood family socio-economic status (t = −0.639, p = .523) on retention from age 25 to age 29.
Descriptive Statistics
Summary Statistics and Tests of State Differences for Age 13–15 Predictors and Young Adult Housing Insecurity.
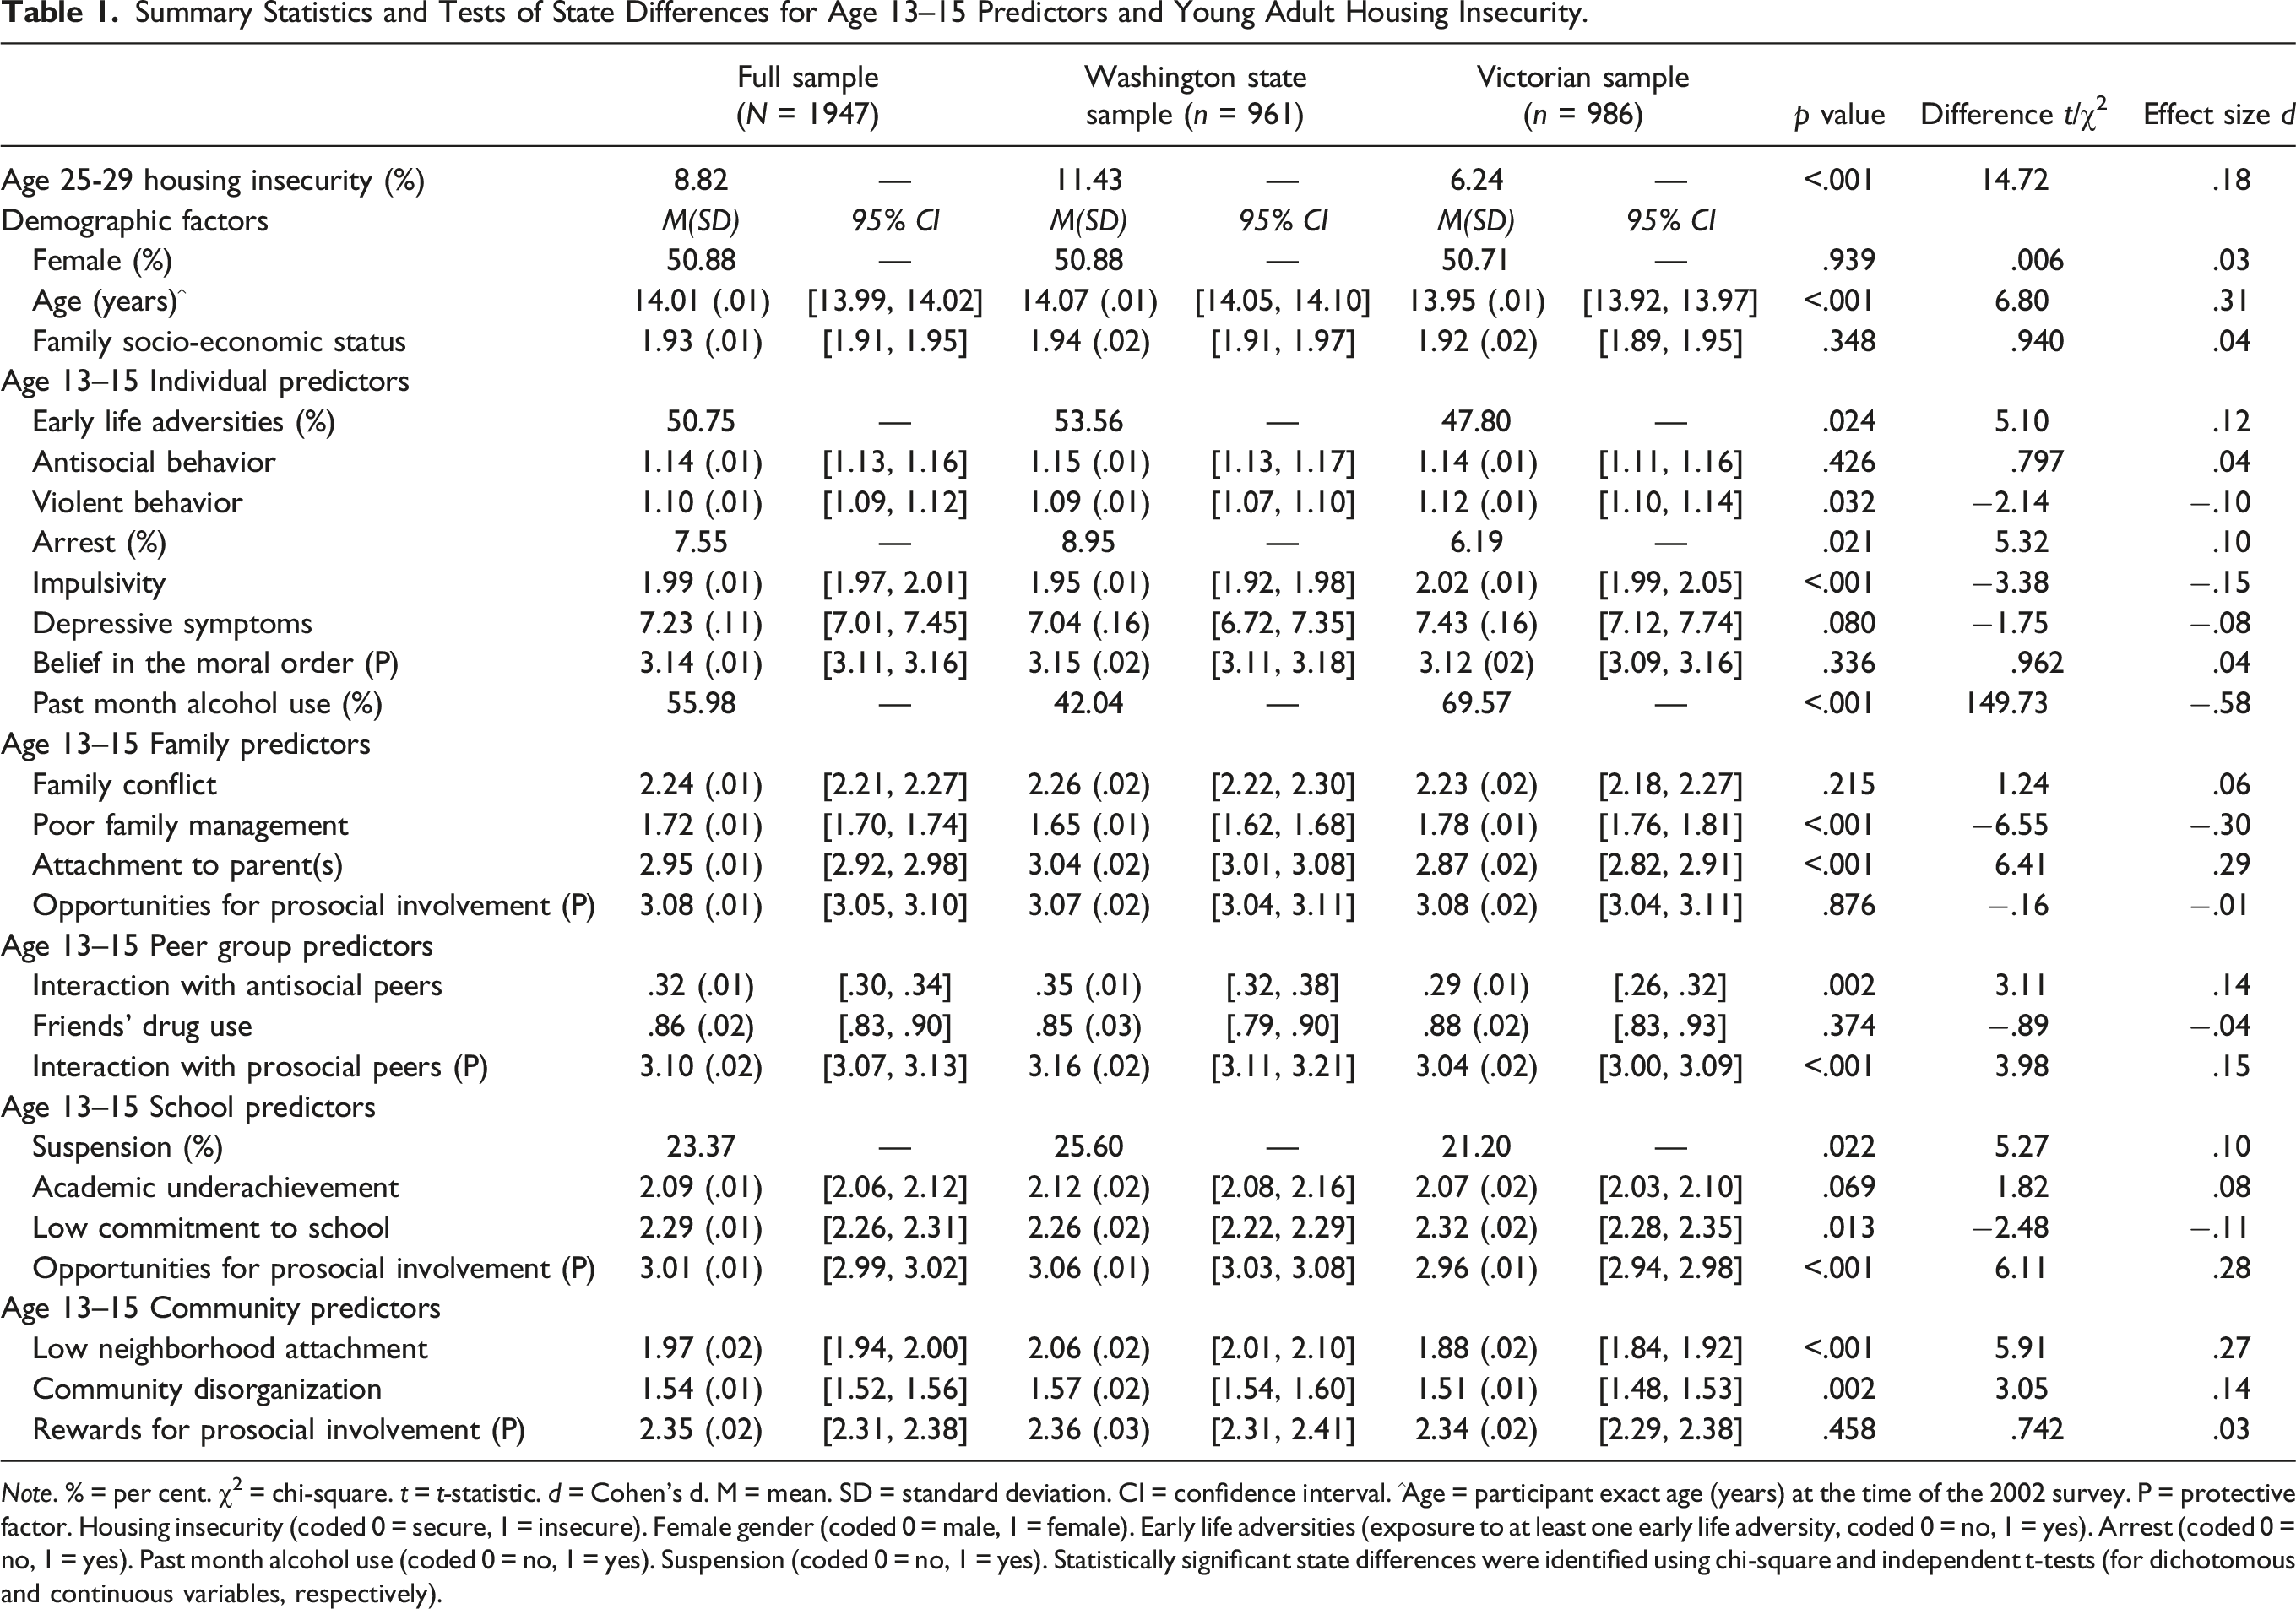
Note. % = per cent. χ2 = chi-square. t = t-statistic. d = Cohen’s d. M = mean. SD = standard deviation. CI = confidence interval. ^Age = participant exact age (years) at the time of the 2002 survey. P = protective factor. Housing insecurity (coded 0 = secure, 1 = insecure). Female gender (coded 0 = male, 1 = female). Early life adversities (exposure to at least one early life adversity, coded 0 = no, 1 = yes). Arrest (coded 0 = no, 1 = yes). Past month alcohol use (coded 0 = no, 1 = yes). Suspension (coded 0 = no, 1 = yes). Statistically significant state differences were identified using chi-square and independent t-tests (for dichotomous and continuous variables, respectively).
Intercorrelations among study variables were low-moderate and in the expected direction (range r = −0.60 to r = .78; see online supplemental material Table 1). Housing insecurity was most strongly correlated with having been arrested in the past year, early life adversities, antisocial behavior, interaction with antisocial peers and engaging with friends who use drugs.
Adolescent Predictors of Housing Insecurity in Young Adulthood
Bivariable and Multivariable Logistic Regression Models Investigating Age 13–15 Predictors of Young Adult Housing Insecurity.
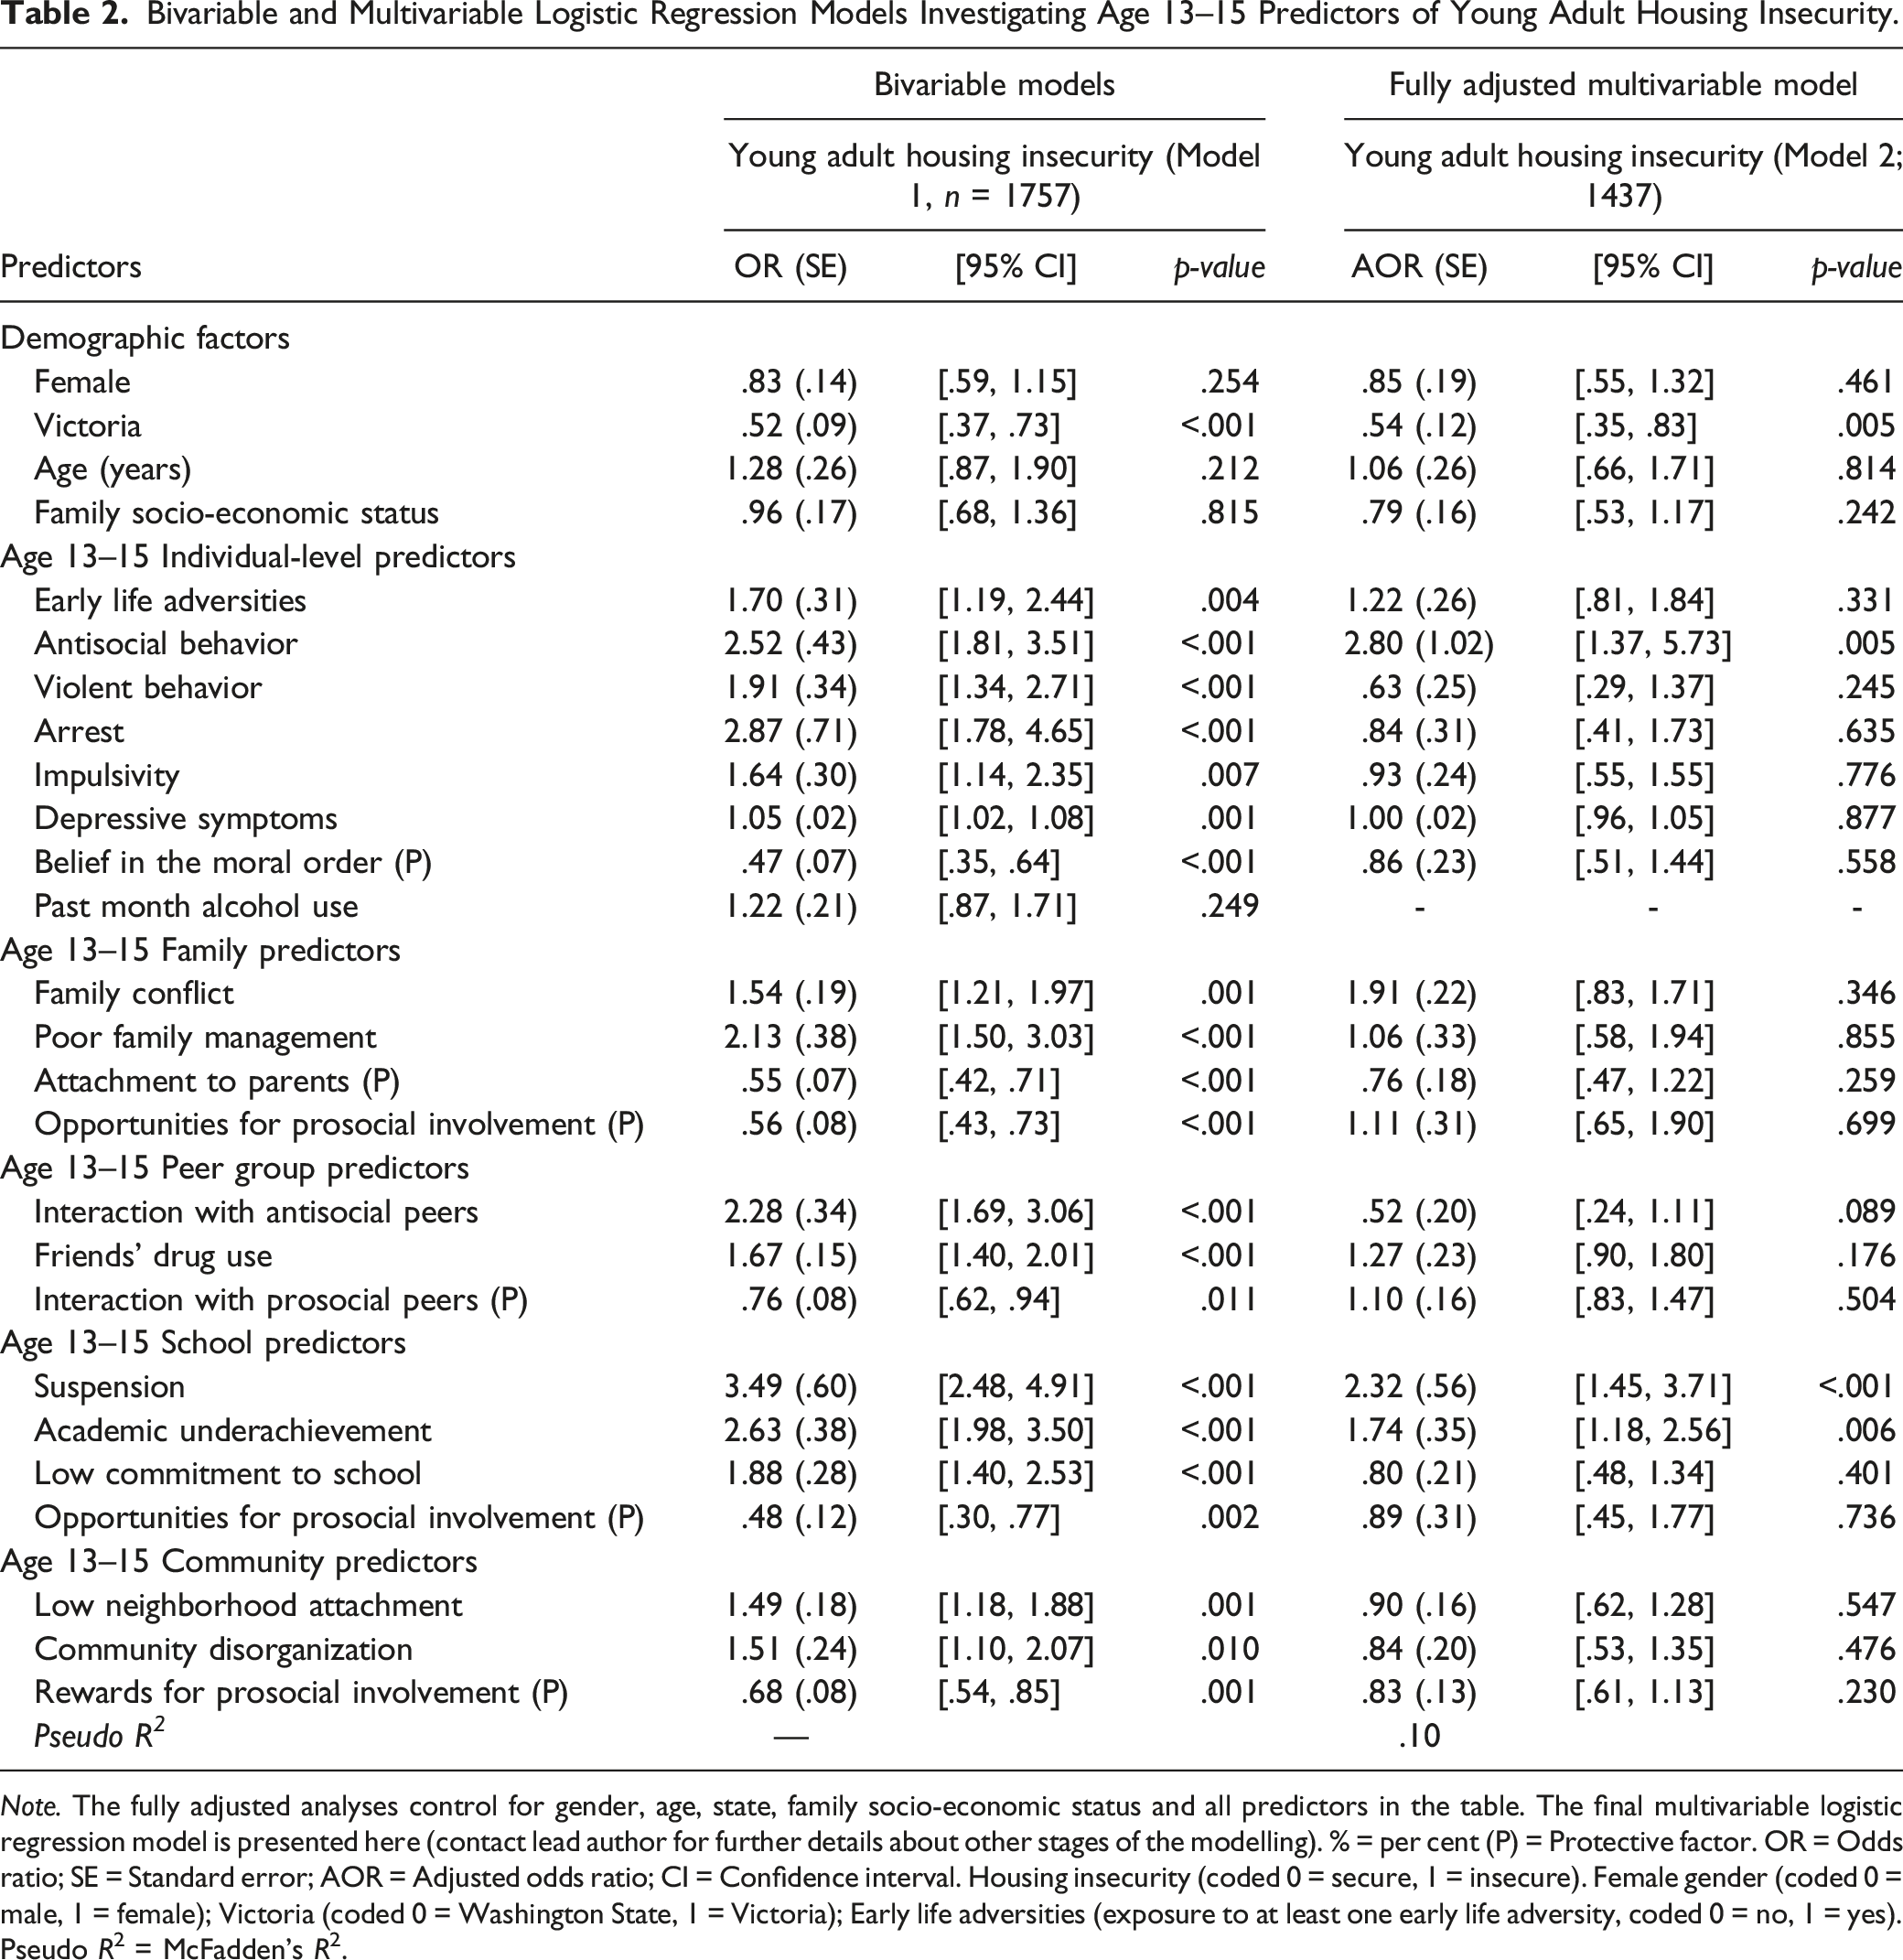
Note. The fully adjusted analyses control for gender, age, state, family socio-economic status and all predictors in the table. The final multivariable logistic regression model is presented here (contact lead author for further details about other stages of the modelling). % = per cent (P) = Protective factor. OR = Odds ratio; SE = Standard error; AOR = Adjusted odds ratio; CI = Confidence interval. Housing insecurity (coded 0 = secure, 1 = insecure). Female gender (coded 0 = male, 1 = female); Victoria (coded 0 = Washington State, 1 = Victoria); Early life adversities (exposure to at least one early life adversity, coded 0 = no, 1 = yes). Pseudo R2 = McFadden’s R2.
Discussion
The current study identified that almost one in ten (8.82%) young adults had experienced insecure housing, with a higher prevalence in Washington State (11.43%) than in Victoria (6.24%). Such a high prevalence is concerning, especially given the well described intersections of housing insecurity with health and social inequity (Marmot, 2003; Swope & Hernández, 2019) and knowledge that insecurely housed young adults are likely to experience disruption to developmental transitions that are vital for healthy adult functioning (Coulter et al., 2020; Heerde & Patton, 2020). This reinforces the importance of research that informs our understanding of the developmentally relevant factors that contribute to insecure housing in young adulthood, with the goal of influencing policy frameworks earlier in the life course.
The current study is one of very few that have prospectively examined these factors from adolescence to young adulthood using data collected from a cross-national, population-based sample. Models showed that living in Washington State compared to Victoria, engaging in antisocial behavior, history of school suspension and academic underachievement in adolescence were longitudinally and uniquely associated with greater risk for housing insecurity in young adulthood. State differences in the prevalence of insecure housing may be explained by differences in cultural and economic contexts, such as the cost of food, housing and other essential commodities; size of social safety nets; and level of funding for housing and social investments. Likewise, it is possible that the impacts of school suspension might differ given differences in school-based drug policy orientations in the two countries (harm minimization in Victoria, abstinence/zero tolerance in Washington State). In fact, we found that the prevalence of suspension and insecure housing were higher in Washington State than in Victoria, and that a history of school suspension was also more closely linked to later housing insecurity in Washington State. Although our results show a similar cross-national profile of adolescent risk factors suggesting that similar prevention strategies may be effective in both countries, further cross-national investigation to identify state and country policy differences that influence insecure housing exposure is required.
The finding that antisocial behavior, academic underachievement, and a history of school suspension were uniquely associated with young adult housing insecurity is important in the context of how few prior longitudinal population-level studies have sought to identify individuals before they are at high risk of being insecurely housed. Prior cross-sectional and retrospective studies have suggested young people who experience housing insecurity report engagement in antisocial behaviors (Tucker et al., 2022) and disrupted educational pathways (e.g., Heerde et al., 2020; Robinson, 2021). This can include school-behavior management responses (e.g., suspension from school in response to student misbehavior) and student behavioral and emotional disengagement from school (e.g., disinterest in academic tasks leading to lower academic achievement). The nature of housing insecurity also creates personal, social, and educational vulnerability, resulting in layers of risk to adolescents. These risks reduce adolescents’ capacity to engage in learning opportunities and activities, contributing to early and permanent disengagement from education (Heerde et al., 2020; Obradović et al., 2009; Robinson, 2021) and heightening inequality stemming from educational setbacks (Lancet Public Health, 2020).
This study also tested where risks for young adult housing insecurity may sit within families, schools, peer networks and communities. At the bivariable level, most adolescent predictors were associated with later insecure housing, and did not maintain statistical significance in the multivariable model. We do not interpret this to mean that these are not important risk or protective factors. A small number of prospective, population-based longitudinal studies have examined risk for young adult housing insecurity. These studies have identified various adolescent predictors including poorer family relationship quality, school adjustment problems, early life adversities, victimization, family socioeconomic difficulties, poor mental health (e.g., depression), and substance use and misuse (Brakenhoff et al., 2015; Coulter et al., 2020; Curry, 2017; Shelton et al., 2009; van den Bree et al., 2009). Prior analyses using data from the IYDS have shown poorer family management strategies and higher family conflict in adolescence increased risk for young adult homelessness with these associations mediated by peer, school, and community risk factors (Heerde et al., 2022). In the same way, it may be that other risks within families, peer networks and communities affect the three predictors identified in the current study (antisocial behavior, academic underachievement and suspension) and thus are indirectly related to young adult housing insecurity. Future longitudinal studies using population-based cohorts should seek to confirm the current findings and identify risk (and protective) factors in other potential spheres of influence.
These findings have potential implications for school-behavior management policies. The use of suspension as a behavior management tool, although used in both Washington State and Victorian school contexts, is reflected in zero tolerance policies to misbehavior that are more common in the United States (Hemphill et al., 2014). Few longitudinal studies have sought to estimate associations between adolescent risk across family, school, peer and community contexts, such as antisocial behavior or school-level factors such as suspension and forms of housing insecurity (Brakenhoff et al., 2015; Heerde et al., 2022; Shelton et al., 2009; van den Bree et al., 2009). We have been unable to locate any studies examining the extent to which place-based factors within the school environment, such as school discipline policies, are associated with pathways to housing insecurity among young adults. Undoubtedly, school-behavior management policies are important to ensure a safe learning environment however should be balanced with knowledge of potential longer-term risks, such as the later risks of young adult housing insecurity that can arise in the context of school exclusion and educational underachievement (Kahlmeter, 2021).
Ideally, school-based behavior management approaches (as underlying policies) should promote and protect students’ health and wellbeing in the context of a safe and inclusive learning environment. This would include identifying early indicators of housing risk and limiting punitive disciplinary methods such as suspension from school for misbehavior (Heerde et al., 2023). For instance, approaches including health-promoting schools (HPS; World Health Organization, 2021), Comprehensive School Health programs (American School Health Association, 1995), and the Whole School, Whole Community, Whole Child model (Centers for Disease Control and Prevention, 2023) are whole-school frameworks for integrating education and health goals. More specifically, the HPS approach, founded on the principles and perspectives of health equity and embedded within a life course approach, provides a framework for supporting adolescent development, education and health, given it encompasses the spectrum of responses that range from promotion, prevention, and acute responses to ongoing needs including behavioral and welfare support as well as access to health services (Sawyer et al., 2021; World Health Organization, 2021). There is potential within this type of model to reduce risk factors for housing insecurity such as suspension, academic underachievement and antisocial behavior.
Study Strengths and Limitations
This study has several strengths. It capitalizes on a unique opportunity to examine a wide range of predictors of housing insecurity, measured across the formative years from adolescence to young adulthood, cross-nationally. The analyses were conducted using longitudinal data from a population-based sample which was representative of Victoria and Washington State in 2002, providing the opportunity for within-study replication of results. Studies such as this are rare, particularly those exploring housing insecurity as done here, despite their benefits to inform policy and identify targets (including timing) for preventive interventions that aim to support healthy adolescent and young adult development, as well as school engagement. Study retention rates have remained high. Although participants experiencing housing insecurity are a high-risk group for attrition, retention of individuals reporting housing insecurity was also high.
Several limitations are also acknowledged. The prevalence of young adult housing insecurity, while relatively high within our state representative samples, is likely to underestimate the size of the problem. For example, at the time of recruitment, both states had low proportions of residents living in poverty (McMorris et al., 2007). Our measure of housing does not capture housing insecurity that may have occurred before age 25. Our use of multivariable regression in this study means that we have only been able to identify those adolescent factors that were uniquely associated with housing insecurity in young adulthood. Consequently, our capacity for understanding the temporal or mediational relationships among variables was restricted. A critical next step is to understand the complex and potentially interacting longitudinal relationships between risk and protective factors and housing insecurity across adolescence and into young adulthood, and how these factors increase or moderate risk for insecure housing and related outcomes using life-course epidemiological analyses (e.g., causal inference analyses; Sobel, 2000). This should also include further analysis of how state context differences may drive differences in housing security. Participants were not asked about their gender identity beyond the binary question of male or female in adolescence, consistent with approaches at the time of the surveys. High proportions of participants identified as completely heterosexual (>90% in both states), and as White (in Washington State) and Australian (in Victoria). Thus, our analyses did not control for, or examine differences in associations, by sexual orientation or gender identity, race, or ethnicity. Lastly, our findings are generalizable only to the state and cohort samples analyzed.
Conclusion
Housing insecurity among young adults is associated with health and social inequities. The current study is unique in its examination of adolescent predictors of young adult housing insecurity using longitudinal data from a cross-nationally matched population-based sample of young adults. Housing insecurity was higher for young adults in Washington State, highlighting the important influence of state and national policies. Antisocial behavior, a history of school suspension and academic underachievement in adolescence were associated with insecure housing in young adulthood which were similar in both countries. The continued analysis of cross-national longitudinal data should explore state policy differences and risk and protective processes within the social-ecological contexts in which children and adolescents interact to identify population-level upstream risk factors for housing insecurity that can be targeted at the earliest possible point in the life course through prevention and intervention efforts.
Supplemental Material
Supplemental Material - Predictors of Housing Insecurity in Young Adulthood
Supplemental Material for Predictors of Housing Insecurity in Young Adulthood in Employment-Entrepreneurship Transitions by Jessica A. Heerde, Jennifer A. Bailey, Barbara J. McMorris, George C. Patton, Susan M. Sawyer and John W. Toumbourou in Emerging Adulthood.
Footnotes
Acknowledgements
We acknowledge and pay respect to the passing of our cherished colleague, mentor, and friend Professor George C Patton. The authors wish to express their appreciation and thanks to project staff and participants for their valuable contributions to the project.
Declaration of Conflicting Interests
The author(s) declared no potential conflicts of interest with respect to the research, authorship, and/or publication of this article.
Funding
The author(s) disclose receipt of the following financial support for the research, authorship, and/or publication of this article. A/Prof Heerde receives salary and research support from a National Health and Medical Research Council (NHMRC) Investigator Grant (GNT2007722). She holds a Dame Kate Campbell Fellowship awarded by the Faculty of Medicine, Dentistry and Health Sciences (MDHS) at The University of Melbourne. Her early work on this study was supported by a Momentum Fellowship from the MDHS at the University of Melbourne, the Department of Paediatrics at the University of Melbourne and the Centre for Adolescent Health, Royal Children’s Hospital. Professor Patton was supported by a NHMRC Investigator Grant (GNT1196999). Professor Susan Sawyer is supported by the Geoff and Helen Handbury Chair of Adolescent Health, Department of Paediatrics, The University of Melbourne and an NHMRC Investigator Grant (GNT1196999). The authors are grateful for the financial support of the National Institute on Drug Abuse (R01DA012140), National Institute on Alcoholism and Alcohol Abuse (R01AA025029), NHMRC (GNT491241, GNT594793, GNT1047902) and Australian Research Council (DP109574, DP0663371, DP0877359). The content is solely the responsibility of the authors and does not necessarily represent the official views of the funders.
Transparency and Openness Statement
The raw data, analysis code, and materials used in this study are not openly available but are available upon request to the corresponding author. No aspects of the study were pre-registered.
Supplemental Material
Supplemental material for this article is available online.
Author Biographies
References
Supplementary Material
Please find the following supplemental material available below.
For Open Access articles published under a Creative Commons License, all supplemental material carries the same license as the article it is associated with.
For non-Open Access articles published, all supplemental material carries a non-exclusive license, and permission requests for re-use of supplemental material or any part of supplemental material shall be sent directly to the copyright owner as specified in the copyright notice associated with the article.