
Abstract
Background: The food truck industry has rapidly expanded in the United States and kitchen environments can contain harmful contaminants from cooking emissions. The objective of this study was to examine the levels of aldehydes, polycyclic aromatic hydrocarbons (PAHs), and Particulate Matter (PM)2.5 generated from cooking process in food trucks. Methods: Area sampling was performed twice at two participating food trucks during work shifts. Nine aldehydes and eighteeen PAHs were analyzed according to the relevant standard methods while PM2.5 was measured with a real time monitor. Ventilation performance of the food truck exhaust hoods was also investigated using a thermal anemometer. Findings: Formaldehyde was the only aldehyde detected in all samples with a concentration range of 7.16 to 53.68 µg/m3. No PAHs were detected above the limit of quantification. Average PM2.5 concentrations ranged from 0.65 to 7.03 mg/m3. Food Trucks 1 and 2 have an average exhaust flow rate of 211 and 215 L/s per linear meter of hood, respectively. Conclusions/Application to practice: Overall, Food Truck 2 had consistently higher levels of aldehydes and PM2.5 with comparable ventilation performance as Food Truck 1. The higher exposure levels of Food Truck 2 could possibly be attributed to a larger volume of food orders and the heavy duty cooking equipment with an exhaust flow rate below the American Society of Heating, Refrigerating and Air-Conditioning Engineers (ASHRAE) recommendations. Although more investigations need to be performed, the findings could be used to raise awareness of food truck workers and health practitioners to reduce potential exposure risks.
Keywords
Background
The term “cooking fumes” is generally used to describe visible emissions generated by the cooking process with oil, although all of these emissions are not technically considered “fumes” in occupational hygiene (International Agency for Research on Cancer [IARC], 2010). Cooking fumes called hereinafter cooking emissions, especially from frying, typically contain fine particles (≤aerodynamic diameter of 2.5 µm, that is, Particulate Matter [PM]2.5) and ultrafine particles (UFP ≤0.1 µm; IARC, 2010; Singh et al., 2016). Organic compounds such as polycyclic aromatic hydrocarbons (PAHs) and heterocyclic amines can be deposited on the surface of the particles and certain vaporized or gaseous PAHs and aldehydes are also emitted (IARC, 2010). Emissions from high-temperature frying have been classified as Group 2A (probably carcinogenic to humans) by the IARC (IARC, n.d). Cooking emissions have shown mutagenic activity and among the compounds identified as mutagenic are PAHs, higher aldehydes, and heterocyclic amines (H. Chen et al., 1992; Sjaastad et al., 2010).
Commercial cooking has been reported as an important source of ambient particle emissions (Allan et al., 2010; Gysel et al., 2018; Sun et al., 2011) and cooking emissions contain a significant amount of fine particles, PM2.5 (Pei et al., 2016; Robinson et al., 2006). Emission of approximately 79,000 tons/year of PM2.5 in the United States was estimated from commercial cooking activities with underfired-charbroiling processes accounting for 74% of the total PM2.5 emission (Roe et al., 2005). The emission rate and characteristics of cooking aerosol vary depending on many factors such as ingredients, temperature, stove type, oil type, and cooking method (Amouei Torkmahalleh et al., 2017; Lin et al., 2019; See & Balasubramanian, 2008; Zhang et al., 2010). PM2.5 are of great concern as they are small enough to penetrate deep into the lungs and cause irritation and damage of the alveolar wall, impairing lung function (Xing et al., 2016). The association between fine particles and adverse health effects has long been reported (Allan et al., 2010) and cohort studies have observed that cardiovascular mortality was associated with PM2.5 (Dockery et al., 1993; Pope & Dockery, 2006; Pope et al., 1995, 2004).
Aldehydes, organic compounds containing a carbonyl functional group, are generated when fatty acids are degraded. In general, saturated fats are found in animal products and tropical oils such as coconut and palm (Marcus, 2013). Most plant origin oils and fats are high in unsaturated fatty acids (Kostik et al., 2013). Studies have shown that aldehydes emission is related to fatty acid composition of the cooking oils and cooking temperature (Fullana et al., 2004a; Wu et al., 2019). Fats and oils used during deep frying at elevated temperatures in atmospheric oxygen are subject to oxidation (Fullana et al., 2004b) and vegetable oils containing high polyunsaturated fatty acids are more susceptible to oxidation than oils containing high saturated fatty acids (Da Silva & Pereira, 2008). Large amounts of aldehydes have been found in the headspace of a flask in which cooking oil and food were heated (Yasuhara & Shibamoto, 1989, 1991; Zhu et al., 2001). A variety of aldehydes such as acetaldehyde, hexaldehyde, heptaldehyde, acrolein, 2-hexenal, 2-heptenal, and 2,4-heptadienal was found in emissions from heated vegetable oils (Fullana et al., 2004b; Katragadda et al., 2010; Zhu et al., 2001). Formaldehyde, acetaldehyde, propionaldehyde, butyraldehyde, valeraldehyde, hexaldehyde, heptaldehyde, caprylaldehyde, pelargonaldehyde, and capraldehyde were identified in volatiles from overheated/heated beef and pork fat (Umano & Shibamoto, 1987; Yasuhara & Shibamoto, 1989). Most aldehydes are reactive species and many have been reported having cytotoxic, mutagenic, and carcinogenic effects (Ahmed Laskar & Younus, 2019; Lindahl, 1992). For example, acetaldehyde is a probable carcinogen to humans and formaldehyde is carcinogenic to humans by the IARC classification (IARC, n.d).
PAHs are hydrocarbons produced by pyrolysis or incomplete combustion of organic materials and food processing such as smoking, grilling, and roasting over open fires or charcoal (Chung et al., 2011). Food products such as vegetables, fruits, and oils could be also contaminated with PAHs through environments (de Vos et al., 1990; Rojo Camargo & Toledo, 2003) while some PAHs are added to the food products as food additives such as smoking flavor and glazing agents (Chung et al., 2011). A variety of PAHs including naphthalene, acenaphthene, acenaphthylene, fluorene, phenanthrene, anthracene, fluoranthene, pyrene, benzo[a]anthracene, chrysene, benzo[b]fluoranthene, benzo[k]fluoranthene, benzo[a]pyrene, indeno[1,2,3-cd]pyrene, dibenzo[a,h]anthracene, benzo[g,h,i]perylene was detected in meat/meat products and oils/fats (Martorell et al., 2010; Yabiku et al., 1993). Many PAHs have shown cytotoxic and carcinogenic effects (B. H. Chen et al., 1996). Benzo[a]pyrene is a known human carcinogen and benzo[a]anthracene, benzo[k]fluoranthene, chrysene, dibenzo[a,h]anthracene, indeno[1,2,3-cd]pyrene, and naphthalene are possible or probable human carcinogens (IARC, n.d).
Many studies have focused on the contaminant emissions from food or individual ingredients rather than the entire cooking process and environment. Fewer studies have been conducted on the emissions from cooking processes in commercial (Lewné et al., 2017; Sjaastad & Svendsen, 2009; Vainiotalo & Matveinen, 1993; Wu et al., 2019) and laboratory environments (Jørgensen et al., 2013; Sjaastad et al., 2010; Svendsen et al., 2002). There are no comprehensive studies on cooking emissions in food truck environments while the food truck industry in the United States has rapidly expanded with an average of 6.8% annually over the past 5 years (IBISWorld, 2019). Therefore, there is a need to examine this specific occupational environment in which various thermal appliances are used in a very limited space often without periodic ventilation performance tests. To the best of our knowledge, this is the first study to report on the status of food truck environments. The aim of this pilot study was to investigate the levels of the contaminants generated through the cooking process within food trucks, including PM2.5, nine aldehydes, and eighteen PAHs commonly found in cooking emissions. In addition, velocity measurements of food truck exhaust hoods were conducted to evaluate the performance of the ventilation systems.
Methods
Recruitment
Food trucks operators which conduct business at popular breweries in the Birmingham, Alabama metropolitan area were directly solicited for participation. Two food trucks in which cooking mainly involved frying of meat with expected emissions of PM2.5, aldehydes, and PAHs agreed to participate in the study. The first food truck (hereinafter Food Truck 1) was a trailer type and the second food truck (hereinafter Food Truck 2) was a mobile kitchen van with a kitchen and driver cab. Food Truck 1 had a menu consisting of chicken wings; fried/grilled chicken sandwich; bacon, lettuce, and tomato (BLT) sandwich; onion rings; nachos; and chips and dip. Food Truck 2 had chicken wings, french fries, BBQ sandwich, rice bowl, and beans. Food Truck 1 used two different cooking appliances, gas griddle and gas fryer, and Food Truck 2 used five different cooking appliances, gas griddle, gas underfired broiler, gas hot-top range, gas fryer, and electric rice cooker. Both food trucks were equipped with a backshelf hood typically used in mobile kitchens to allow head clearance.
Sampling
Area sampling was performed for PM2.5, aldehydes, and PAHs, and all sampling devices were placed approximately 15 cm from the right end of the ventilation hood to avoid turbulent flow from the ventilation hoods. Sampling device inlets were approximately at the height of the breathing zone of the workers to simulate personal exposure, approximately 10 to 15 cm below from the bottom edge of the hood filter bank and 35 to 40 cm above the cooking surface depending on the hood and cooking appliance configuration of each food truck. Sampling was performed twice (i.e., 2 days) at each food truck and sampling days were chosen between Friday and Saturday when a higher volume of cooking was expected. At the end of each shift, a list of all the orders prepared over the course of the work shifts was compiled.
PM2.5
PM2.5 was measured using a DustTrakII Aerosol Monitor (8530, TSI, Shoreview, MN) with a PM2.5 impactor inlet. A 0.6-cm diameter tubing was attached to the inlet of the monitor suspended at the similar height as the aldehydes and PAH samplers (i.e., around the breathing zone). Sampling durations were 3 hours on Day 1 and 3 hours and 39 minutes on Day 2 for Food Truck 1, and 3 hours on Day 1 and 4 hours and 38 minutes on Day 2 for Food Truck 2. Measurements were recorded every 30 seconds during the sampling period. The sampling durations on the second days for each truck represented the whole work shift while the sampling on the first days stopped earlier than the work shift.
Aldehydes
Passive monitors (AL-50) from Advanced Chemical Sensors (Boca Raton, FL) were used to measure the nine aldehydes including formaldehyde, acetaldehyde, propionaldehyde, butyraldehyde, benzaldehyde, glutaraldehyde, hexaldehyde, o-phthalaldehyde, and crotonaldehyde. Sampling durations were 4 hours and 29 minutes on Day 1 and 3 hours and 28 minutes on Day 2 for Food Truck 1, and 4 hours and 50 minutes on Day 1 and 4 hours and 33 minutes on Day 2 for Food Truck 2. A field blank was used in each sampling session and the blank samples were opened for a very short period of time in the same sampling environment around the sampling location and then immediately sealed. After each work shift, the field and field blank samples were packed and sent to Advanced Chemical Sensors (AIHA accreditation #102047) for analysis. The samples were analyzed based on National Institute for Occupational Safety and Health (NIOSH) 2018, NIOSH 2016, EPA 8315A, and Occupational Safety and Health Administration (OSHA) 64 analytical methods using high-performance liquid chromatography (HPLC) with a ultraviolet (UV) or UV/vis detector. The limit of quantification (LOQ) provided by the laboratory varied by analyte and day of analysis (see the results).
PAHs
The PAHs samplers were purchased from SGS Galson (Syracuse, NY) and the eighteen PAHs analyzed were 1-methylnaphthalene, 2-methylnaphthalene, acenaphthene, acenaphthylene, anthracene, benzo[a]anthracene, benzo[a]pyrene, benzo[b]fluoranthene, benzo[g,h,i]perylene, benzo[k]fluoranthene, chrysene, dibenzo[a,h]anthracene, fluoranthene, fluorene, indeno[1,2,3-cd]pyrene, naphthalene, phenanthrene, and pyrene. A 37-mm filter cassette with a PTFE filter (2-µm pore size) for the particulate phase PAHs was connected to an Amberlite XAD sorbent tube (ORBO 43 Supelpak) for the vapor phase PAHs. The sampling flow rate was set at 2.0 L/min using a pump (Gilian GilAir Plus, Sensidyne, St. Petersburg, FL). Sampling durations were the same as for the aldehyde samples: 4 hours and 29 minutes on Day 1 and 3 hours and 28 minutes on Day 2 for Food Truck 1, and 4 hours and 50 minutes on Day 1 and 4 hours and 33 minutes on Day 2 for Food Truck 2. A field blank for both the filter and sorbent tube was used during each sampling session and the blank samples were opened for a very short period of time in the same sampling environment around the sampling location and then immediately sealed. After each work shift, the field and field blank samples were packed in a cooler with an ice pack and sent to SGS Galson for analysis. The analytical method used was NIOSH 5505 using HPLC with a UV detector. The LOQ reported by the laboratory was 0.3 µg for all PAHs.
Ventilation
Both food trucks used a backshelf hood with a number of baffle filters and discrete velocity point measurements were taken at the baffle filter surface of the ventilation hood based on the American Society of Heating, Refrigerating and Air-Conditioning Engineers (ASHRAE 1376-RP; Kuehn et al., 2010). The dimensions of the entire filter bank in each truck were measured and the filter bank area was split into equal areas (Supplemental Figures 1 and 2). Filter bank dimensions of Food Truck 1 were 1.524 m × 0.457 m, which allowed division into 30 squares of 15.24 cm × 15.24 cm area (10 × 3 matrix). Food Truck 2 had filter bank dimensions of 2.286 m × 0.330 m, allowing division into 30 rectangles of 15.24 cm × 16.51 cm area (15 × 2 matrix). Velocity was measured in the middle of each area using a thermal anemometer (VelociCalc 9565, TSI, Shoreview, MN). Each velocity measurement was performed for 10 seconds, and measurements at each grid center were made in triplicate and averaged. A 5-cm piece of tape was attached to the end of the thermal anemometer probe to ensure that all measurements were taken with a 5-cm standoff distance as recommended by ASHRAE RP-623 (Eliott & Gordon, 1994).
Results
Food Orders
The number of food orders during the sampling periods are shown in Table 1. For Food Truck 1, there was a total of 23 orders and 29 orders taken during Day 1 and Day 2, respectively. For Food Truck 2, there was a total of 51 orders and 58 orders taken during Day 1 and Day 2, respectively.
Numbers of Food Orders by Food Truck
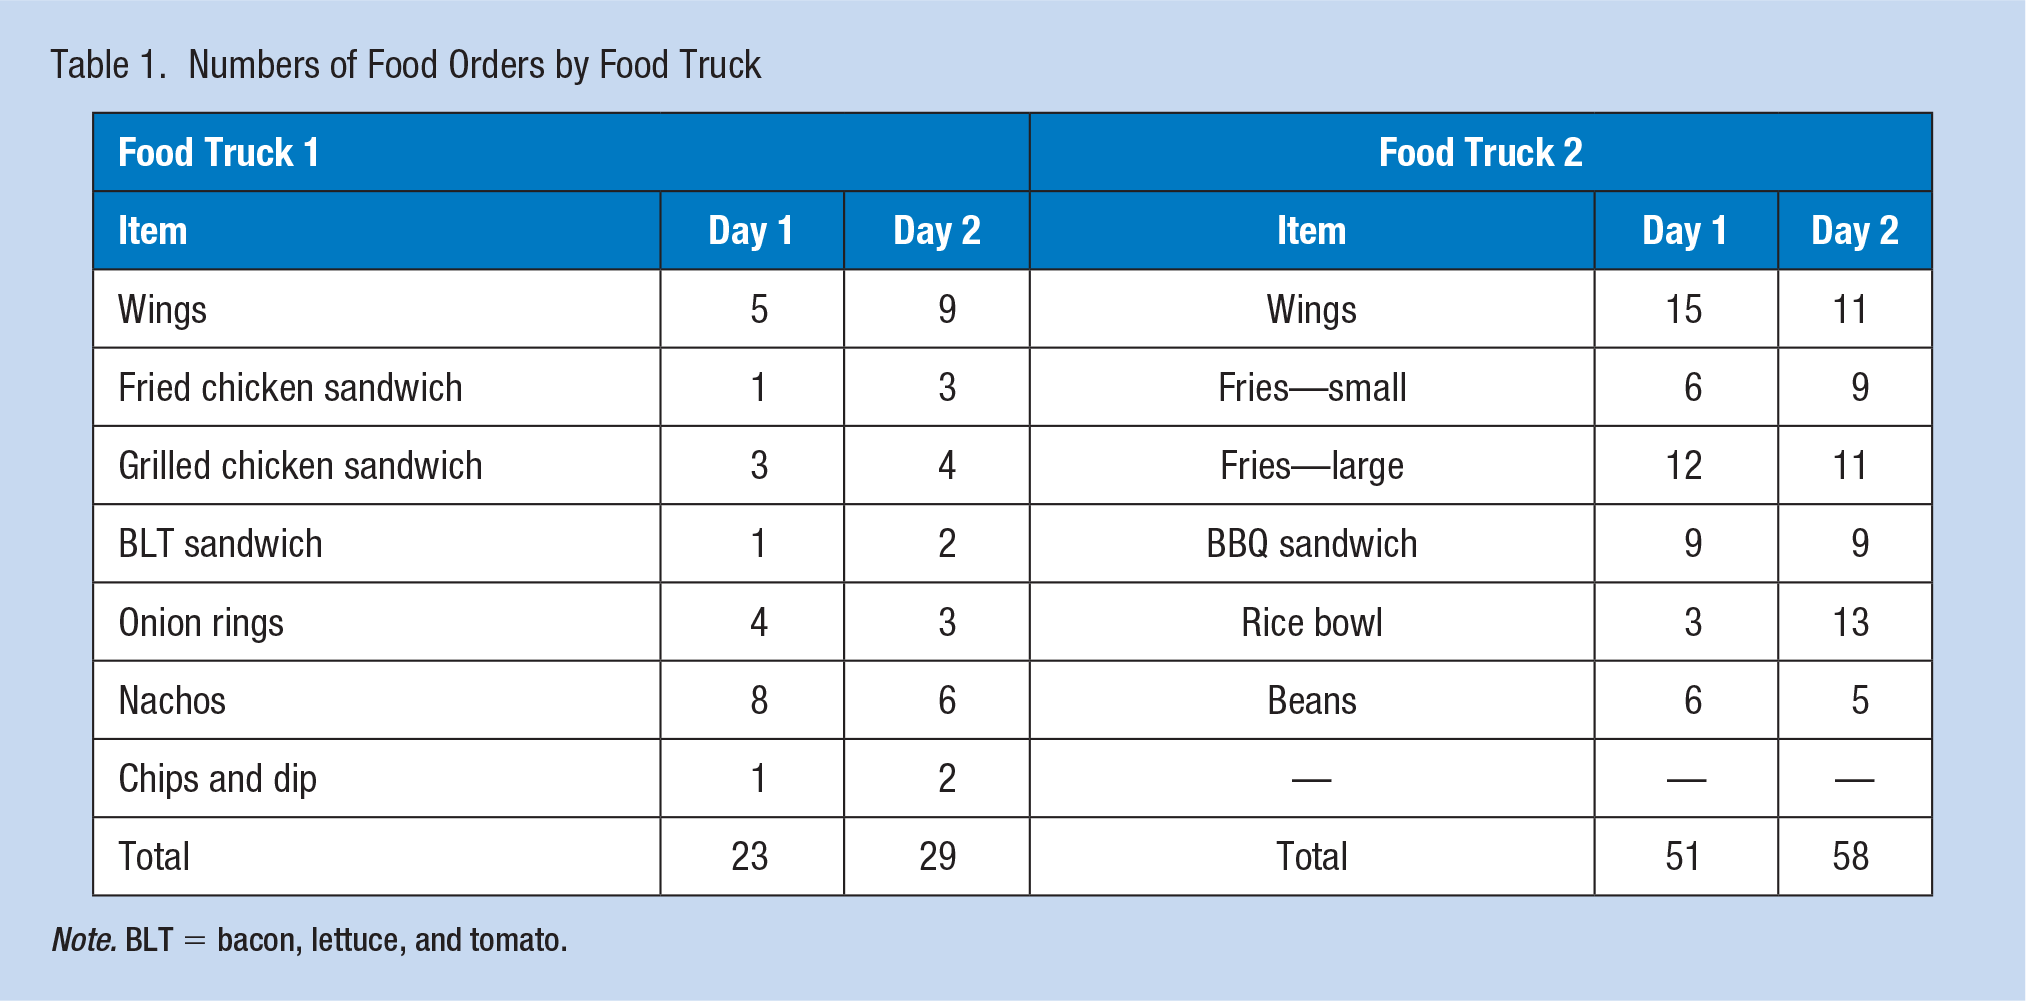
Note. BLT = bacon, lettuce, and tomato.
PM2.5
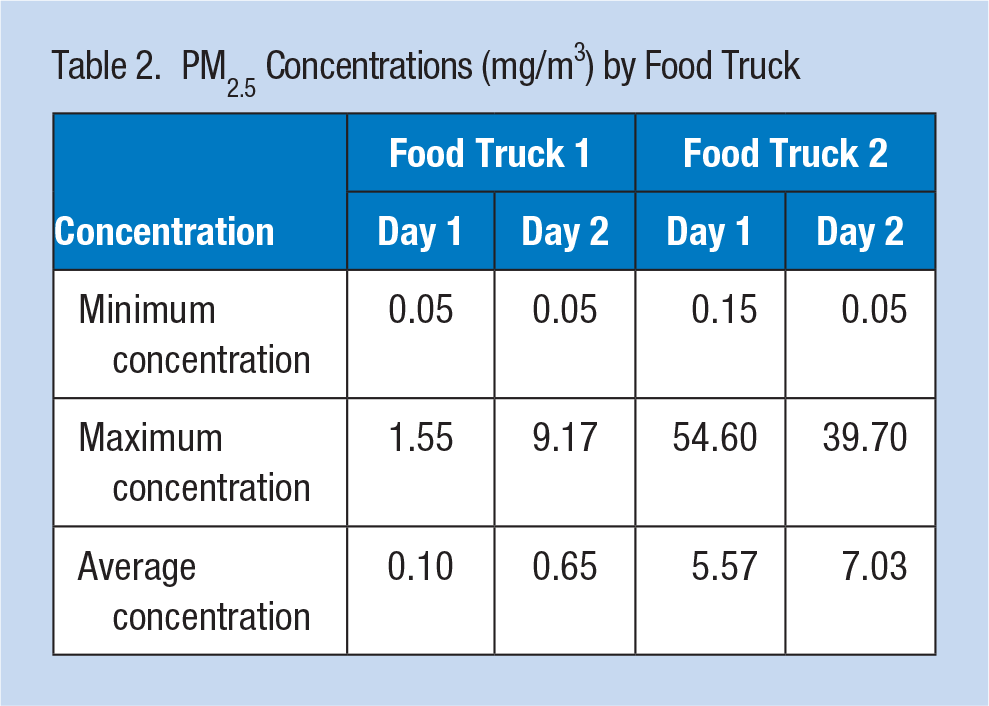
The minimum, maximum, and average PM2.5 concentrations for the food trucks are shown in Table 2. The average PM2.5 concentrations of Food Truck 1 were 0.10 mg/m3 and 0.65 mg/m3 on Day 1 and Day 2, respectively. The average PM2.5 concentrations of Food Truck 2 were 5.57 mg/m3 and 7.03 mg/m3 on Day 1 and Day 2, respectively.
PM2.5 Concentrations (mg/m3) by Food Truck
Aldehydes
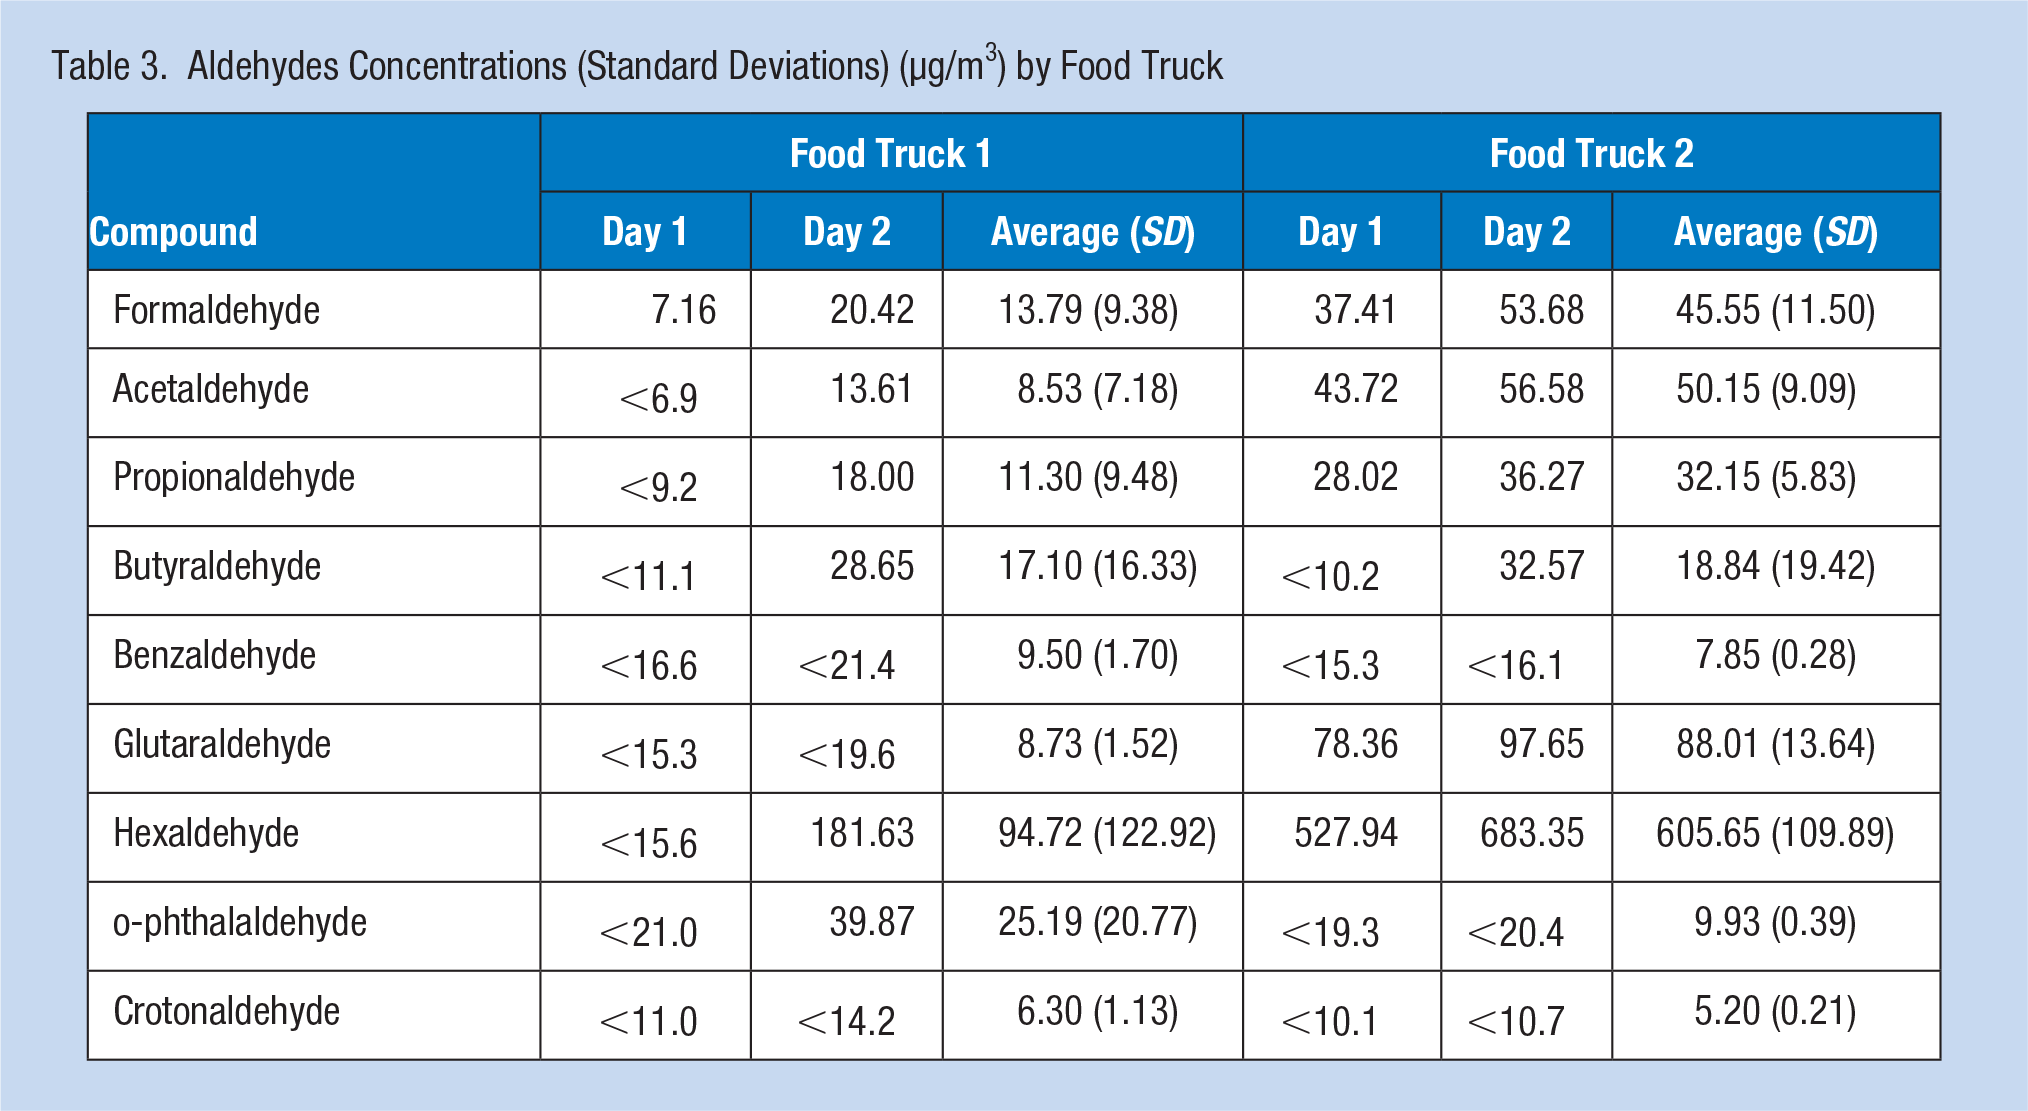
Table 3 summarizes the results of aldehyde concentrations measured in the food trucks. All aldehydes in all blank samples were below the respective LOQs. Results below LOQs were substituted with half of the LOQ when calculating averages. For Food Truck 1, the only aldehyde found in the Day 1 of sampling was formaldehyde. In the Day 2 of sampling, six out of nine aldehydes for which analysis was performed were identified and they were formaldehyde, acetaldehyde, propionaldehyde, butyraldehyde, hexaldehyde, and o-phthalaldehyde. The average concentrations during the two sampling sessions were 13.79 ± 9.38 for formaldehyde, 8.53 ± 7.18 for acetaldehyde, 11.30 ± 9.48 for propionaldehyde, 17.10 ± 16.33 for butyraldehyde, 94.72 ± 122.92 for hexaldehyde, and 25.19 ± 20.77 µg/m3 for o-phthalaldehyde. For Food Truck 2, five out of the nine aldehydes found were formaldehyde, acetaldehyde, propionaldehyde, glutaraldehyde, and hexaldehyde in the Day 1 of sampling. One more aldehyde, butyraldehyde, was detected in the Day 2 of sampling in addition to the five aldehydes previously found in Day 1. The average concentrations during the two sampling sessions were 45.55 ± 11.50 for formaldehyde, 50.15 ± 9.09 for acetaldehyde, 32.15 ± 5.83 for propionaldehyde, 88.01 ± 13.64 for glutaraldehyde, 605.65 ± 109.89 for hexaldehyde, and 18.84 ± 19.42 µg/m3 for butyraldehyde.
Aldehydes Concentrations (Standard Deviations) (µg/m3) by Food Truck
PAHs
The sample taken on Day 1 at Food Truck 2 was determined to be invalid due to an incorrect sampling procedure. No single PAH was found to be above the LOQ in any of the rest of the samples. PAHs in all blank samples were below the LOQ.
Ventilation
Supplemental Figures 3 and 4 show the results of the velocity measurements at each square/rectangle area of the filter bank in Food Trucks 1 and 2, respectively. Supplemental Figures 5 and 6 show the average velocities at each measurement location. The range of the average velocities was 0.225 to 0.750 m/s and 0.410 to 0.887 m/s and the overall average velocity was 0.462 ± 0.150 m/s and 0.652 ± 0.158 m/s for Food Trucks 1 and 2, respectively. The average flow rate calculated based on the filter bank dimensions of each food truck was 322 and 492 L/s and consequently the average flow rate by the linear meter of each hood was 211 and 215 L/s for Food Truck 1 and Food Truck 2, respectively.
Discussion
Food Truck 1 had a higher average PM2.5 concentration on Day 2 than Day 1. A larger volume of food during Day 2 especially fried foods (i.e., wings and fried chicken sandwich) would likely be a reason for this as studies have found that frying food generally produces a greater amount of fine particles than other cooking methods. Frying chicken resulted in 3 times higher PM2.5 concentration, 0.10 mg/m3, than boiling chicken, 0.03 mg/m3 (Huboyo et al., 2011). Deep-frying tofu resulted in the largest amount of PM2.5 emission, 0.2 mg/m3, than other cooking methods such as pan-frying, boiling, and steaming (See & Balasubramanian, 2008). Food Truck 2 also had a higher PM2.5 concentration on Day 2 than Day 1. This was more likely due to a larger number of orders on Day 2 than on Day 1.
Food Truck 2 generated considerably higher PM2.5 than Food Truck 1 during both sampling sessions. The greater volume of food orders of Food Truck 2 was believed to be a major reason, considering that the portion size in both food trucks was comparable (i.e., serving on an approximately 15 cm × 50 cm paper tray). Also, the use of a gas underfired broiler in Food Truck 2 would have contributed to the higher concentration of PM2.5. A gas underfired broiler is categorized as a heavy duty equipment according to the ASHRAE (2003) classifications and it is expected for such heavy duty kitchen appliance to create a stronger thermal plume.
The OSHA 8-hour time-weighted average Permissible Exposure Limit (PEL) for respirable fraction particulates is 5 mg/m3 which is based on a 50% (median) cut point diameter of 4 µm. The estimated 8-hour PM2.5 concentration of Food Truck 2 on Day 2 was the highest, 4.08 mg/m3, when assuming a zero concentration for the rest of the 8-hour time period (i.e., for approximately 3 to 5 hours). Although the estimate did not exceed the OSHA PEL, it exceeded the American Conference of Governmental Industrial Hygienists (ACGIH) Threshold Limit Value (TLV) which is 3 mg/m3 with a 4-µm median cut point. Considering the smaller median cut point diameter of PM2.5, the exposure level to respirable fraction particulates could be higher. In addition, the maximum concentration of Food Truck 2 in both sampling periods, 54.6 and 39.7 mg/m3, was an order of magnitude higher. However, it should be noted that the direct comparison of the area sampling results with Occupational Exposure Limits (OELs) would more likely overestimate the true exposure of the workers as location of the area samplers in this study was close to the emission source without taking into account the movements of workers away from the source.
Formaldehyde was the only compound detected in all samples taken in both food trucks and acetaldehyde, propionaldehyde, and hexaldehyde were found in three out of four samples. Among those, hexaldehyde concentrations were found to be the highest. The findings are consistent with previous studies in general. In a study of restaurant kitchens, personal sampling was performed for 2 to 3 hours and average formaldehyde and acetaldehyde concentrations of 14 ± 6 µg/m3 and 102 ± 33 µg/m3 were found in all three small local restaurants mostly serving fried food (Svendsen et al., 2002). For comparison with our results, the average formaldehyde and acetaldehyde concentrations of the two food trucks during the sampling periods were 30 ± 20 µg/m3 and 29 ± 25 µg/m3, respectively. Acetaldehyde, propionaldehyde, butyraldehyde, and hexaldehyde were found in the emissions of olive and canola oils collected in Tedlar bags through a heated hermetic Pyrex reactor, and hexaldehyde was one of the most abundant alkanals, 57, 43, and 24 mg per liter of canola, extra virgin olive, and olive oil, respectively, when heated at 180°C for 1 hour (Fullana et al., 2004a). In another study of volatile chemical analysis of lipid decomposition and oxidation, hexaldehyde was also the major compound, 3,090 mg/L in headspace volatiles, when pork fat was heated at 250°C (Yasuhara & Shibamoto, 1989). The average hexaldehyde concentration found in our study, 350 ± 310 µg/m3, however, would not be appropriate for a direct comparison with the previous studies.
Overall, the cooking activities of Food Truck 2 generated higher aldehydes concentrations than Food Truck 1 during both sampling sessions. The higher volume of food orders of Food Truck 2 appears to be the primary reason. Cooking equipment can be classified into light, medium, heavy, and extra-heavy duties by plume strength which greatly depends on the surface temperature of the cooking appliance: minimum cooking surface temperatures of 93°C, 204°C, 316°C, and 371°C for light, medium, heavy, and extra-heavy duties, respectively (ASHRAE, 2015). The total amount of volatile aldehyde emissions from canola, extra virgin olive, and olive oils increased from 92.3 to 195 mg/hr per liter of oils when cooking temperature increased from 180°C to 240°C (Fullana et al., 2004b). The use of heavy duty appliance, a gas underfired broiler, in Food Truck 2 therefore could also have contributed to the higher levels of aldehydes.
Food Truck 2 samples showed a much higher hexaldehyde level, 605.65 ± 109.89, than Food Truck 1, 94.72 ± 122.92. Linoleic acid which is a polyunsaturated fatty acid is the main precursor of hexaldehyde when oxidized (Da Silva & Pereira, 2008). Food Truck 1 used olive oil while Food Truck 2 used sunflower oil for deep frying as well as for other cooking methods. Olive oil in general contains high oleic acid, a monounsaturated fat, while sunflower oil can contain high and mid oleic acid or high linoleic acid, polyunsaturated fat (National Sunflower Association, n.d). The sunflower oil Food Truck 2 used was high in oleic and thus there was no considerable difference in the composition of a cooking oil used in the food trucks. The higher level of hexaldehyde found in Food Truck 2 would be primarily because of the larger volume of food cooked with a low linoleic acid containing oil. No OELs or relevant regulatory limits for hexaldehyde are available to compare this study results with, which does not necessarily mean that it is not harmful. A study of hexaldehyde vapors on acute human health effects showed mild ocular irritation at 10 ppm (approximately 41 mg/m3 at 25°C and 1 atm) for 2 hours (Ernstgård et al., 2006). Pulmonary toxicity of hexaldehyde has been recently suggested through in vivo and in vitro models (Cho et al., 2016, 2017).
In comparing with OELs, the average formaldehyde level of Food Truck 2 converted to an 8-hour time-weighted average assuming no exposure for the rest of 8-hour period (i.e., for approximately 3 to 4.5 hours), 26.57 µg/m3, exceeded the NIOSH Recommended Exposure Limit (REL) of 19.68 µg/m3 which is the lowest OEL. However, the comparison of the results with OELs would more likely overestimate the true exposure of the workers as area sampling was performed in the proximity of the emission source.
The ventilation performance of the backshelf hoods in the two food trucks was similar, an average exhaust flow rate of 211 and 215 L/s per linear meter of hood for Food Truck 1 and 2, respectively, and both exhaust hoods were below the recommended exhaust flow rates by the ASHRAE Handbook for Kitchen Ventilation: 310 to 465 L/s and 465 to 620 L/s per linear meter of Type 1 listed backshelf hood for medium duty and heavy duty equipment use, respectively (ASHRAE, 2015). Food Truck 1 was equipped with all medium duty appliances requiring 310 to 465 L/s per linear meter of hood, while Food Truck 2 was equipped with a heavy duty appliance (i.e., a gas underfired broiler), along with other medium appliances, requiring 465 to 620 L/s per linear meter of hood. The front of the backshelf hoods was behind the front of the cooking appliances for head clearance which lowers the hood capturing efficiency; Food Truck 2 had a shorter hood front compared with Food Truck 1. The low exhaust rate and configuration of the hood in Food Truck 2 could have also contributed to the higher concentrations of aldehydes and PM2.5. There are limited numbers of studies on the ventilation performance in commercial kitchens. The ventilation performance of 89 hoods in 60 restaurants in the United States was examined and only 31% of backshelf hoods met the ASHRAE guideline (Keil et al., 2004).
The velocity at the top of the filter bank (first row) was generally greater than that at the bottom (third row) of the filter bank which can be explained by the top of the filters being closer to the fan duct. The location of the fan duct in both food trucks was observed to be in the middle of the filter bank but the velocity pattern was not conclusive.
A correction factor, K-factor, which considers the effect of the standoff distance from the filter bank on the flow rate is larger than 1.0 for most hand-held instruments, increasing the resulting flow rate. A K-factor was not applied to this study, as a relevant K-factor for a backshelf hood with baffle filters was not available.
Conclusion
In this pilot study, frequently found contaminants from cooking emissions including aldehydes, PAHs, and PM2.5 were examined in two food truck environments through area sampling approximately at the breathing zone. Food Truck 2 had higher levels of aldehydes and PM2.5 with comparable ventilation performance with Food Truck 1. Formaldehyde was detected in all samples and the estimated 8-hour time-weighted average for Food Truck 2 was over the NIOSH REL. Hexaldehyde was found to be much higher than the rest of the other aldehydes but no relevant OELs are available. No PAHs were detected in any of the trucks. The estimated 8-hour time-weighted PM2.5 concentration in Food Truck 2 on Day 2 exceeded the ACGIH TLV for respirable fraction though a direct comparison would not be appropriate due to a different median cut point diameter. The exhaust flow rates for both food trucks were below the ASHRAE recommendations for kitchen hoods. The higher exposure levels in Food Truck 2 were possibly attributed to a larger volume of food orders and the use of heavy duty equipment (i.e., underfired broiler) with inadequate ventilation. Therefore, it appears that food truck environments may pose a risk because of a higher emission and lower exhaust flow rate. More investigations need to be performed with a larger sample size and stratified cuisine type and cooking method to better understand the effects of ventilation on the levels of aldehydes and fine particles in food truck environments. In addition, personal sampling is desirable in the future studies as the comparison of the area sampling results obtained in the proximity of the emission source to OELs would more likely overestimate the true exposure of the workers.
Implications for Occupational Health Practice
The findings of this study bring attention to the potential exposure of food truck workers raising awareness to occupational health practitioners. The study results could be used for the occupational health practitioners to estimate food truck environments regarding expected contaminants. In addition, this study suggests to the health practitioners a simple solution to improve the work environment by improving the capture and containment (C&C) efficiency of existing ventilation system such as adding side panels to the hood and decreasing setback of the hood by reducing the rear gap of cooking equipment wherever applicable.
Applying Research to Occupational Health Practice
The food truck industry in the United States has rapidly expanded in the past few years. Food truck environments are unique workplaces where workers use diverse thermal cooking appliances in a very limited space. In this pilot study, we examined the levels of contaminants generated through the cooking process within food trucks, including PM2.5, aldehydes, and PAHs. In addition, the performance of the ventilation system of food trucks was also investigated. Our findings suggest potential exposure to formaldehyde and PM2.5 with inadequate ventilation especially in a busier food truck, that is, higher emission and lower exhaust flow rate. Although more investigations need to be performed, the findings could be used to raise awareness of food truck workers and health practitioners to reduce potential risks of such exposures. Relatively simple engineering controls to improve the C&C efficiency of the existing ventilation system such as adding side panels to the hood and decreasing setback of the hood could be implemented wherever applicable.
Supplemental Material
WHS-19-0265-Supplemental-Figures – Supplemental material for Evaluation of Aldehydes, Polycyclic Aromatic Hydrocarbons, and PM2.5 Levels in Food Trucks: A Pilot Study
Supplemental material, WHS-19-0265-Supplemental-Figures for Evaluation of Aldehydes, Polycyclic Aromatic Hydrocarbons, and PM2.5 Levels in Food Trucks: A Pilot Study by Holden Phillips and Jonghwa Oh in Workplace Health & Safety
Footnotes
Acknowledgements
The authors appreciate the food truck operators for letting us examine their work environments. Food Truck 1 has been closed since we obtained the data. We also thank Shanita Thomas and Charles Boyd who helped with sampling.
Authors’ Note
This study does not represent the views of the authors’ affiliations and its contents are solely the responsibility of the authors and do not necessarily represent the official views of National Institute for Occupational Safety and Health (NIOSH).
Declaration of Conflicting Interests
The author(s) declared no potential conflicts of interest with respect to the research, authorship, and/or publication of this article.
Funding
The author(s) disclosed receipt of the following financial support for the research, authorship, and/or publication of this article: This study was supported in part by The Deep South Center for Occupational Health and Safety (Grant #T42OH008436 from NIOSH).
Supplemental Material
Supplemental material for this article is available online.
Author Biographies
Holden Phillips is an industrial hygienist/safety technician at AMERICAN Cast Iron Pipe Company headquartered in Birmingham, Alabama. He earned an MPH degree at University of Alabama at Birmingham (UAB) with a focus on industrial hygiene in 2019.
Jonghwa Oh is an assistant professor in the Department of Environmental Health Sciences at UAB. She earned a PhD in environmental health sciences (industrial hygiene track) from UAB. Her main research area is on improving occupational exposure assessment and control methods.
References
Supplementary Material
Please find the following supplemental material available below.
For Open Access articles published under a Creative Commons License, all supplemental material carries the same license as the article it is associated with.
For non-Open Access articles published, all supplemental material carries a non-exclusive license, and permission requests for re-use of supplemental material or any part of supplemental material shall be sent directly to the copyright owner as specified in the copyright notice associated with the article.