
Abstract
Background: Emerging research indicates that Head Start employees often struggle with health issues and may not be able to model the healthy behaviors that they hope to instill in young children. The purpose of this study was to examine the relationships between perceived physical health and chronic disease, stress, financial-resource strain, and job type. Method: This study was conducted in a large, multi-site Head Start agency located across five counties in the American Midwest. Employees (N = 550) were invited to complete a 58-item questionnaire that assessed overall health and health behaviors, demographics, workplace environment, and interest in well-being programs. Bivariate analysis and multinomial logistic regressions were used to analyze the relationships between variables of interest and physical health. Findings: More than half (n = 295; 53.64%) responded, and one quarter of the employees (25.42%) reported poor or fair health. Poor and fair physical health was associated with the number of chronic conditions, difficulty paying for basic necessities, and perceived stress, but not job type. A high percentage of responding employees (83.34%) reported interest in well-being programs, yet interests varied significantly by health status. Employees with poor and fair health expressed interest in stress and emotional-coping programs, in contrast to the fitness interests of employees who reported good, very good, or excellent health. Conclusion/Application to Practice: To meet the needs of employees with poor or fair physical health, employers should offer health behavior modification programs that address the sources of employee stress, including financial-resource strain and mental health challenges.
Keywords
Background
Early childhood educators and specifically Head Start staff care for some of our most impressionable citizens. Children enrolled in early childhood education (ECE) achieve many cognitive and emotional milestones during these formative years, and their development is influenced by the social and physical environments in which they participate. Teaching is a high-demand profession, and working with young children living in poverty adds to the demands of teaching (Greenberg, Brown, & Abenavoli, 2016; Shernoff, Mehta, Atkins, Torf, & Spencer, 2011). Emerging research indicates that teaching staff often struggle with their own health issues and may not be able to model the healthy lifestyle behaviors that they hope to instill in young children (Hibbs-Shipp, Milholland, & Bellows, 2015; Linnan et al., 2017; Sharma et al., 2013; Whitaker, Becker, Herman, & Gooze, 2012). Poor health outcomes of teachers and staff have been attributed to the combination of limited resources, including low pay, time, the demands of work, prior life experiences, and motivation (Cumming, 2016; Greenberg et al., 2016; Hibbs-Shipp et al., 2015; Linnan et al., 2017; Whitaker et al., 2014).
Children and families look to the staff for information, encouragement, and resources, and it is often the teacher who establishes the norms within the learning environment. Increasing the health knowledge and improving the well-being of Head Start employees can benefit them, as well as transfer into early childhood classroom environments (Cotwright et al., 2017; Esquivel et al., 2016; Hur, Jeon, & Buettner, 2016). Teachers who are mentally and physically healthier are better able to efficiently perform job tasks and provide quality care to children, thus improving child outcomes (Greenberg et al., 2016; Hur et al., 2016).
Researchers have documented numerous benefits of work-based well-being programs (Aldana, Merrill, Price, Hardy, & Hager, 2005; Anderzén & Arnetz, 2018; Baicker, Cutler, & Song, 2010; Butler, Clark, Burlis, Castillo, & Racette, 2015; Chen et al., 2015; Goetzel et al., 2014; Gosliner et al., 2010; Leininger, Orozco, & Adams, 2014; Merrill & LeCheminant, 2016; Williams & Day, 2011). Yet, not all segments of employees have the opportunity to benefit from employer-sponsored programs to improve health and workplace culture. Caregiving professions, such as early childhood educators, are a segment of the American workforce in which there is insufficient research surrounding employee well-being and self-care (Bureau of Labor Statistics, U.S. Department of Labor, 2018; Claxton, Rae, Long, Damico, & Whitmore, 2018; Otten et al., 2019). The role of caring for others can be satisfying, yet challenging work. The combination of emotional stress and challenging work conditions can take a toll on the health of the employed caregiver as well as contribute to poor organizational outcomes, including service quality, child and family outcomes, and ultimately staff burnout (Greenberg et al., 2016).
The purpose of this research was to describe self-reported physical health status, health behaviors, and well-being interests of teachers and other staff within a large Head Start agency, and to explore relationships between employees’ overall physical health, different health risk conditions, and well-being interests. We hypothesized that there would be significant, negative associations between chronic health conditions, stress, financial-resource strain, and teaching roles, with employees’ overall physical health status.
Method
Setting and Sample
This study took place at a Head Start agency that served approximately 2,800 children and their families in five counties within one American Midwest state. The agency employed 550 people, including teaching, family support, health, administrative, and support staff. The agency provided services through a mix of self-operated Early Head Start and Head Start classrooms as well as through partnerships with community child care centers, and family child care and home-based options. Numerous communication strategies designed to encourage employee participation started 1 month prior to the questionnaire distribution. Strategies included presentations at manager and staff meetings. All employees were then invited to participate in the anonymous online survey questionnaire through an email and questionnaire link sent by the chief executive officer. The online questionnaire took approximately 10 minutes to complete. Employees were given 2 weeks to respond, and a reminder email was sent the day before the questionnaire link closed. A total of four emails were sent during the 2-week time period to encourage participation. The Institutional Review Board of Wright State University reviewed and approved this protocol.
Questionnaire and Measures
The researchers developed a 58-item questionnaire organized into four sections: individual health and health practices, workplace health, interest in well-being programs, and demographic information. Given that there was no widely cited instrument adopted within the early childhood literature, researchers developed a questionnaire using existing questions or modified validated items. Researchers reviewed several existing questionnaires from the early childhood literature (Esquivel et al., 2016; Gosliner et al., 2010; Linnan et al., 2017; Natale, Camejo, & Sanders, 2016) as well as some well-being questionnaires for general workplace and university audiences (Goetzel, Henke, Head, Benevent, & Calitz, 2017; Ridner, Newton, Staten, Crawford, & Hall, 2016). We used a systematic process for selecting questionnaire items by first reviewing the national surveillance questionnaire items, specifically the Behavioral Risk Factor Surveillance Survey (BRFSS; Centers for Disease Control and Prevention, National Center for Chronic Disease Prevention and Health Promotion, 2016) and the National Health and Nutrition Examination Survey (NHANES; Centers for Disease Control and Prevention, National Center for Health Statistics, 2017), followed by early childhood published questionnaires and published literature for specific scales of interest. The Head Start agency administrators and early childhood community partners provided feedback on the variables of interest as well as on the various drafts of the questionnaire.
Health status and behaviors
The dependent variable of self-reported physical health status, along with mental health status, was measured via questions adopted from the BRFSS; the items read, “How would you describe your overall physical health?” and “How would you describe your overall mental health?” with response options of “poor,” “fair,” “good,” “very good,” and “excellent” (5-point Likert-type scale). In the final analysis, responses were collapsed into three categories: “poor/fair,” “good,” and “very good/excellent.” The chronic conditions item was adapted from NHANES; participants were asked whether they had a diagnosis of any of the following conditions (yes or no): arthritis, asthma, high blood pressure, diabetes, high cholesterol, heart disease, or obesity/overweight. These data were used to calculate the total number of chronic health conditions.
Perceived stress was measured using Cohen’s four-item Perceived Stress Scale (PSS-4; Cohen, Kamarck, & Mermelstein, 1983). Four items were summed to create a PSS-4 scale score ranging from 0 to 16, with higher scores indicating higher levels of perceived stress. The financial-resource strain was adopted from the Institute of Medicine’s Measures of Social and Behavioral Determinants of Health survey (Giuse et al., 2017). The item read, “How difficult is it to pay for necessities?” with response options of “not hard at all,” “somewhat hard,” and “very hard.” Employees were asked about the presence of a health care provider; this item was also adopted from the Institute of Medicine (Giuse et al., 2017). Other health status items included their perceived energy level, pain, and work absences due to illness or injury.
The health behavior items asked about the weekly frequency for the following: 30 minutes of physical activity, relaxation activities, breathing exercises to reduce stress, two servings of fruit, two servings of vegetable, one or more sugar-sweetened beverages, and a balanced workplace lunch, with the response options of “hardly ever,” “1-2 days,” “3-4 days,” and “5 plus days” (4-point Likert-type scale). The use of tobacco and electronic cigarettes was also measured (Centers for Disease Control and Prevention, National Center for Chronic Disease Prevention and Health Promotion, 2016).
Questions about the employees’ interest in participating in well-being programs and preferred types of programs included a Likert-type question, “Overall interest in workplace programs that help you reach personal goals,” with response options of “highly interested,” “interested,” “somewhat interested,” or “not interested.” In a separate question, employees were asked to report interest in up to three workplace health classes or clubs by checking a box adjacent to the topic.
Finally, participants were asked about a number of demographic traits, including job type, length of employment, education level, gender identity, age, race/ethnicity, and marital status. The demographic questions were placed at the end of the questionnaire to improve employee response to the previous questionnaire items. Demographic responses were also placed in categories to protect the anonymity of the employees. Years of age and years of employment specifically included response categories to assure employees of anonymity.
Statistical Analysis
The data were analyzed as the mean and standard error (SE) for continuous variables and frequency (n and %) for all categorical variables. The main outcome variable was perceived physical health, which was categorized into three responses (“poor/fair,” “good,” or “very good/excellent”). The independent variables of interest included the number of chronic diseases, level of financial-resource strain, and perceived stress. We examined whether the employees’ overall physical well-being was related to independent variables and whether these associations varied by the three job-type categories: administrators, direct service, and teachers. Thus, the analysis was focused on the employees who reported their overall physical health status.
Bivariate analysis and multinomial logistic regressions were used to analyze the relationships between job position, number of chronic conditions, financial-resource strain, perceived stress level, and various health behaviors with self-reported physical health. The associations of physical health status with all categorical variables were tested using Pearson’s chi-square test of independence, Fisher’s exact test, or Spearman correlation coefficients. The association between physical health status and employee interests in workplace programs was analyzed using chi-square independent tests. The variables included in the univariate analyses were employee overall mental health, sum scores of PSS-4, and the health behaviors. Because the self-reported physical health status was an ordinal variable, the odds ratio (OR) of decreased physical well-being was calculated by comparing “good” physical health status with “very good/excellent (i.e., reference group)” physical health, and “poor/fair” with “very good/excellent” physical health in a multinomial logistic regression analysis. Multiple multinomial logistic regressions were conducted to assess the relationship between physical well-being and the factors shown to be associated with physical well-being from the univariate analyses using the backward selection for a significant variable. The final model included significant independent variables of interest, as well as significant health behaviors that were found to be statistically significant with perceived physical health. The adjusted OR and 95% confidence intervals (CIs) were also reported.
Demographic data were not included in the presented statistical analysis results due to a high number of missing values among those items (the missing response rate between 31% and 39%). However, there was no statistical difference in employees’ characteristics, including overall physical well-being, number of chronic diseases, financial-resource strain, and perceived stress scales between those who reported and those who did not report demographic data (age, race, education level, marital status, length of employment). In a subset analysis, the relation of demographic data to employee overall physical well-being was examined and found to be non-significant (data not shown). All statistical analyses were performed using the SAS Version 9.4. A p value <.05 was regarded as being statistically significant.
Results
Descriptive Characteristics
Of the 550 total employees at the organization, 59.45% (n = 327) responded to the survey. Among the 327 responses, 15 were removed due to a lack of responses in some sections, which resulted in a final responding sample size of 312 employees for a response rate of 56.72%. Although 312 employees responded to the questionnaire, approximately one third of them did not provide responses to the demographic items for age, gender, race, marital status, and length of employment. The exception to this trend was for the item asking employees to identify their job type from one of nine job types. The outcome of interest of physical health status was reported by 295 participants.
Among those who responded to the questions on demographics, the majority of employees were female (93.47%; Table 1). More than 61.34% of the employees were less than 45 years old, and 65.76% were White. Approximately 53.19% reported that they are married or living with a partner. The highest proportion of employees had worked at the organization 1 to 5 years (37.98%) and obtained a bachelor’s degree (38.31%), and half of the employees were teachers (50.86%).
Demographic, Health Status, and Behavior Information of Head Start Employees (n = 295) a
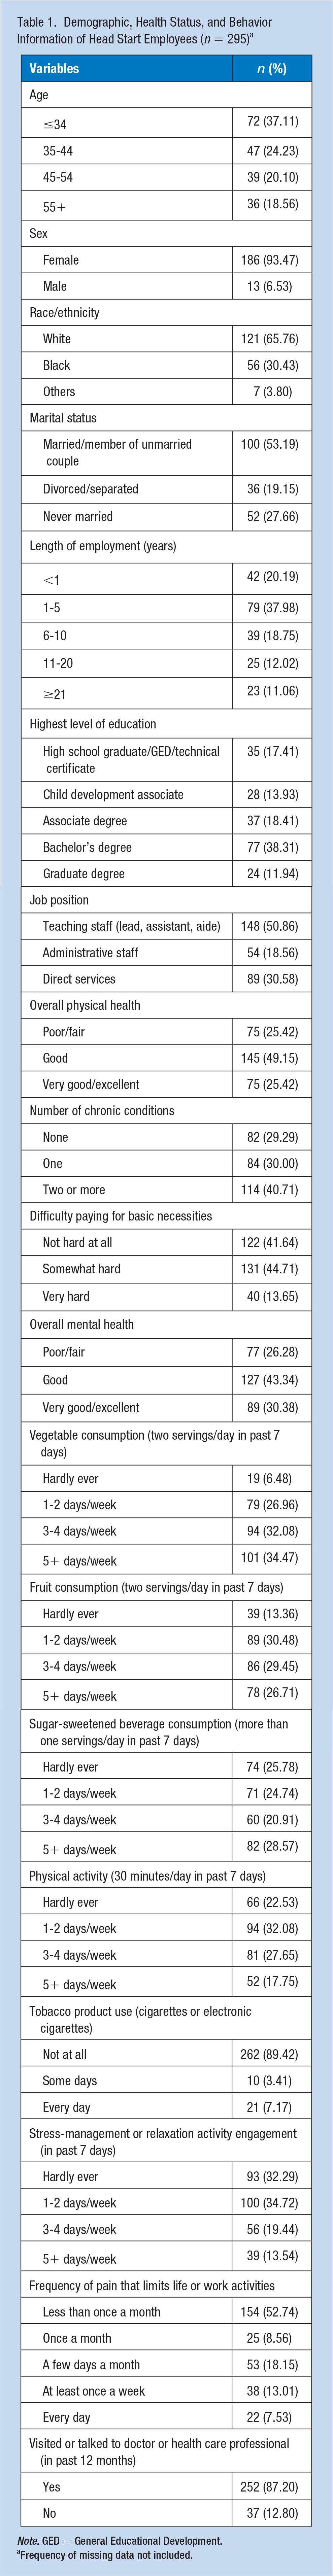
Note. GED = General Educational Development.
Frequency of missing data not included.
One in four employees (25.42%) perceived their physical health as “very good/excellent.” Forty-one percent of the employees (40.71%) reported having two or more chronic diseases with the most common chronic conditions being overweight/obesity (46.79%), high blood pressure (32.50%), and arthritis (21.43%; data not shown). When asked how difficult it was to pay for basic necessities, 58.36% of employees responded “somewhat hard” or “very hard.” The mean PSS-4 score (±SE) was 5.92 ± 0.18.
More than one in three (34.47%) participants reported that in the past week, they ate two servings of vegetables 5 or more days per week, while 26.71% responded that they consumed two servings of fruit that often. Only 25.78% of employees reported that they hardly ever consumed sugar-sweetened beverages in comparison with 28.57% of employees reporting regular consumption of sugar-sweetened beverages. Most employees (77.47%) were physically active for 30 minutes outside of work about 1 to 2 days a week and 89.42% employees reported that they did not smoke, which included electronic cigarettes. On average, 34.72% of respondents engaged in a relaxation activity to reduce their perceived stress level about 1 to 2 days a week.
There was no significant association between job type and perceived physical health status among employees (p = .313; Table 2). Significant associations (p < .001) were observed between self-reported physical health status and the number of chronic diseases, overall mental health, perceived stress levels, and financial-resource strain. Fruit consumption, vegetable consumption, physical activity, consumption of sugar-sweetened beverages, engaging in an activity for stress management, and the frequency of pain that limits activity were also significantly related to perceived physical health status. Higher perceived stress level scores were significantly associated with low to fair physical health status. Employees reporting poor or fair health status showed the highest mean perceived stress level score (7.59 ± 0.34), while those reporting a good health status had a mean score of 5.90 ± 0.24, and employees reporting excellent or very good status had a mean score of 4.30 ± 0.34. The odds of reporting “poor/fair” physical health for a one-unit increase in perceived stress level score were 1.47 times (OR = 1.47, 95% CI = [1.28, 1.69], p < .001) of those reporting “very good/excellent” physical health, while the OR of reporting “good” physical health was 1.23 (95% CI = [1.10, 1.38], p < .001). No demographic variables were significantly associated with overall physical health. However, the relationship between physical health and gender was not examined due to the high proportion of female employees when compared with male employees (data not shown).
Bivariate Analyses of Perceived Physical Health by Demographics and Health Behaviors Among Head Start Employees (n = 295)
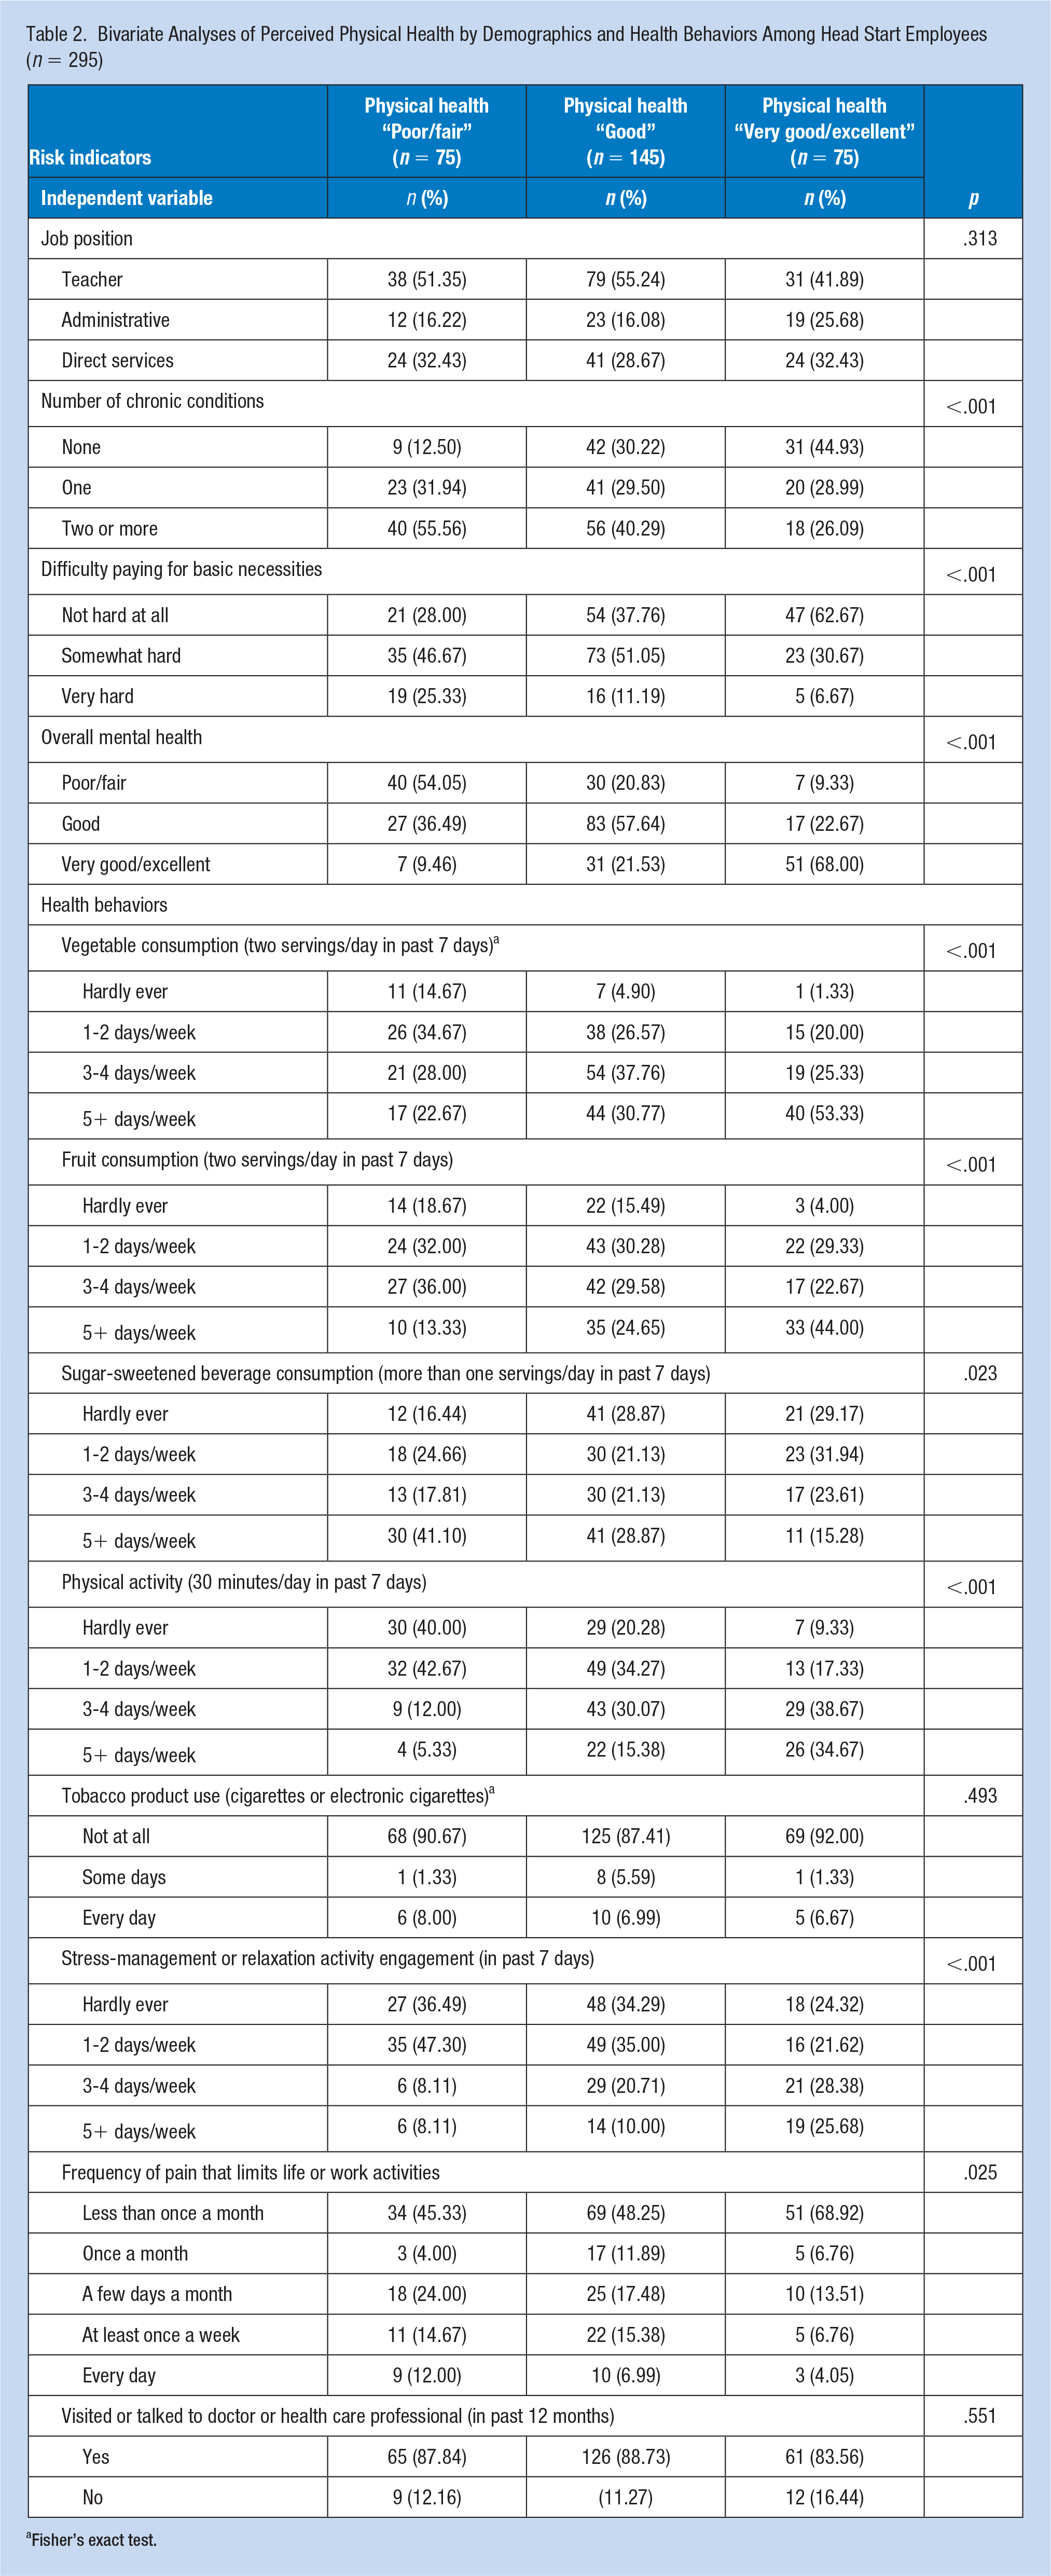
Fisher’s exact test.
Physical Health Model
Physical health status was significantly associated with the perceived stress level score, the number of chronic diseases, and the financial-resource strain while adjusting for the significant covariates, covariates of the vegetable consumption and physical activity habits (Table 3). Physical activity was significantly associated with the outcome (r = .41), while there was multicollinearity among behavior factors in the model. Fruit consumption, sugar-sweetened beverage consumption, and other variables from univariate analysis were not significant in the final model when adjusted for physical activity (p = .001) and vegetable intake (p = .052).
Adjusted Associations Between Perceived Physical Health and Number of Chronic Conditions, Stress, and Financial Resource Strain Among Head Start Employees (n = 295)
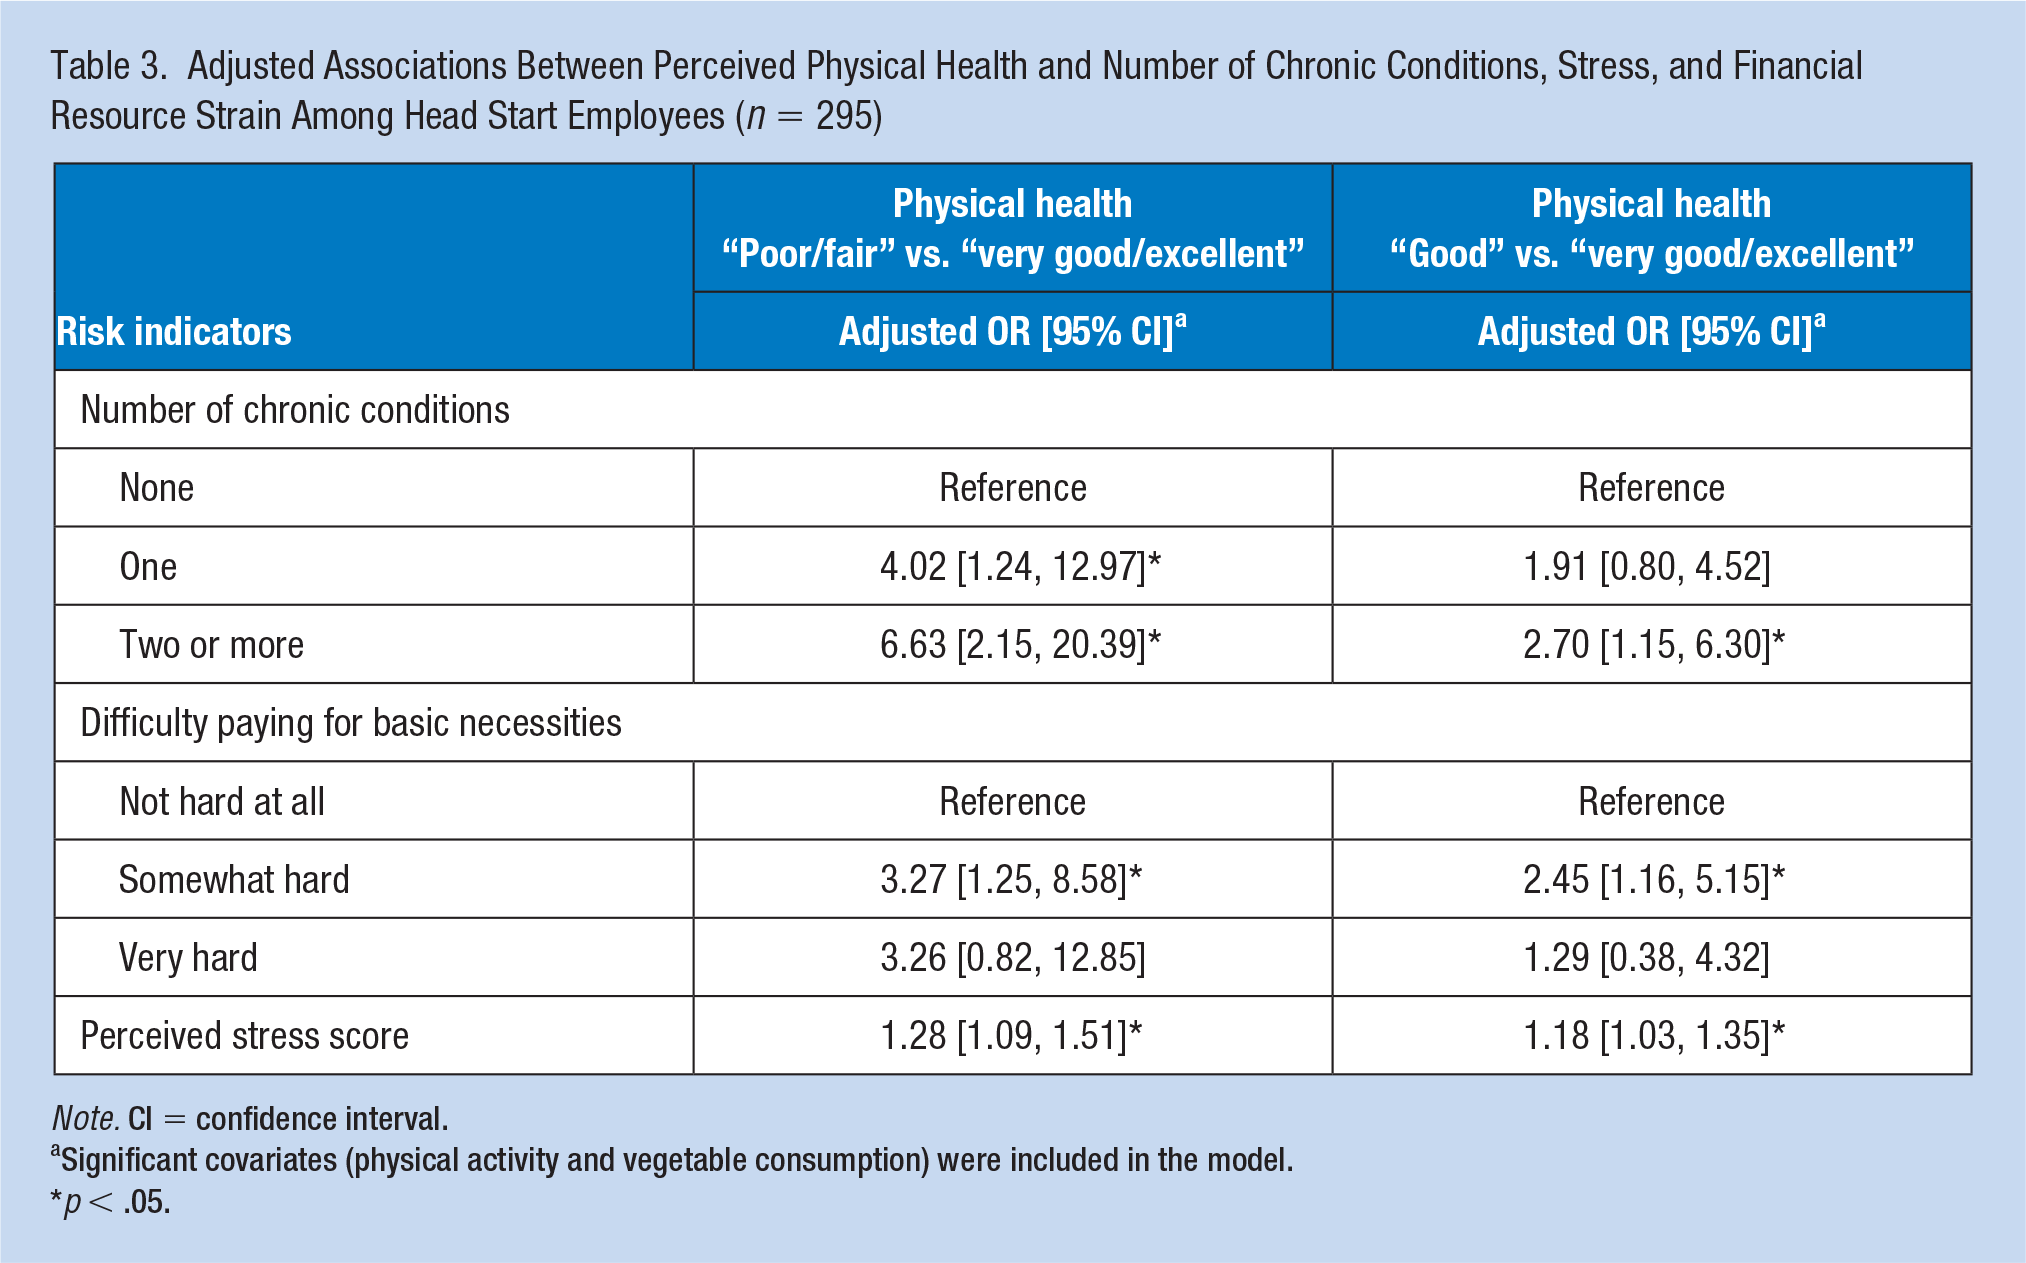
Note. CI = confidence interval.
Significant covariates (physical activity and vegetable consumption) were included in the model.
p < .05.
Having chronic health conditions was positively associated with poorer physical health status, and the magnitude of the relationship increased with two or more chronic conditions. For employees with two or more chronic conditions in comparison with employees with no chronic conditions, the odds of reporting “poor/fair” physical health was 6.63 (95% CI = [2.15, 20.39]) times the odds of reporting “very good/excellent” physical health when other factors in the model were held constant.
Perceived stress levels were included in the adjusted model, which did not include self-reported mental health information because of a high correlation between perceived stress levels and mental health (Spearman correlation = −.58, p < .001). Employees were 1.28 (95% CI = [1.09, 1.51]) times the odds to report “poor/fair” physical health for a one-unit increase in perceived stress score, compared with “very good/excellent” physical health. Similarly, in comparison with “very good/excellent” group, the odds of reporting “good” physical health increased by 18% (OR =1.18, 95% CI = [1.03, 1.35]) for a one-unit increase in perceived stress score.
Interests in Workplace Programs
When asked to rate their interest in workplace well-being programs to help them reach their personal health goals, 37.74% of the employees reported being “highly interested,” 29.57% were “interested,” 28.40% were “somewhat interested,” and 4.3% were “not interested.” When the employees’ general interest in well-being programs was examined in relation to their reported physical health status, there was no significant association (p =.414; data not shown).
Among the employees who showed an interest in a workplace well-being program (n = 246), there were significant differences in the Head Start employees’ interests in potential individual well-being programs across the reported physical health status (Figure 1). Fitness programs were desired among more employees with “very good/excellent” health status (68.25%) than among those with “poor/fair” health status (44.26%, p value for test for linear trend = .019) while stress and emotional-coping strategies programs were desired among more participants with “poor/fair” health status (63.93%) than in participants reporting “very good/excellent” status (33.33%, p value for test for linear trend = .001). The most commonly reported obstacles for participating in workplace programs included conflicting schedules, family obligations, not enough time to participate, travel or transportation conflicts, child care, and costs (these data are not shown).
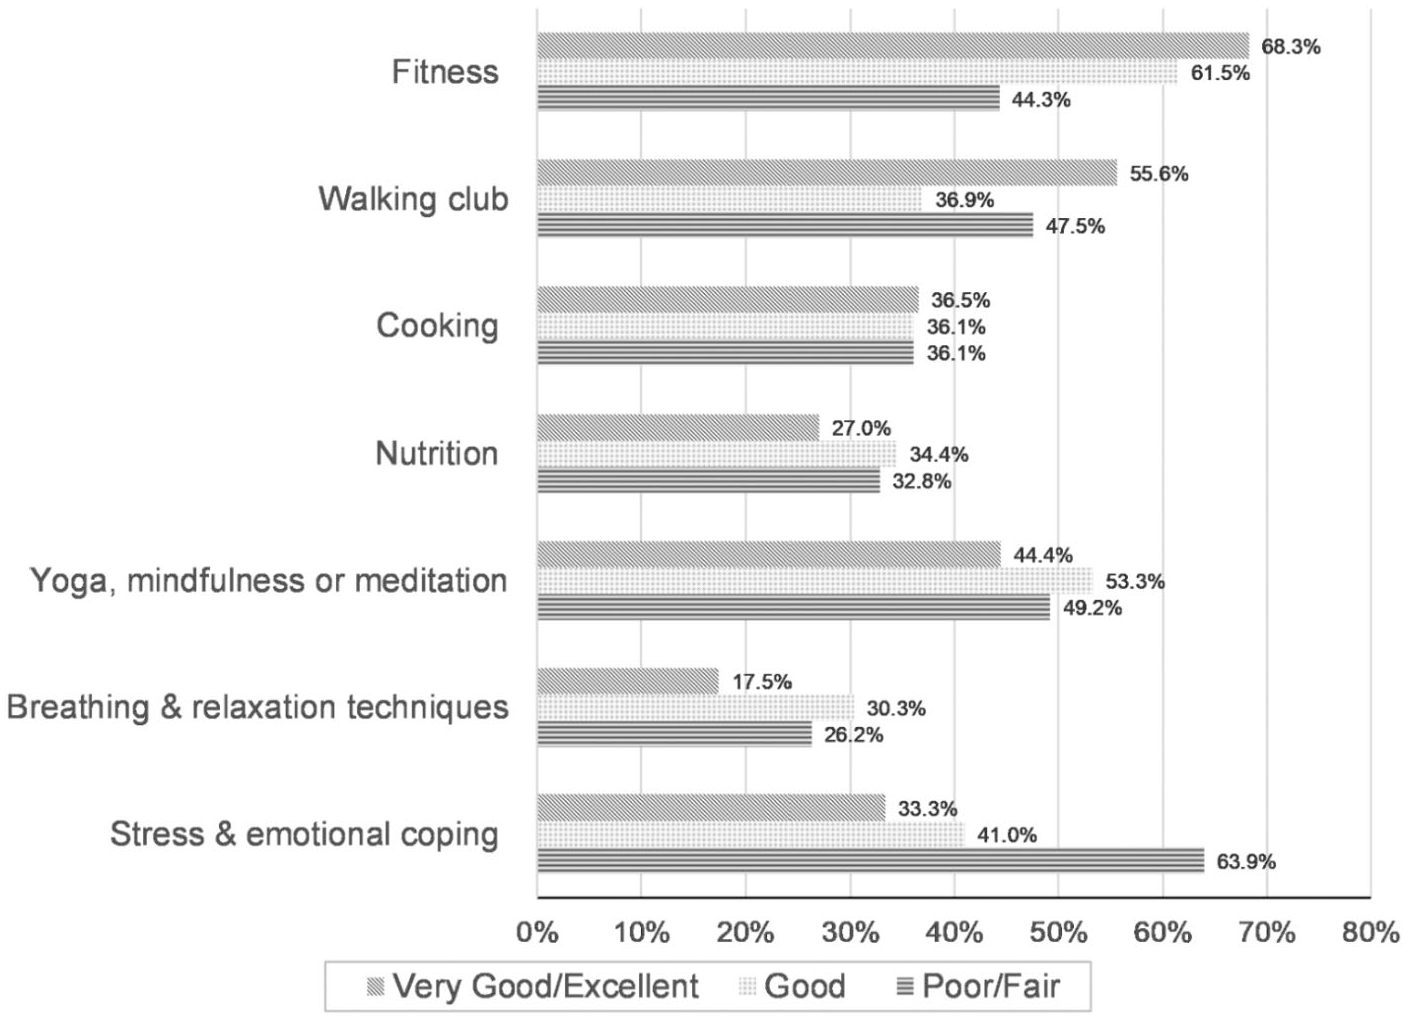
Percentage of Head Start employees reporting interest in workplace well-being programs by reported physical health status.
Discussion
Head Start is a comprehensive program whose role is to provide individualized and population-level services that help promote school readiness and overall well-being of vulnerable children and families. Results from this study, along with a growing body of evidence about ECE environments, indicate that employees within these Head Start organizations could benefit from health education and services. The Head Start employees who participated in this study reported poorer health status and behaviors than did the national reference populations but were comparable with the study populations of other studies focused on early childhood and Head Start settings. The proportion of employees in this agency that reported poor or fair physical health (25.4%) was much higher than the most recent (2017) national median of adults who report poor or fair health (17.7%; Centers for Disease Control and Prevention, National Center for Chronic Disease Prevention and Health Promotion, 2017). This discrepancy in health status appears similar to trends reported in an earlier study (2012) of Pennsylvania Head Start staff where poor or fair health status was 3 times more common than in the national population at the time (14.6% vs. 5.1%; Whitaker et al., 2014).
As hypothesized, chronic diseases, financial-resource strain, and perceived stress levels were negatively associated with perceived physical health status; 71% of the responding employees reported chronic disease, and chronic diseases were present across all perceived physical health categories. As the number of chronic diseases increased, the likelihood of reporting very good or excellent health dropped, clearly implying that managing chronic diseases was a significant element in how employees perceived their health. The most commonly reported chronic condition among employees was overweight/obesity (47%) which aligns with other studies that find overweight or obesity to be a major concern among early childhood professionals (Hibbs-Shipp et al., 2015; Linnan et al., 2017; Sharma et al., 2013; Whitaker et al., 2012).
Perceived Stress Level and Mental Health Status
In this study, there was a consistent relationship between physical health status and mental health, stress levels, and coping behaviors. Employees with poor or fair health status reported lower mental health scores, higher perceived stress levels, and infrequent stress management activities. The bivariate relationship between physical health and mental health was highly significant (p < .0001), meaning that the patterns in how employees reported their physical health status were similar to how employees reported their mental health. Furthermore, stress level scores were the highest (7.59) for employees with poor to fair health status as compared with the stress level scores (4.30) of the healthiest employees. The higher stress scores imply a combination of a lower sense of self-control or confidence over one’s situation as well as a sense of frequent difficulties. In a large study of Spanish and European adults (n = 37,451), the average stress score was 5.43 (standard deviation [SD] = 2.95), which also varied by sex, marital status, education, and income class. The mean and SD values (5.92 ± 3.15) reported by these Head Start employees appear slightly higher than the general audience (Vallejo, Vallejo-Slocker, Frenandez-Abascal, & Mananes, 2018). Vallejo et al. also reported norm PSS-4 scores ranging from 2.88 to 8.44 based on a review of published studies. The highest stress scores (8.44) were reported by a small sample of American women seeking health care at a clinic for the uninsured (Ingram, Clarke, & Lichtenberg, 2016), with the lowest stress scores reported by American pregnant women seeking care (Karam et al., 2012). Similar to our study, the higher stress scores were associated with populations experiencing poor health status, low education levels, and financial difficulties (Vallejo et al., 2018).
Sources of workplace stress in ECE settings are many, including low perceived professional status, low pay, the emotional demands of working with young children and families in poverty, and other workplace demands (Cumming, 2016; Hibbs-Shipp et al., 2015). Teachers and staff may also experience stressors outside the classroom due to earlier life experiences (Whitaker et al., 2014). The interventions to help reduce teacher stress levels should focus on a variety of targets, including organizational culture and job demands, individual skills to manage and cope with stressors, and how earlier life experiences affect their current health and behaviors.
Implications for Occupational Health Practice
A significant implication of this study is the need to offer workplace programs tailored to employee interest and health status. The overwhelming preference for workplace services of employees with poor to fair health was for stress and emotional-coping programs (64%), which is in stark contrast to preferences of the healthiest employees.
In this study, like other Head Start health assessment studies, high rates of chronic disease and self-reported nutrition and activity behavior rates indicated a need for health screenings and lifestyle modification programs. The results also indicated that to meet the needs of employees with poor physical health, organizations should consider broad-spectrum approaches to health behavior change. Programs for diet modification, exercise, stress management, and substance use need to address the root causes of stress and mental health challenges as a means of building health-promoting behaviors. Programs should also reflect the resource challenges faced by employees because financial resources were a significant predictor of physical health status.
In addition to agency-focused programming, corporate policies on wages and workplace culture must continue to be addressed. Early childhood teachers and caregiving staff earn low wages and often feel as if they have a low professional status; it is imperative that the field continues to advocate for wages that better reflect the complexity and difficulty of the work. Likewise, supportive workplace cultures promote well-being for caregivers, and hence for the children and their families.
Limitations
The strengths of this study stem from the large sample size of employee participants, which allowed for normalized statistical analyses. The questionnaire was the first of its kind to be distributed at this agency, which adds to the limited literature about early childhood educators. However, this analysis was constrained due to the low response rate to the demographic questions. Even after taking steps to assure anonymity, more than 30% of employee participants did not provide responses to demographic questions.
Other limitations stem from the self-report nature of the questionnaire. Employees who were healthier or more interested in well-being programs may have been more likely to decide to respond to the survey; this introduces self-selection bias. Finally, these results are only representative of one Head Start organization in one American Midwest state and may not be generalizable to all Head Start agencies. We encourage other agencies, and their funders, to adopt similar practices of assessing employee well-being and to use this study’s findings to engage employees by building a healthier workplace environment. Future research should examine how organizational culture and trust among Head Start employees affect response rates.
Conclusion
Early childhood educators and caregiving staff often report health outcomes and healthy behavior rates significantly lower than other workplace and general populations. The purpose of this study was to describe self-reported physical health status, health behaviors, and well-being interests of teachers and other staff within a large Head Start agency, and explore relationships between employees’ overall physical health, different risk conditions, and well-being interests. One quarter of the employees reported poor or fair physical health status, with significant negative associations between chronic health conditions, stress, financial-resource strain, and health status. We also found a consistent relationship between physical health status and mental health, stress levels, and coping behaviors. Our results, combined with other emerging research, identify a critical need for organizations to help early childhood employees take steps to improve health and model the behaviors that we hope to instill in children and families. To assist the employees with poor and fair health, organizations must offer behavior change and self-care programs that address root causes of stress and mental health challenges. Policies to improve wages, resource strain, and equal opportunity to a healthy workplace culture must also continue.
Applying Research to Practice
Health screenings and behavior modification programs are important elements of workplace health promotion programs. To maximize their outcomes, workplace programs should be tailored to audience need and the factors that influence behavioral action. Results from this study suggest that to help early childhood educators and staff make behavior changes, organizations must identify the sources of stress and the mental health challenges related to self-care and the employees’ ability to make healthy choices. The resource strain of low-wage employees should also continue to be addressed through policy work around wages and uniform access to healthy workplace environments.
Footnotes
Conflict of Interest
The author(s) declared no potential conflicts of interest with respect to the research, authorship, and/or publication of this article.
Funding
The author(s) received no financial support for the research, authorship, and/or publication of this article.
Author Biographies
Kristin Snyder, MPH, CHES, is the Ohio Equity Institute Coordinator at the Ohio Department of Health and served previously as the Quality and Program Outcomes Specialist for a Head Start agency. She is interested in addressing health inequities for youth and their families.
Madelyn Hill, MPH, CHES, is a health promotion specialist working in the Civilian Health Promotion Services on Wright Patterson Air Force Base. She is passionate about supporting employee health and providing preventive health services.
Miryoung Lee, PhD, MPH, is an epidemiologist and biostatistician at the University of Texas Health Science Center at Houston, School of Public Health, conducting epidemiologic research on chronic diseases. Her research focuses on the examination of interrelationships of risk factors, genetic biomarkers, and environmental contaminants with complex traits such as obesity and diabetes.
Timothy N. Crawford, PhD, MPH, is an epidemiologist and biostatistician at Wright State University’s Boonshoft School of Medicine in the departments of Population and Public Health Sciences and Family Medicine. His research focuses on the use of existing data to examine disparities in health and well-being among marginalized populations.
Marietta Orlowski, PhD, MCHES, is a health educator and social scientist at Wright State University’s Boonshoft School of Medicine and is Chair of the department of Population and Public Health Sciences. Her research involves health behavior measurement and risk reduction in children and adolescents.