
Abstract
This paper presents an experiential learning simulation designed to teach modern revenue management principles by adapting Talluri’s customer valuation game. The exercise tasks student groups with transitioning from customer roles, where they provide personal valuations, to the role of revenue managers optimizing prices for a fixed inventory of a digital service or experience. The simulation’s primary objectives are to illustrate core RM concepts like value-based pricing and segmentation while confronting students with contemporary challenges, including ethical trade-offs and the psychology of pricing. Implemented across six cohorts (n = 120), the game demonstrated a significant impact on learning, with a 22% average improvement in post-game quiz scores. The largest gains were in understanding demand elasticity (+41%) and segmentation strategies (+36%). Furthermore, it achieved high student engagement, with an average rating of 4.6/5. Qualitative feedback revealed an enhanced understanding of real-world pricing strategies. The simulation offers educators a scalable, active-learning tool that effectively bridges theory and practice in RM education.
Keywords
Introduction
Revenue management (RM) is a critical competency in industries where perishable inventory, dynamic demand, and segmented customer valuations drive profitability, from airlines to event ticketing (Talluri & Van Ryzin, 2004). While traditional RM pedagogy often relies on lectures and static case studies, experiential learning methods have proven more effective for cultivating students’ intuition for pricing strategies and demand forecasting (Claveria et al., 2015). However, existing classroom simulations, including Talluri’s (2009) original framework, often lack a connection to contemporary contexts, such as digital goods and services. While the core mechanics of valuation-based pricing remain valid, applying them to a digital context enhances student relevance and provides a modern backdrop for discussing challenges such as near-zero marginal costs and the heightened role of psychological pricing (Anderson & Xie, 2016). Building on Talluri’s (2009) cruise example, this study adapts the framework for digital service pricing, but still addresses dynamic and static pricing, as this is often difficult for hospitality students to comprehend. The main objective of the game is to allow students to experience the daily life of a revenue manager. Therefore, the game simulates a stream of customer purchasing decisions and then simulates how a revenue manager controls the sale over time with a fixed inventory.
While Talluri’s (2009) customer valuation game provides an excellent foundation for teaching core RM principles, the landscape of RM and pedagogical best practices has evolved significantly since its publication. This paper adapts and extends Talluri’s framework to address modern challenges largely absent from the original work, including the rise of digital service pricing, the application of behavioral economics principles like Prospect Theory, and the ethical trade-offs inherent in personalized pricing. Furthermore, this study moves beyond anecdotal evidence by providing quantitative and qualitative data on the simulation’s efficacy in improving learning outcomes. By modernizing the context, deepening theoretical underpinnings, and providing empirical validation, this adapted simulation makes a significant new contribution to active learning in RM education.
The approach aligns with calls for active learning in hospitality operations education (Behara & Davis, 2010), particularly for non-technical students who benefit from linking abstract RM concepts to tangible decisions. This simulation is primarily designed for Master’s-level students in hospitality, tourism, or business analytics, as it engages with advanced theoretical concepts such as Prospect Theory and ethical strategic trade-offs. However, with adapted learning objectives, it is also highly suitable for final year bachelor’s students. For undergraduate implementation, the focus can be shifted toward practical pricing mechanics and core RM principles, while optionally introducing the advanced theoretical modules as enrichment topics. The flexible nature of the simulation allows instructors to tailor the depth of discussion to the audience’s level.
Prospect Theory
The simulation is designed to illustrate how pricing strategies leverage well-established cognitive biases from behavioral economics. While Prospect Theory (Kahneman & Tversky, 1979) is central to understanding how customers perceive gains and losses relative to a reference point, it is part of a broader framework of consumer decision-making. In the context of the simulation, Prospect Theory’s principles, such as loss aversion, reference dependence, and diminishing sensitivity, are actively integrated into the core gameplay, particularly during the dynamic pricing rounds where students experience how time pressure and scarcity influence willingness-to-pay.
This work builds directly upon the foundation laid by Talluri (2009), who effectively introduced concepts like the risks of last-minute discounts and the rationale for price segmentation. My key contribution lies in deepening the theoretical explanation for these phenomena using the framework of behavioral economics. For instance, Talluri’s game demonstrates that last-minute discounts can be problematic, my adaptation uses Prospect Theory to explain why this occurs – by eroding reference prices and training consumers to anticipate deals (Alnes & Haugom, 2024; Lowengart, 2002). Similarly, I extend the discussion of segmentation beyond operational efficiency to include its ethical dimensions and psychological underpinnings, such as fairness perceptions (Adams, 1965) and the scarcity effect (Zamfir, 2024). Furthermore, I provide empirical validation for the game’s effectiveness in teaching these advanced concepts, a step beyond the anecdotal evidence presented in the original work.
Relevant to RM and the revenue pricing game, Prospect Theory describes how individuals make decisions under risk and uncertainty. Unlike traditional economic models that assume rational, utility-maximizing behavior, Prospect Theory posits that people evaluate potential losses and gains asymmetrically, often overweighing losses relative to equivalent gains (Kahneman & Tversky, 1979). This behavior directly influences pricing strategies, as customers’ willingness-to-pay is shaped by perceived reference points, such as listed prices or competitor benchmarks, and framing effects, such as discounts presented as “savings” versus surcharges as “penalties.” Students experiment with how an initial price, such as a high “standard” rate, serves as an anchor, making subsequent prices seem more attractive (Tversky & Kahneman, 1974). The mention of Thaler (1985) in this context, refers to his work on mental accounting and framing, which operationalizes Prospect Theory concepts in marketing and pricing contexts, such as how price presentations influence perceived value, rather than to the theory’s original formulation.
For instance, students observe how low-valuation customers, often more sensitive to perceived losses, react aggressively to price increases (loss aversion), while high-valuation customers prioritize convenience over marginal price differences (diminishing sensitivity). The game mechanics of limited inventory and announcing “days remaining” directly tap into how scarcity increases perceived value (Zamfir, 2024). Customer decisions are driven by the perceived value of the offering (Suryadi et al., 2018; Zeithaml, 1988), which is judged against an internal reference price (Lowengart, 2002). Students learn that pricing is not just about cost but about managing perceived value. By adjusting price frames, such as anchoring discounts to a high “original” price or bundling services to obscure cost comparisons, students test how irrational decision-making alters demand flexibility. This experiential approach explains why traditional cost-plus pricing fails in contexts where psychological thresholds dominate rational calculations (Thaler, 1985). Post-game debriefs further explore ethical tensions, such as exploiting loss aversion through urgency tactics, like “only two seats left!” and bridging theory with managerial practice. Discussions on ethical pricing naturally lead to concepts of equity theory (Adams, 1965), especially when students consider surge pricing or segmenting customers, which can trigger perceptions of unfairness (Alnes & Haugom, 2024; Chen et al., 2021).
Instructors are encouraged to incorporate a third, dedicated round focused explicitly on reference pricing and framing effects, rather than treating it as optional. This round can be inserted after the dynamic pricing simulation and before the debrief. In this round, each group is given a “reference price” and must present their selling price as either a discount or premium relative to it. Customer decisions are then made with the reference price visibly announced before each draw. This makes Prospect Theory’s mechanisms, anchoring, loss aversion, and framing, directly experiential and analytically comparable to the earlier static and dynamic rounds.
Evolution of Talluri
This adaptation significantly extends the original game by:
Modernizing Context: While the game’s core mechanics are transferable, the simulation is framed within the context of digital goods and services, such as a virtual event ticket. This shift does not alter the fundamental gameplay but enhances relevance for today’s students and provides a direct pathway to discuss the unique RM challenges in digital markets, such as near-zero marginal costs and the dominance of perceived value.
Deepening Theory: Integrating behavioral economics (Prospect Theory, anchoring, scarcity) and ethical considerations.
Providing Empirical Validation: Supplementing anecdotal evidence with quantitative data on learning outcomes (22% score improvement).
Expanding Pedagogy: Adding structured discussions on competition and ethics. This creates a more comprehensive, relevant teaching tool for the digital age.
Description of the Game
This simulation operationalizes the key adaptations introduced in Talluri’s (2009) game. Specifically, the product is framed as a digital service or virtual experience, shifting the focus from physical inventory to perishable digital capacity, thereby foregrounding near-zero marginal costs and perceived value. Additionally, behavioral economics principles, such as Prospect Theory, anchoring, and scarcity, are embedded in gameplay mechanics. Ethical trade-offs are explored in debriefs following pricing decisions. Lastly, the structured pre-post quizzes and engagement surveys provide measurable learning outcomes, while optional expansions allow instructors to tailor complexity and reinforce contemporary RM challenges.
Game Setup and Customer Valuations
The game simulates a revenue manager’s role in selling a fixed inventory, such as an all-inclusive tour or concert tickets to customers with varying valuations. Students first act as customers (providing personal valuations) and later as revenue managers (setting prices to maximize revenue). This dual perspective helps them grasp the interplay between pricing strategies and consumer behavior. It is important to note that the student groups are not competing with each other for customers within the same simulation run. Instead, each student group operates its own independent parallel simulation.
Setup Requirements
Class Size: 10 to 20 students (divided into four to five groups).
Materials: Index cards (one per student), a flip chart/whiteboard, and a visually appealing product example (e.g. an exotic nature safari or a pair of concert/festival tickets).
Product Details: Specify a perishable, high-value item, such as a 5-day all-inclusive safari, or a pair of music festival tickets with accommodations, to ensure wide valuation ranges. Clarify exclusions, such as airfare, to avoid confusion.
Key Terminology
Customer population: All WTP cards. Draw: Selecting one card. Customer arrival: The event of a draw. Round: A full cycle with a set number of draws. Departure: The service date (“days until departure” is announced).
Time Requirements and Structure
For a class of 20 students divided into four to five groups, the total gameplay for both simulations is ~90 to 110 minutes, including debriefing discussions. Static pricing should include at least two rounds (~10 min each), encompassing group price-setting, the simulation, and a results tally. Two rounds are essential for students to observe demand randomness and strategy adjustment. Dynamic pricing should include at least two rounds (~15 min each), as the need for frequent price-change discussions and tracking price history extends the duration. Instructors should allocate 20 to 30 minutes for a comprehensive debrief after all simulations are complete to solidify key learning moments.
Educational Level and Adaptability
The core game mechanics are effective across educational levels. The key difference lies in the depth of the theoretical debrief and the complexity of the optional expansions. For bachelor’s students, the primary learning objectives should focus on the practical aspects: the difference between cost-based and value-based pricing, understanding demand curves through revealed valuations, the impact of scarcity on pricing decisions, and the basic rationale for market segmentation. The debrief can focus on real-world examples, such as airline ticket pricing, hotel rates, rather than deep theoretical models. For Master’s students, as presented, the game serves as a foundation for exploring advanced theories and complex scenarios like competitive dynamics and risk management. The assignments can require a deeper analytical and strategic level.
Step 1: Collecting Customer Valuations
Each student writes their maximum willingness to pay (WTP) for the product on an index card. Emphasize that WTP should reflect personal valuation, not cost-based calculations, and no peer discussion to preserve independent judgments. Collect and shuffle cards to create a randomized “customer population.” Add pre-filled cards from past classes if needed (minimum 20 index cards total).
Step 2: Simulating Demand
For randomized demand, in each simulation round, randomly select 70% of the cards, such as 14 draws from a population of 20 cards, to mimic an uncertain market size. Occasionally, use smaller subsets, such as 30%, to highlight demand volatility. For revenue manager roles, student groups set prices for their “firm,” and the instructor reveals purchase decisions (accept/reject) for each customer card drawn, based on the posted price. For the key constraint, initially, capacity exceeds demand (no scarcity), forcing focus on valuation-based pricing.
Static Pricing Simulation
Group Preparation
Each team sets one fixed price for the entire simulation. Here, you should emphasize that capacity exceeds demand (no inventory constraints yet).
Simulation Process
The instructor shuffles and draws customer (student) cards one by one. For each draw, a single customer card is revealed. This customer evaluates the price independently and simultaneously against each group’s current price. The customer will buy from a group if their valuation is greater than or equal to that group’s price. Therefore, the same customer can “purchase” from multiple groups simultaneously (a customer valued at $900 buys from both a group pricing at $500 and a group pricing at $800). This structure allows the groups to efficiently compare the outcomes of different pricing strategies against the identical sequence of customer arrivals, which is the core pedagogical goal. Continue drawing cards and recording until all cards are drawn. See Table 1 for tracking the results. I recommend incorporating digital tools like Google Forms for real-time valuation collection, where student groups can follow along.
Static Pricing Tracking Valuation Results.
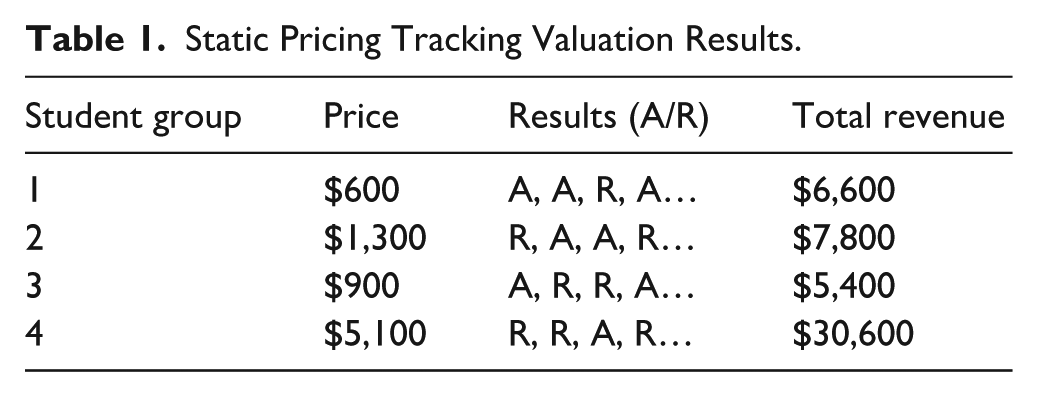
A critical design element is that specific WTP values are never disclosed; groups only see the purchase outcome (A/R). This mirrors the real-world “information gap” where managers know if a sale occurred, but not the customer’s maximum WTP. Therefore, forecasting relies on observed outcomes (the A/R sequence and the prices that caused them), not perfect data, forcing students to estimate the valuation distribution statistically.
Key Learning Moments
Cost-based pricing fails when two things happen: (1) students realize fixed costs are irrelevant, and (2) marginal costs are too low to guide pricing decisions. Value-based pricing emerges as groups use revealed customer behavior (the A/R pattern) to adjust prices between rounds, shifting from guesswork to data-informed decisions. Consequently, the initial wide price range ($500–$5,000) converges toward a narrower, more optimal band ($800–$1,200). Students will begin to understand demand uncertainty when random card draws simulate real market unpredictability, and the same price yields different results across simulation rounds.
Teaching Tips
Run two to three rounds to allow student groups to refine strategies. It is important to highlight anomalies and discuss why very high prices sometimes win. Lastly, emphasize observations you see from student groups, as students learn more from seeing actual purchase decisions than from theoretical models. After the static pricing rounds are complete, ask leading questions to transition to dynamic pricing. Questions could be: “What if we could change prices during the simulation?” or “How might customer segments change our approach?” You could also emphasize psychological pricing, such as $999 versus $1,000, and how this affects valuations.
Dynamic Pricing Simulation
Group Preparation
This simulation builds on the static pricing simulation by introducing price flexibility. This means student groups may change their price at any time, as often as they want. Students will learn how to adjust prices in response to the observed demand, forecast customer arrivals and valuations, and learn how time-based strategies succeed or fail.
Simulation Process
The instructor shuffles cards and draws the index cards one by one (keeping the remaining cards hidden as the student groups should not see how many “customers” are left). Before each card draw (customer arrival), student groups may adjust their price (or keep it the same). The instructor announces, “days remaining” (approximated based on cards left). After each price decision, compare the customer’s valuation to the student group’s current price and record (A/R). See Table 2 for tracking the results.
Dynamic Pricing Tracking Valuation Results.
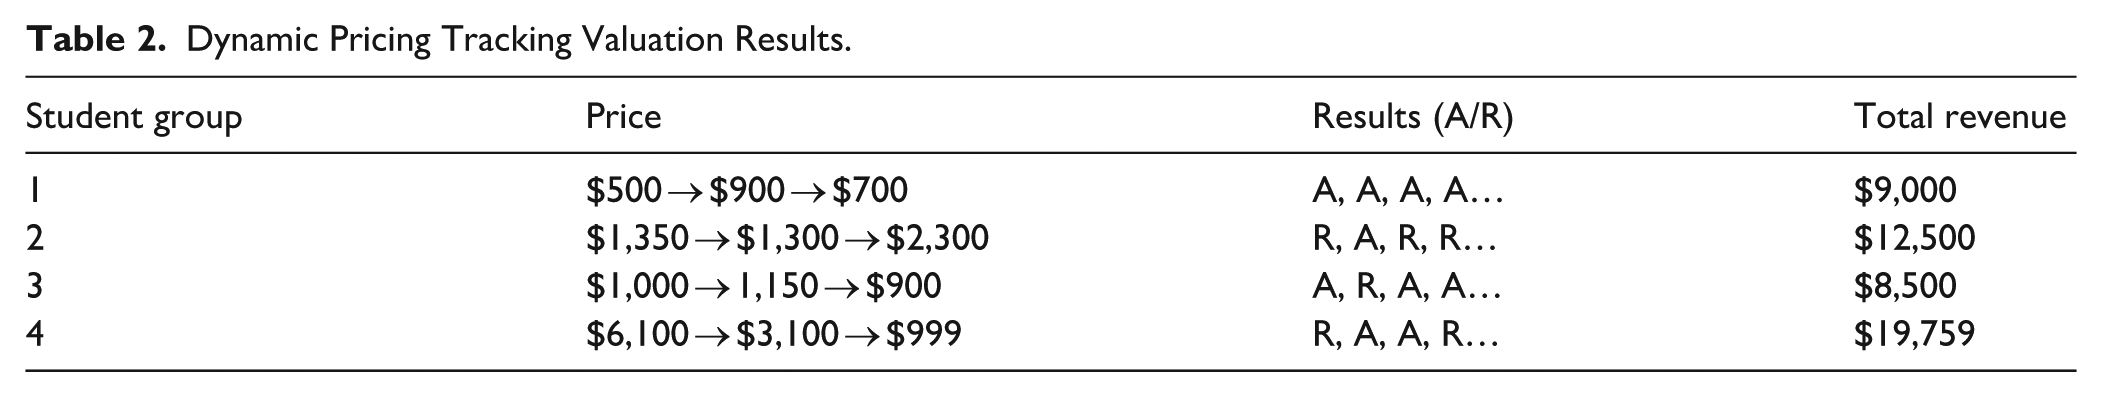
Student groups typically try one of three scenarios: (1) start with high prices and drop if demand is weak, (2) start low to fill capacity then raise prices, or (3) last-minute price cuts when few days remain in the sale.
Note on customer arrival and WTP patterns: In Talluri’s (2009) original game, the instructor pre-sorts the valuation cards to ensure that higher-WTP customers arrive later, simulating the real-world pattern where business travelers or urgent buyers often book closer to departure. In this adaptation, the deck remains fully randomized unless the instructor chooses the implement a structured arrival module. The pedagogical “hint” that late arrivals might have higher valuations, often delivered verbally during the simulation, serves two purposes: (1) it introduces the concept of time-based segmentation without artificially forcing the pattern and (2) it prompts students to consider how they would price if such a pattern existed, thereby exploring forecasting assumptions and strategic responses. If instructors wish to replicate Talluri’s exact arrival pattern, they can pre-sort the deck so that the second half of draws contains, on average, higher-value cards. Otherwise, the “hint” functions as a discussion trigger about beliefs in demand patterns and their influence on dynamic pricing psychology, even in the absence of guaranteed data.
Student groups typically try one of three scenarios: (1) start with high prices and drop if demand is weak, (2) start low to fill capacity then raise prices, or (3) last-minute price cuts when few days remain in the sale.
Key Learning Moments
Student groups might begin to realize that forecasting can be a problem, and the value of historical data can be helpful. Without knowing future demand, dynamic pricing feels like “guessing.” If this occurs, the instructor can emphasize the correlation between time and valuation. When students panic and lower prices at the last minute, it can be framed as a failure to manage reference prices effectively, potentially training customers to wait for deals and eroding long-term value (Alnes & Haugom, 2024; Lowengart, 2002). The instructor hints that late-arriving customers might have higher valuations (simulating business travelers), where some student groups test this by raising prices near “departure.” Additionally, the instructor’s announcement of “days remaining” leverages the scarcity effect (Zamfir, 2024), and students can observe how this urgency influences their own (and by extension, customers’) decision-making. Behaviorally, student groups can often over-rely on first-round static prices or overreact to a series of “rejects.” At this point, emphasize real-world strategy and think more like a revenue manager. This exercise provides a foundation for understanding advanced trends in RM, such as the move towards open and one-to-one pricing driven by AI and big data (Talón-Ballestero et al., 2022).
The transition from traditional dynamic pricing to open pricing, where prices are continuously adjusted based on a wide array of real-time data sources, and often made transparently available to customers, can be directly illustrated through the simulation’s mechanics, During the debrief, instructors can highlight how the students’ iterative price changes, made in response to limited observed demand (A/R outcomes), mirror the logic of algorithmic pricing systems that respond to live market signals. To extend the discussion, ask: “If you had access to real-time data on competitor prices, weather, social media sentiment, and individual customer browsing history, how would your pricing decisions change?” This connects the classroom exercise to modern RM systems that use AI to optimize prices across channels, often in a transparent or “open” manner (Talón-Ballestero et al., 2022). Futhermore, the ethical and perceptual challenges surfaced in the simulation, such as fairness, trust, and strategic waiting, are magnified in open pricing environments, where price changes are visible and frequent. Instructors can use the simulation outcomes to discuss how firms can balance responsiveness with relationship management, a key concern in the shift toward open revenue models.
Teaching Tips
Run two to three rounds, as more iterations will help students spot patterns. At any time in the simulation, pause for discussion, specifically after a group panics and drastically shifts pricing strategies. Ask leading questions such as, “Would customers learn to wait for last-minute deals?” or “How might this hurt long-term revenue?” Additionally, the instructor could ask, “What if we KNEW some customers book early? How would that change our strategy?”
Optional Game Expansions
To expand the game and make it more complex, the instructor could introduce theories and scenarios from the RM literature. One example could be to introduce a third customer segment or hybrid pricing models, such as a mid-tier valuation group or a “repeat purchaser” discount, drawing on principles of product design for RM (Anderson & Xie, 2016). While presented here as optional strategies, instructors are encouraged to consider incorporating a third customer segment as a structured variation within the core simulation rounds, particularly in the dedicated Prospect Theory round, to explicitly demonstrate how segmentation and behavioral pricing interact. This makes the game’s expanded contribution to teaching integrated with RM strategy more explicit and reproducible.
Another option is to transform the game from parallel play to direct competition. The instructor acts as an auctioneer. After groups secretly submit prices, the customer is assigned to the group with the lowest price at or below the customer’s valuation. This introduces game theory, price wars, and the concept of Nash Equilibrium. How to run it: (1) Groups submit hidden prices. (2) Instructor reveals all prices and draws a customer card. (3) Customer is assigned to the group with the winning (lowest) qualifying price.
A third option is to implement a “reference price” rule to explore the anchoring effects of Prospect Theory (Thaler, 1985) more deeply. How to run it: Before the simulation begins, announce a “standard” or “list” price for the product, such as $1,200, and display it prominently throughout the game. When groups set their actual selling prices, they must represent them in relation to this reference, for example, as a discount or as a premium. During the customer draw phase, the instructor should remind customers of the standard price before they make purchase decisions. After the simulation, debrief by asking: How did knowing the “standard” price influence your group’s pricing strategy? and Did customers seem more willing to buy at a price framed as a discount, even if the absolute price was high? This makes the psychological anchor tangible and shows how framing alters perceived value.
Lastly, introduce unpredictable events to teach demand forecasting under uncertainty and the value of robust pricing strategies. How to run it: Prepare a set of “event cards” before class. Examples include: “Breaking News: A competing festival announces same-date event” (reduce all customer valuations by 30% for the next three draws), “Unexpected positive review goes viral” (increase valuations by 20% for the next two draws), or “Sudden weather warning for event date” (cancel the next two draws, no customers arrive). During either the static or dynamic simulation, after a predetermined round, draw and announce an event card. Groups must immediately adjust their strategy in response. Debrief by discussing: How did the surprise affect your pricing confidence?, What data or flexibility would help you manage such shocks in reality?, and How can firms build pricing strategies that are resilient to uncertainty?
Assignments That Build on the Game
Post-Game Reflection
Individually, students can write a two to three-page reflection addressing: (1) pricing strategies to compare their group’s static versus dynamic approaches, (2) ethical considerations and if any pricing strategies felt exploitative where they discuss trade-offs between profit and fairness, and (3) forecasting challenges on how firm’s might mitigate uncertainty about future demand and how it impacts pricing decisions.
Demand Forecasting Group Exercise
Using the instructor’s records of customer valuations across all rounds, the student groups could plot the distribution of customer valuations, calculate the optimal static price, and simulate how changing mid-game prices affects total revenue. Lastly, student groups could recommend a pricing strategy for a hypothetical next round, supported by their analysis.
Pricing Strategy Case Study
Student groups can choose a company with perishable inventory and research how the company segments customers and sets prices, then interview a manager about their RM challenges. After the interview, the student groups will design a one-page RM strategy for the company, addressing price tiers and actionable improvements. Lastly, student groups could deliver a five-minute presentation of their results.
Evidence and Evaluation of the Game’s Efficiency in Enhancing Learning
Learning was measured by simulation across six cohorts and analyzed both qualitative and quantitative data from 120 participants.
Learning Impact Measurement
A 10-question multiple-choice quiz was administered before and after the simulation. The quiz assessed core RM concepts, including value-based pricing, demand elasticity, segmentation, and forecasting. A sample question included, “If 70% of customers value a product at ≥$200, and 30% at ≥$500, what static price maximizes expected revenue for unlimited inventory?” The average pre-simulation score was 55%, which increased to 77% post-simulation, an absolute improvement of 22%. The largest gains were observed in questions related to demand elasticity (+41%) and segmentation justification (+36%).
Engagement Measurement
Immediately following the simulation and debrief, students were asked to complete a short anonymous questionnaire. Engagement was measured via a direct question: “On a scale of 1 (not engaging) to 5 (very engaging), how would you rate this simulation activity?” The average rating was 4.6/5. The questionnaire also included an open-response section for comments. Thematic analysis revealed high perceived engagement, with students citing the “hands-on,” “competitive,” and “real-world” nature of the exercise.
If you are an ICHRIE member, you can access the Teaching Notes for this case study here: https://ichrie.memberclicks.net/jhtc. If you are not an ICHRIE member, the Teaching Notes will be published in a future Sage Business Cases (SBC) annual collection: https://sk.sagepub.com/cases. For more information, please contact
Footnotes
Funding
The author received no financial support for the research, authorship, and/or publication of this article.
Declaration of Conflicting Interests
The author declared no potential conflicts of interest with respect to the research, authorship, and/or publication of this article.