
Abstract
Background
Integrative medicine (IM) is a growing subspecialty among the American healthcare system, but little is known about geographical and sociodemographic variability in access to services.
Objective
To better understand access to IM healthcare services, we aim to: 1.) document the number of IM providers within the hospital service area (HSA) of various hospitals across the United States (US) and, 2.) explore the relationship between age, income, and race as predictors of the number of IM providers.
Methods
We conducted an environmental scan to document the number of IM providers including naturopathic, acupuncture, chiropractic, and massage therapy providers within the HSA of 16 US hospitals using state and national search databases. We examined predictors of the number of providers per HSA using population and demographic data from the U.S. Census Bureau. Search database quality was evaluated using the Center for Disease Control and Prevention Clear Communication Index.
Results
The number of IM providers varied from 11.6 – 67.4 providers/100,000 persons. Massage therapists were the most prevalent (n = 13.8/100,000), followed by chiropractors (n = 5.2/100,000), acupuncturists (n = 4.6/100,000), and naturopathic physicians (n = .5/100,000). Higher average household income and population >65 years old were associated with more IM providers within an HSA (Rate Ratio (RR) 4.22, 95% CI 1.49-12.01; and 1.14, 1.05 - 1.24, respectively). In addition, the quality of publicly available search databases varied widely among US states (4.84 - 8.00/10), but less so among IM provider types (6.21 - 7.57/10).
Conclusions
The high variability in number of IM providers and search database quality among various HSAs across the US warrants further investigation into factors influencing access to services. Our findings regarding income and older adult population raise concern for inequitable access to care, but are also promising when considering the increasing demand for healthcare services among the older adult population.
Introduction
Integrative medicine (IM) is a growing subspecialty among the American healthcare system. IM is expanding within the United States (US) and is now incorporated within the US Veterans Health Administration,1,2 US Department of Defense, 2 and among leading US academic institutions. 3 The clinical application of IM expands broadly throughout various medical fields and patient populations to provide a patient-centered care experience, 4 and there is particular interest in IM for non-pharmacological pain management 5 and mental health support 6 to help address these public health crises.7-9 IM by definition, “focuses on the whole person, is informed by evidence, and makes use of all appropriate therapeutic and lifestyle approaches, healthcare professionals and disciplines to achieve optimal health and healing.” 10 IM providers work in collaboration with established standards-of-care in medicine, and provide evidence-based options to patients seeking adjunctive supportive care to challenging health concerns.
There is wide variation in both the type of providers that consider themselves to be “integrative” and the treatment modalities used within the field of IM. 11 A medical doctor or osteopathic doctor who has completed additional IM training may focus on incorporating integrative approaches with their patients such as exercise, nutrition, dietary supplements and/or mind/body approaches. Non-conventional medical providers, such as acupuncturists, chiropractors, naturopathic physicians, and massage therapists, to name a few, receive focused training in IM approaches and the patient-centered approach to care during their medical education. The lack of clearly defined providers and modalities that encompass IM make it challenging to establish gold-standard approaches to IM health services research.
There is a paucity of data on access to IM services. Examining access to services is a complex assessment since no single definition of access exists, and access is a multidimensional variable influenced by need, income, insurance coverage, geographic area of residence, race, ethnicity, sexual orientation, age, language spoken, transportation, technology literacy, and disability status to name a few.12,13 While some studies examine methods to improve access to IM services, 14 more data is needed on the facilitators and barriers to accessing IM services, especially at the health system level. Previous studies indicate health disparities exist regarding the use of IM, with numerous sociodemographic factors such as race, ethnicity, education, and income influencing use of IM. 15 The barriers to IM use among the underserved include lack of awareness, availability, accessibility, and affordability. 15 However, there is an important difference between use of IM and access to IM, and more fundamental data on access to IM services is needed.
IM services may play a critical role in addressing the healthcare needs for specific at-risk populations, such as the aging American population.16,17 Various IM modalities such as acupuncture, yoga, tai chi, and mindfulness have been shown to provide non-pharmacological options for pain management, mental health, and cognitive support, all of which are increasingly important among older adults.6,18-21 Older adults have high rates of hospitalization and emergency department (ED) use,22,23 and IM services may play a unique role in providing community-based care options to help reduce ED and hospital utilization. 24 The focus of this study is to examine the variability in access to IM providers around various US hospitals to focus on community-based IM services in these regions.
This study is a sub-project of the Primary Palliative Care for Emergency Medicine (PRIM-ER) research study, which is a pragmatic trial of primary palliative care training, education, and technical support to emergency providers. 25 Our main objective was to document the number of IM providers within the (HSA) of various US hospitals. We included acupuncture, chiropractic, massage therapy, and naturopathic providers. Our secondary objective was to investigate predictors of the number of providers and evaluate the quality of publicly available IM provider databases. Our overall goal is to support future study examining access to integrative services.
Methods
Search Strategy
Site and Hospital Service Area Characteristics.

PA = Pennsylvania, MA = Massachusetts, MI = Michigan, DE= Delaware MN = Minnesota, TX = Texas, LA = Louisiana, OH = Ohio, NJ = New Jersey, CA = California, FL = Florida, UT = Utah, CT = Connecticut
HSA = Hospital Service Area. AA = African American. AIAN = American Indian and Alaskan Native. NHPI = Native Hawaiian and Pacific Islander
Population, income, and race data obtained from the US Census Bureau American Community Services (ACS) 2019 5 Year Estimate
We used publicly available online national and state-based search databases that list the name and practice location of IM providers to compile a list of providers within each hospital’s HSA. The databases were primarily obtained via national and state-based provider organizations, such as the American Chiropractic Association, or the Pennsylvania Association of Naturopathic Physicians, etc. If a national or state-based search database was not available for a given type of IM provider, then a more generalized search database that includes IM providers was identified and used, such as www.healthprofs.com. In total, 55 search databases were used for this scan. See Supplemental Table 1 for a full list of included search databases.
Search databases used for this study were designed to locate providers in various ways. Most often, the search databases required entering a zip code and selecting a search radius around that zip code to locate providers within a defined geographic area. When conducting the search, the hospital zip code was used as a central location, and a search radius of 50 miles was applied to ensure all HSA zip codes fell within the search radius. All search results were reviewed until zip codes no longer fell within the HSA of interest. On occasion, search databases provided results per county. In this case, all counties located within an HSA were identified and all search results for each county were reviewed for inclusion. When results were displayed by city, search results for the entire metro area of a city, or cities, were reviewed to see if any part of a city’s metro area was within the HSA. If a search database provided results per zip code, the results for each zip code included within an HSA were reviewed. Only providers who were located within a zip code that is included in a hospital’s HSA were included in this study. The same methodology was used for all locations to ensure a systematic and reproducible approach. A duplication scan was run via Microsoft Excel and any duplicate provider entries were removed. If a provider’s practice location was listed as closed on a search database, it was excluded from our final list of active providers.
Database Quality Assessment
Authors J.B and J.H independently rated the quality of each search database using the first ten items of the CDC Clear Communication Index (CCI). 28 The CCI was developed to identify important characteristics to enhance clarity of public health communications. The CCI contains 20 items (questions), measured across 4 categories: (1) call to action, language, design, (2) state of science and behavioral recommendation, (3) numbers, and (4) risks. Category 1 contains ten items while categories 2 to 4 contain the remaining 10 items. Each item was scored either 0 or 1 depending on the presence or absence of material in the search database website being accessed. For example, item 1 of the CCI states, “Does the material contain 1 main message statement?” If the website being evaluated did in fact contain 1 main message statement, it received a score of 1, if not then a score of 0. Although the CCI has 20 items, we used the first 10 (category 1 items) since the last 10 were not relevant to this study (eg, assessment of behavioral recommendations, numbers, and risk). Increasing scores represent increasing clarity of information. 28 Hence, for this study, the minimum and maximum raw CCI scores were 0 and 10, respectively. The raw CCI scores of the independent reviewers were averaged for national and state-level search databases. Using the raw CCI scores, we calculated the inter-rater agreement among the raters using a two-way random intra-class correlation. The intra-class correlation, a measure of reliability, was measured from the raw CCI scores and reported as values ranging from 0 to 1; 1 representing perfect agreement and 0 representing random agreement. Intra-class correlation was used because the CCIs were measured on an interval scale.
Review of State Regulations for Integrative Medicine
To highlight variables that may influence the decision of an IM provider to locate, or not locate, in a certain region of the country, we conducted a search of IM professional association websites to summarize variations in state licensure and certification requirements for acupuncturists, chiropractors, massage therapists, and naturopathic physicians. We also further examined state variations in scope of practice, prescriptive authority, insurance coverage, and pay parity for naturopathic physicians.
Data Analysis
Population, demographic information, and average annual household income for each HSA were identified using the U.S. Census Bureau’s American Community Survey (ACS) 2019 5-year estimates. 29 ACS data was provided using Zip Code Tabulation Areas (ZCTAs), so a crosswalk file linking zip codes to ZCTAs, obtained via Dartmouth Atlas Data, was used to determine the population, demographics, and average household income for each HSA. Total population for each HSA was calculated by summing population across the ZCTAs. The population for each racial sub-group for each HSA were also summed across the ZCTAs to find the total population for each racial group. HSA average household income was based on averaging ZCTA household income weighted by the number of ZCTA households. We used a negative binomial regression model to identify predictors of total IM providers/100,000 persons. We created a variable for “other race” that included the original “other” race category provided on the ACS data as well as American Indian and Alaskan Native, Asian, Native Hawaiian and Pacific Islander. We included this “other race” category and percent black/AA as covariates, leaving out of the model the percent white population as the reference group. We also included various age categories as a variable of interest. We used the log offset for total population divided by 100,000. This study was approved by the New York University Grossman School of Medicine Institutional Review Board.
Results
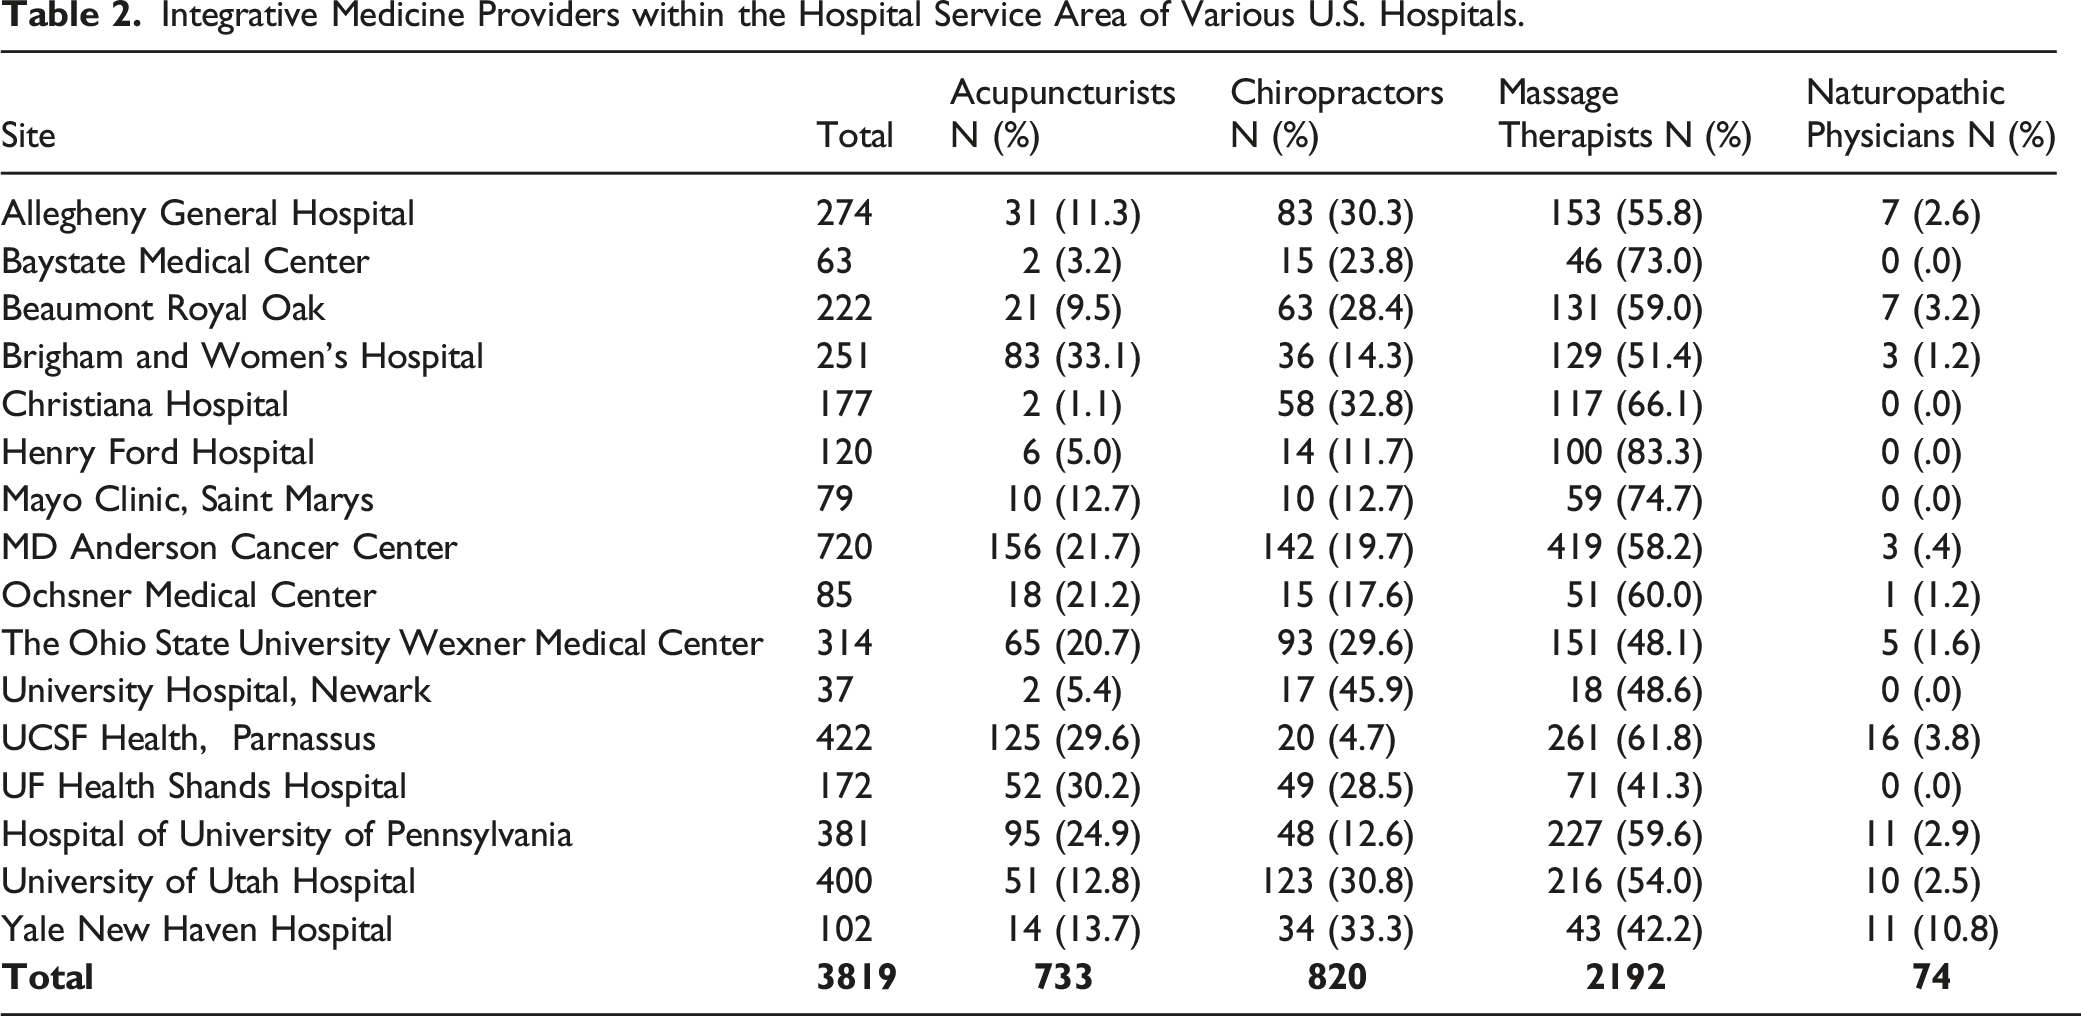
Integrative Medicine Providers within the Hospital Service Area of Various U.S. Hospitals.
Negative Binomial Regression Model Predicting the Number of Integrative Medicine Providers.

Clear Communication Index (CCI) Ratings for Integrative Medicine Search Databases.

Maximum CCI score = 10.
CCI ratings are the average of 2 independent website evaluations.
Number of search databases is the number of databases evaluated and used to determine the average CCI score.
Regulation of Integrative Medicine Providers per Site.

Source of Information:
Acupuncturists: https://www.nccaom.org/state-licensure/
Massage therapists: https://www.abmp.com/practitioners/state-requirements
Naturopathic physicians: https://aanmc.org/licensure/
Discussion
The overall goal of this study is to develop baseline data for future studies to examine issues around access to IM services. This is the first study to use an environmental scan to document the number of providers within the HSA of numerous hospitals across the country. There is no national provider list for IM services; therefore, the environmental scan provides a novel approach for identifying providers. We were also able to include multiple IM provider types in our scan, examine predictors of the number of providers, and evaluate the quality of IM search databases. To the author’s knowledge, an evaluation of numerous IM provider search databases has not been completed before.
The primary outcome of our study was the number of IM providers/100,000 persons. Per site, the number of providers varied from 11.6 – 67.4 providers/100,000 persons, and per provider type, massage therapists were the most prevalent IM providers (n = 13.8/100,000) and naturopathic physicians the least prevalent (n = .5/100,000). For comparison, the number of licensed US medical providers (medical doctors and osteopathic doctors) in 2018 was 301/100,000 persons.
30
From the perspective of access to services, it is clear the lack of licensed IM providers may be a significant limiting factor to accessing care. For primary care, a provider/population ratio less than 1/3,500 (or 28.57/100,000 persons) indicates a shortage of providers.
31
In our analysis, 10 of the 16 sites had a smaller overall IM provider/population ratio than 1/3,500, and 14 of the 16 sites had smaller provider/population ratios when considering the individual IM provider types (see Figure 1). Integrative Medicine Services per 100,000 persons Within the Hospital Service Area of Various U.S. Hospitals. A = Total integrative medicine providers per 100,000 persons. B = Massage therapists, chiropractors, acupuncturists, and naturopathic physicians per 100,000 persons. 
The results of our study align with similar studies indicating higher income is associated with greater use of IM services. 32 However, our results differ by establishing a relationship between household income and number of providers, and not use of providers. We identify an important relationship between a greater number of providers with increasing average household income across large geographic areas compared to most studies examining income at the level of the individual. This regional assessment can be helpful when considering public health and health system approaches to examining access to care at the county, state, or regional level, or comparing urban vs rural impacts on accessing care. Additional studies on regional assessments of income and IM services can support policy development, resource allocation, and/or addressing health disparities in low-income regions.
The lack of insurance coverage for many IM services has previously been identified as an important variable regarding access to, and use of, IM, and important to consider in light of our findings regarding average household income.33,34 The out-of-pocket expense associated with IM services may force providers to relocate to regions with higher income to attract patients who can afford services. Similarly, states or regions with insurance carriers that cover a greater breadth of IM services are also expected to attract more IM providers, and differences in reimbursement rates, or services covered, between Medicaid, Medicare, and private insurance carriers may support regional differences in the relationship between average household income and number of providers. This provides an interesting avenue for future studies on the impact of insurance coverage and IM service access.
Our finding of a significant correlation between a higher proportion of individuals 65 years and older with greater number of IM providers is less often noted in the research literature. This result is promising considering more IM providers may be physically located near higher proportions of older adults to provide care for this population at high risk for complications of pharmacological therapies. Older adults experience a high burden of symptoms and may seek care from IM providers who offer non-pharmacological options. 17 While we adjusted for average household income in our analysis, older adult income may be lower due to retirement, while their overall wealth higher compared to younger populations. Greater wealth, instead of income, may be a contributing factor to the relationship we observed between the older adult population and increased number of IM providers.
An additional variable that may influence the number of providers within an HSA is availability of licensure and state regulation for IM professions. Not all states offer licensure for IM providers, which can limit the scope of practice. In addition, licensure can provide protection to the use of a provider’s title, and the lack of licensure may limit the regulation of educational standards. These variables may influence a provider’s decision to locate within a specific state depending on the state’s level of regulation/licensure. There is also wide state-by-state variation in scope of practice, insurance coverage, and reimbursement pay parity for certain IM providers that may also influence a provider’s desire to locate in a specific area. These variables may influence a provider’s decision to locate in a specific state due to their preference to obtain a license, have the availability to provide specific services, or have the ability to credential with insurance providers. A good example is the naturopathic profession, and variations in regulation, scope of practice, insurance coverage, and pay parity for the states included in this study for naturopathic physicians is summarized in Supplemental Table 2.
Our review of IM search database quality using the clear communication index is also an important variable that may impact access to care. There are no national provider lists for IM services, or an established gold standard for locating or identifying providers. Patients must therefore rely heavily on online resources to locate services. Older adults have reduced technology literacy, and dysfunctional or unclear search databases may present a significant barrier to obtaining information on local IM providers. It is unclear why certain states such as Louisiana have a higher CCI score (8.00/10) compared to others, such as Florida (4.84/10). It may be due to differing amounts of resources state-based IM organizations contribute to developing their search databases, such as funding and hiring professional web developers. Further assessment is required to determine the cause of the variations in database quality. Our intra-class correlation of .72 indicates a good level of inter-rater reliability between our 2 independent coders. 35 Therefore, our study suggests clarity of online databases to locate IM providers should be considered in future studies examining access to IM care, and our present study highlights wide variations in database quality may exist.
Limitations
It is important to note several limitations with our study methodology. First, we were limited to the HSAs included in the PRIM-ER trial which, while geographically diverse, were not nationally representative. In addition, HSAs are large geographic areas and wide variations in demographics, incomes, etc. can exist within a single HSA that may influence the relationship with number of IM providers. It is likely not all providers included in this study identify as an integrative medicine provider. Some may provide alternative medicine services and be less likely to integrate themselves and their services within the greater healthcare system. Also, the number of providers does not serve as a proxy for access to care, with previously identified limitations in the use of provider-to-population ratios to assess access. 13 While all attempts were made to create a systematic scan, variations may exist in search methodology due to how the search databases are created, how often they are updated, etc. In addition, we included search databases associated with the recognized state and federal organizations for each provider-type, but we were unable to include every available online IM search database, which may influence our results. We did not include all types of IM providers due to the wide scope of various providers, such as those who practice traditional Chinese medicine, Ayurvedic medicine, or others. This could impact the relationships we identified between race, age, and income on number of IM providers. Future considerations for research include examining trends within each HSA to monitor differences within smaller geographic regions, such as comparing zip codes. In addition, including more IM provider types and examining changes in number of IM providers and HSA characteristics over time could provide additional insight into the relationships we explore in this study.
Conclusion
We identified multiple variables related to the number of IM providers across numerous HSA throughout the country. Higher household income and greater proportion of older adults are significantly associated with a higher number of providers within an HSA region. We also found wide variations in the quality of search databases used to identify IM providers. While none of these variables serve as a direct proxy for access to care, they may be contributing factors that can influence access to services. As the country struggles with a shortage of providers, 36 health disparities, 15 and high healthcare utilization, 22 it is time to consider the role of IM providers within the greater US healthcare system and continue to identify facilitators and barriers to accessing IM care.
Supplemental Material
Supplemental Material - Household Income and Older Adult Population Predict Number of Integrative Medicine Providers Around US Hospitals: An Environmental Scan Study
Supplemental Material for Household Income and Older Adult Population Predict Number of Integrative Medicine Providers Around US Hospitals: An Environmental Scan Study by Jacob D. Hill, Abigail M. Schmucker, Nina Siman, Keith S. Goldfeld, Allison M. Cuthel, Oluwaseun J. Adeyemi, Eliot Edwards, Jean-Baptiste Bouillon-Minois, and Corita R. Grudzen in Political Research Quarterly
Footnotes
Author Contributions
JDH: Conceptualization, Methodology, Formal Analysis, Investigation, Data curation, Writing-Original draft preparation, Writing – Review and editing, Funding acquisition. AMS: Formal analysis, Investigation, Data curation, Writing- Original draft preparation, Writing- Review and editing. NS: Validation, Data curation, Writing-Original draft preparation, Writing – Review and editing. KSG: Validation, Data curation, Writing-Original draft preparation, Writing – Review and editing, Supervision. AMC: Writing- Original draft preparation, Writing- Review and editing, Supervision, Project administration. OJA: Validation, Writing-Original draft preparation, Writing – Review and editing. EE: Writing-Original draft preparation, Writing – Review and editing. JBB: Formal analysis, Investigation, Data curation, Writing-Original draft preparation, Writing – Review and editing. CRG: Conceptualization, Methodology, Writing-Original draft preparation, Writing – Review and editing, Supervision, Funding acquisition
Declaration of Conflicting Interests
The author(s) declared no potential conflicts of interest with respect to the research, authorship, and/or publication of this article.
Funding
The author(s) disclosed receipt of the following financial support for the research, authorship, and/or publication of this article: This work is supported within the National Institutes of Health (NIH) Health Care Systems Research Collaboratory by cooperative agreement (UG3/ UH3 AT009844) from the National Institute on Aging. This work also received logistical and technical support from the NIH Collaboratory Coordinating Center through cooperative agreement U24AT009676. Support was also provided by the NIH National Center for Complementary and Integrative Health Administrative Supplement for Complementary Health Practitioner Research Experience through cooperative agreement (UH3 AT009844) and by the National Center for Complementary and Integrative Health of the National Institutes of Health under award number (UH3AT009844). The content is solely the responsibility of the authors and does not necessarily represent the ofcial views of the National Institutes of Health.
Supplemental Material
Supplemental material for this article is available online.
References
Supplementary Material
Please find the following supplemental material available below.
For Open Access articles published under a Creative Commons License, all supplemental material carries the same license as the article it is associated with.
For non-Open Access articles published, all supplemental material carries a non-exclusive license, and permission requests for re-use of supplemental material or any part of supplemental material shall be sent directly to the copyright owner as specified in the copyright notice associated with the article.