
Abstract
Background
Network analysis provides a new method for conceptualizing interconnections among psychological and behavioral constructs.
Objective
We used network analysis to investigate the complex associations between depressive symptoms and patient activation dimensions among patients at elevated risk of cardiovascular disease.
Methods
This secondary analysis included 200 patients seen in primary care clinics. Depressive symptoms were assessed using the 21-item Beck Depression Inventory. Patient activation was measured using the 13-item Patient Activation Measure. Glasso networks were constructed to identify symptoms/traits that bridge depressive symptoms and patient activation and those that are central within the network.
Results
“Self-dislike” and “confidence to maintain lifestyle changes during times of stress” were identified as important bridge pathways
Conclusions
Bridge pathways identified in the network may be reasonable targets for clinical intervention aimed at disrupting the association between depressive symptoms and patient activation. Further research is warranted to assess whether targeting interventions to these central symptoms may help resolve other symptoms within the network.
Introduction
Primary care patients at risk of chronic illness like heart disease and type 2 diabetes must be engaged and activated to participate in their own care. Patient activation, a measure of patients’ knowledge, skills, and confidence to enact relevant health behaviors, plays a critical role in the self-management of chronic disease. 1 Those with high levels of patient activation are more likely to have their healthcare needs met, receive timely care, and gain support from healthcare providers; this in turn improves both their satisfaction with and outcomes of healthcare. 2
While the link between patient activation and health outcomes has been established, increasing attention is being paid to the link between patient activation and psychological factors. Importantly, depressive symptoms are the most frequently assessed and are strongly associated with patient activation. 3 The directionality of the relationship is equivocal. Depressive symptoms negatively influence a patients’ confidence to engage actively in their healthcare, which can lead to increased avoidance behaviors that directly affect level of functioning.4-6 Conversely, lack of patient activation results in depressive symptoms, as the inability to self-manage sustained disease can complicate a patients’ psychological condition. 7
Given the complexity of the therapeutic regimen for preventing cardiovascular disease (CVD) and diabetes (i.e., regular exercise, low-salt diet, taking medications for hypertension and cholesterol, and stress management), patient activation may be especially crucial in patients at elevated risk of CVD and/or type 2 diabetes. Simultaneously, depressive symptoms are common in those at risk for CVD, whose lifetime prevalence of depression is approximately 1740%. 8 Numerous studies found a strong relationship between depressive symptoms and patient activation in high CVD risk populations.9-12 However, previous studies among patients with CVD or high CVD risk in the primary care setting have often failed to address the dynamic nature of depressive symptoms and patient activation. They typically rely on the sum scores of equally weighted measurement items. Subsequently, there is limited information regarding the significance of individual symptoms which might be optimal targets for intervention. Moreover, the lack of consideration of heterogeneity in depressive symptoms may result in these studies not providing notable insight into the precise pathways linking depressive symptoms and patient activation. For instance, there may be specific symptoms of depression, such as fatigue or low self-worth, that drive the negative association between depression and patient activation.
Network analysis, stemming from network theory, may address the shortcomings of more simplistic methods. In the application of network analysis in psychological studies, a psychological construct is conceptualized as networks of observed indicators (i.e., symptoms) that influence one another, not as an underlying disease entity.13,14 In the network, symptoms are considered separate “nodes” that interact with other nodes via “edges.” Of note, network analysis can help identify central nodes (e.g., core symptoms). Central nodes are often used to identify the best possible intervention targets, as they are thought to represent the most influential nodes in a network connected with most nodes or with stronger connections. 15 In addition, network analysis may provide insight into the association between 2 relatively distinct psychological or behavioral constructs. 16 Specifically, network analysis can identify “bridge nodes” that are theorized to constitute pathways potentially connecting psychological or behavioral networks.
Overall, we aimed to use network analysis to understand the complex links between depressive symptoms and patient activation in primary care patients at elevated risk for CVD or type 2 diabetes. This study had 2 objectives. First, we explored the structure of the depressive symptom–patient activation network and identified its central nodes. Second, we examined bridge nodes between depressive symptoms and patient activation.
Methods
Design
This secondary analysis used baseline data from a clinical trial evaluating the effectiveness of 2 interventions for patients with elevated risk for CVD and/or type 2 diabetes. 17 The 2X2 parent trial aimed to evaluate the effect of incorporating genetic risk information into standardized risk assessment for CVD and type 2 diabetes, crossed with health coaching, on health behavior change and clinical outcomes. Details of the clinical trial have been published previously, 17 and the study is registered at ClinicalTrials.gov (registration number NCT01884545).
Analysis Sample
Analyses were based on 200 primary care patients (age = 47.72 ± 11.56 years; 60.0% male) at primary care clinics who had at least 1 risk factor for either CVD or type 2 diabetes, defined in the inclusion criteria as follows: (1) age 18 to 65 years; (2) presence of at least one of the following risk factors: body mass index ≥ 25 kg/m2, fasting blood glucose > 100 and ≤ 125 mg/dL, HbA1c > 5.7% ≤ 6.4%, systolic blood pressure ≥ 130 mmHg, total cholesterol ≥ 200 mg/dL, triglyceride ≥ 150 mg/dL, and low-density lipoprotein ≥ 129 mg/dL; (3) regularly take at least one medication for these risk factors; (4) have an active email address and internet access; (5) able to speak, write, and understand English; and (6) able and willing to give informed consent.
Exclusion criteria included (1) diagnosed coronary heart disease or type 2 diabetes, as the parent study was a secondary prevention trial; (2) inability to participate in physical activity; or (3) any serious medical conditions that would prevent them from participating and/or undermine interpretation of the outcomes (e.g., cancer, renal failure, and stroke). Study coordinators and other study personnel identified potential participants through screening procedures, a survey of the electronic medical record and provider referrals.
Ethical Approval
All procedures performed in studies involving human participants were in accordance with the ethical standards of the institutional and/or national research committee and with the 1964 Helsinki Declaration and its later amendments or comparable ethical standards. Institutional review board approval was obtained at Travis Air Force Base clinical research center and Duke University Medical Center (Protocol Pro00039569). Participants were given informed consent papers, which they signed. The purpose and requirements of the study were explained before their participation.
Measurements
Depressive symptoms
Depressive symptoms were measured by the 21-item original Beck Depression Inventory (BDI, Supplemental material). The BDI is a 21-item self-administered questionnaire for assessing the severity of depressive symptoms. 18 The contents of this scale reflect the cognitive, affective, and somatic symptoms of depression. Each item is scored from 0 to 3, and the total score, which is the sum of the scores from each item, ranges from 0 to 63; higher scores indicate higher levels of depression. The BDI has been validated in cohorts of individuals with or without psychiatric disorders and has high internal consistency. 19 The original BDI scale was chosen rather than the newer version given the abundance of studies on its predictive validity for CVD. 20 In the present study, Cronbach’s alpha for the depression scale was .89.
Patient activation
Patient activation was measured using the 13-item Patient Activation Measure (PAM), which assesses self‐reported knowledge, skill, and confidence of patients in the self‐management of their health and chronic conditions. 21 The PAM was developed using the Rasch model 22 and has been validated in the general US population. Each item is rated on a 4-point Likert-type scale. The sum score ranges from 13 to 52; higher scores represent higher levels of patient involvement.
Statistical Analysis
Before the main analysis, descriptive statistics including mean and standard deviation (SD) were performed for individual and total item scores on the scale. Pearson correlation was used to ascertain the interrelationship between the total score of the BDI and the total score of the PAM.
Network estimation and centrality
The R package bootnet was used for network estimation, as it performs well with complex data and small sample sizes. 23 The primary function of the bootnet package is the estimateNetwork, which automatically calculates the correlation matrix and uses the least absolute shrinkage and selection operator (LASSO) with extended Bayesian information criterion (EBIC) model selection. The EBIC procedure uses a hypertuning parameter, gamma (γ), that helps determine the extent to which EBIC prefers sparser models. 24 In this study, the value of γ was set to the default value of .25.
Because the data included ordinal items, polychoric correlations were computed and a Gaussian graphical model was estimated. This model comprises nodes that represent items and edges between the nodes that can be interpreted as partial correlations with values ranging from −1 to +1; partial correlations represent the association between 2 nodes after controlling for their associations with all other nodes. The LASSO is used to reduce small or unstable partial correlations to 0 in order for the network to reflect only the more robust edges. 25
Four centrality indices identified the most central nodes within the depressive symptom–patient activation network: strength, betweenness, closeness, and expected influence. 26 Strength centrality refers to the sum of the edge weights linked to a node. Strength centrality is particularly important for psychological and behavioral networks as it reflects the likelihood that activation of a certain symptom will be followed by the activation of other symptoms. Betweenness centrality measures how often a node is located on the shortest path between 2 other nodes; this indicates the node’s potential to affect other nodes within the network. Closeness centrality refers to the inverse sum of the shortest paths between a node and all other nodes in the network. Expected influence is similar to strength centrality but does not use the absolute value of edges in summation, thereby providing a measure of overall connectivity in networks with both positive and negative edges. Overall, nodes that have higher centrality are more central to the network and have more frequent and stronger relationships with other nodes than do nodes with lower centrality. These indices are important for identifying which nodes may possibly drive the psychological or behavioral network.
Bridge nodes
Summary Statistics for the BDI and the PAM Items (N = 200).

Abbreviations: BDI = Beck Depression Inventory, PAM = Patient Activation Measure, SD = standard deviation.
Estimation of network accuracy and stability
We examined network accuracy and stability using the method of Epskamp et al 23 with the bootnet package. First, we estimated accuracy of edge weights by determining their 95% confidence intervals (CIs) derived from 1500 nonparametric bootstrap samples. Second, we evaluated the stability of centrality indices through case-dropping subset bootstrap analysis, in which centrality indices are repeatedly calculated from subsets of data with an increasing proportion of subjects dropped. 24 Stability was quantified by computing a correlation stability coefficient (CS-coefficient) which is the maximum proportion of cases that can be removed from the sample to retain a correlation of at least .7 between the original centrality indices (full sample) and those derived from subsamples. 24 Coefficient values of at least .25, and preferably above .5, render centrality values interpretable. 22 Third, we used the bootstrapped difference test to determine whether 2 edge weights or 2 nodes (in terms of strength and expected influence) significantly differed with respect to the other nodes within the network; the difference was computed with 95% nonparametric bootstrap CIs (1500 bootstrap samples).
Missing data
Missing data were handled through multiple imputation, which is considered the best practice for managing missing data within a network analysis. 27 The percentage of missing data in the current sample was between 1.0% and 10.5%, and the results of network analysis were similar before and after data imputation.
Results
The means and standard deviation (SD) of BDI and PAM items were calculated and presented in Table 1. For BDI, the overall mean score was 6.3 (SD = 6.46). For PAM, the overall mean score was 41.9 (SD = 4.80). Pearson correlation tests revealed a significant negative relationship (r = −.28) between the BDI scores and PAM scores (p < .001).
Figure 1 illustrates the depressive symptom–patient activation network. Blue (red) edges indicate positive (negative) LASSO-regularized partial correlations. Thicker (thinner) lines represent stronger (weaker) correlations. Figure 1 suggests that associations are strongest between nodes of the same psychological construct. Examining the edge weights within the depressive symptom items, the strongest edges were between BDI-4 (loss of satisfaction) and BDI-12 (loss of interest in people; part r = .30), BDI-6 (punishment feelings) and BDI-3 (feeling a failure; part r = .29), BDI-6 and BDI-9 (suicidal ideation; part r = .27), and BDI-7 (self-dislike) and BDI-14 (look unattractive; part r = .26). Within the patient-activation items, the strongest edges were between PAM-2 (recognition of an active role in healthcare) and PAM-1 (responsibility for taking care of own health; part r = .47), PAM-13 (confidence to maintain lifestyle changes during times of stress) and PAM-10 (ability to maintain lifestyle changes; part r = .31), PAM-2 and PAM-3 (confidence in managing health problems; part r = .31), and PAM-9 (knowledge on treatment options) and PAM-8 (an understanding of health problems; part r = .28). The strongest edge between the depressive symptom items and patient activation items was between BDI-7 and PAM-13 (part r = −.11). Graphical LASSO using Polychoric Correlation (N = 200)/Note: In the visualization of the networks, blue lines were used to represent positive edges and red lines were used to represent negative edges. The thicker and more saturated the line, the stronger the connection.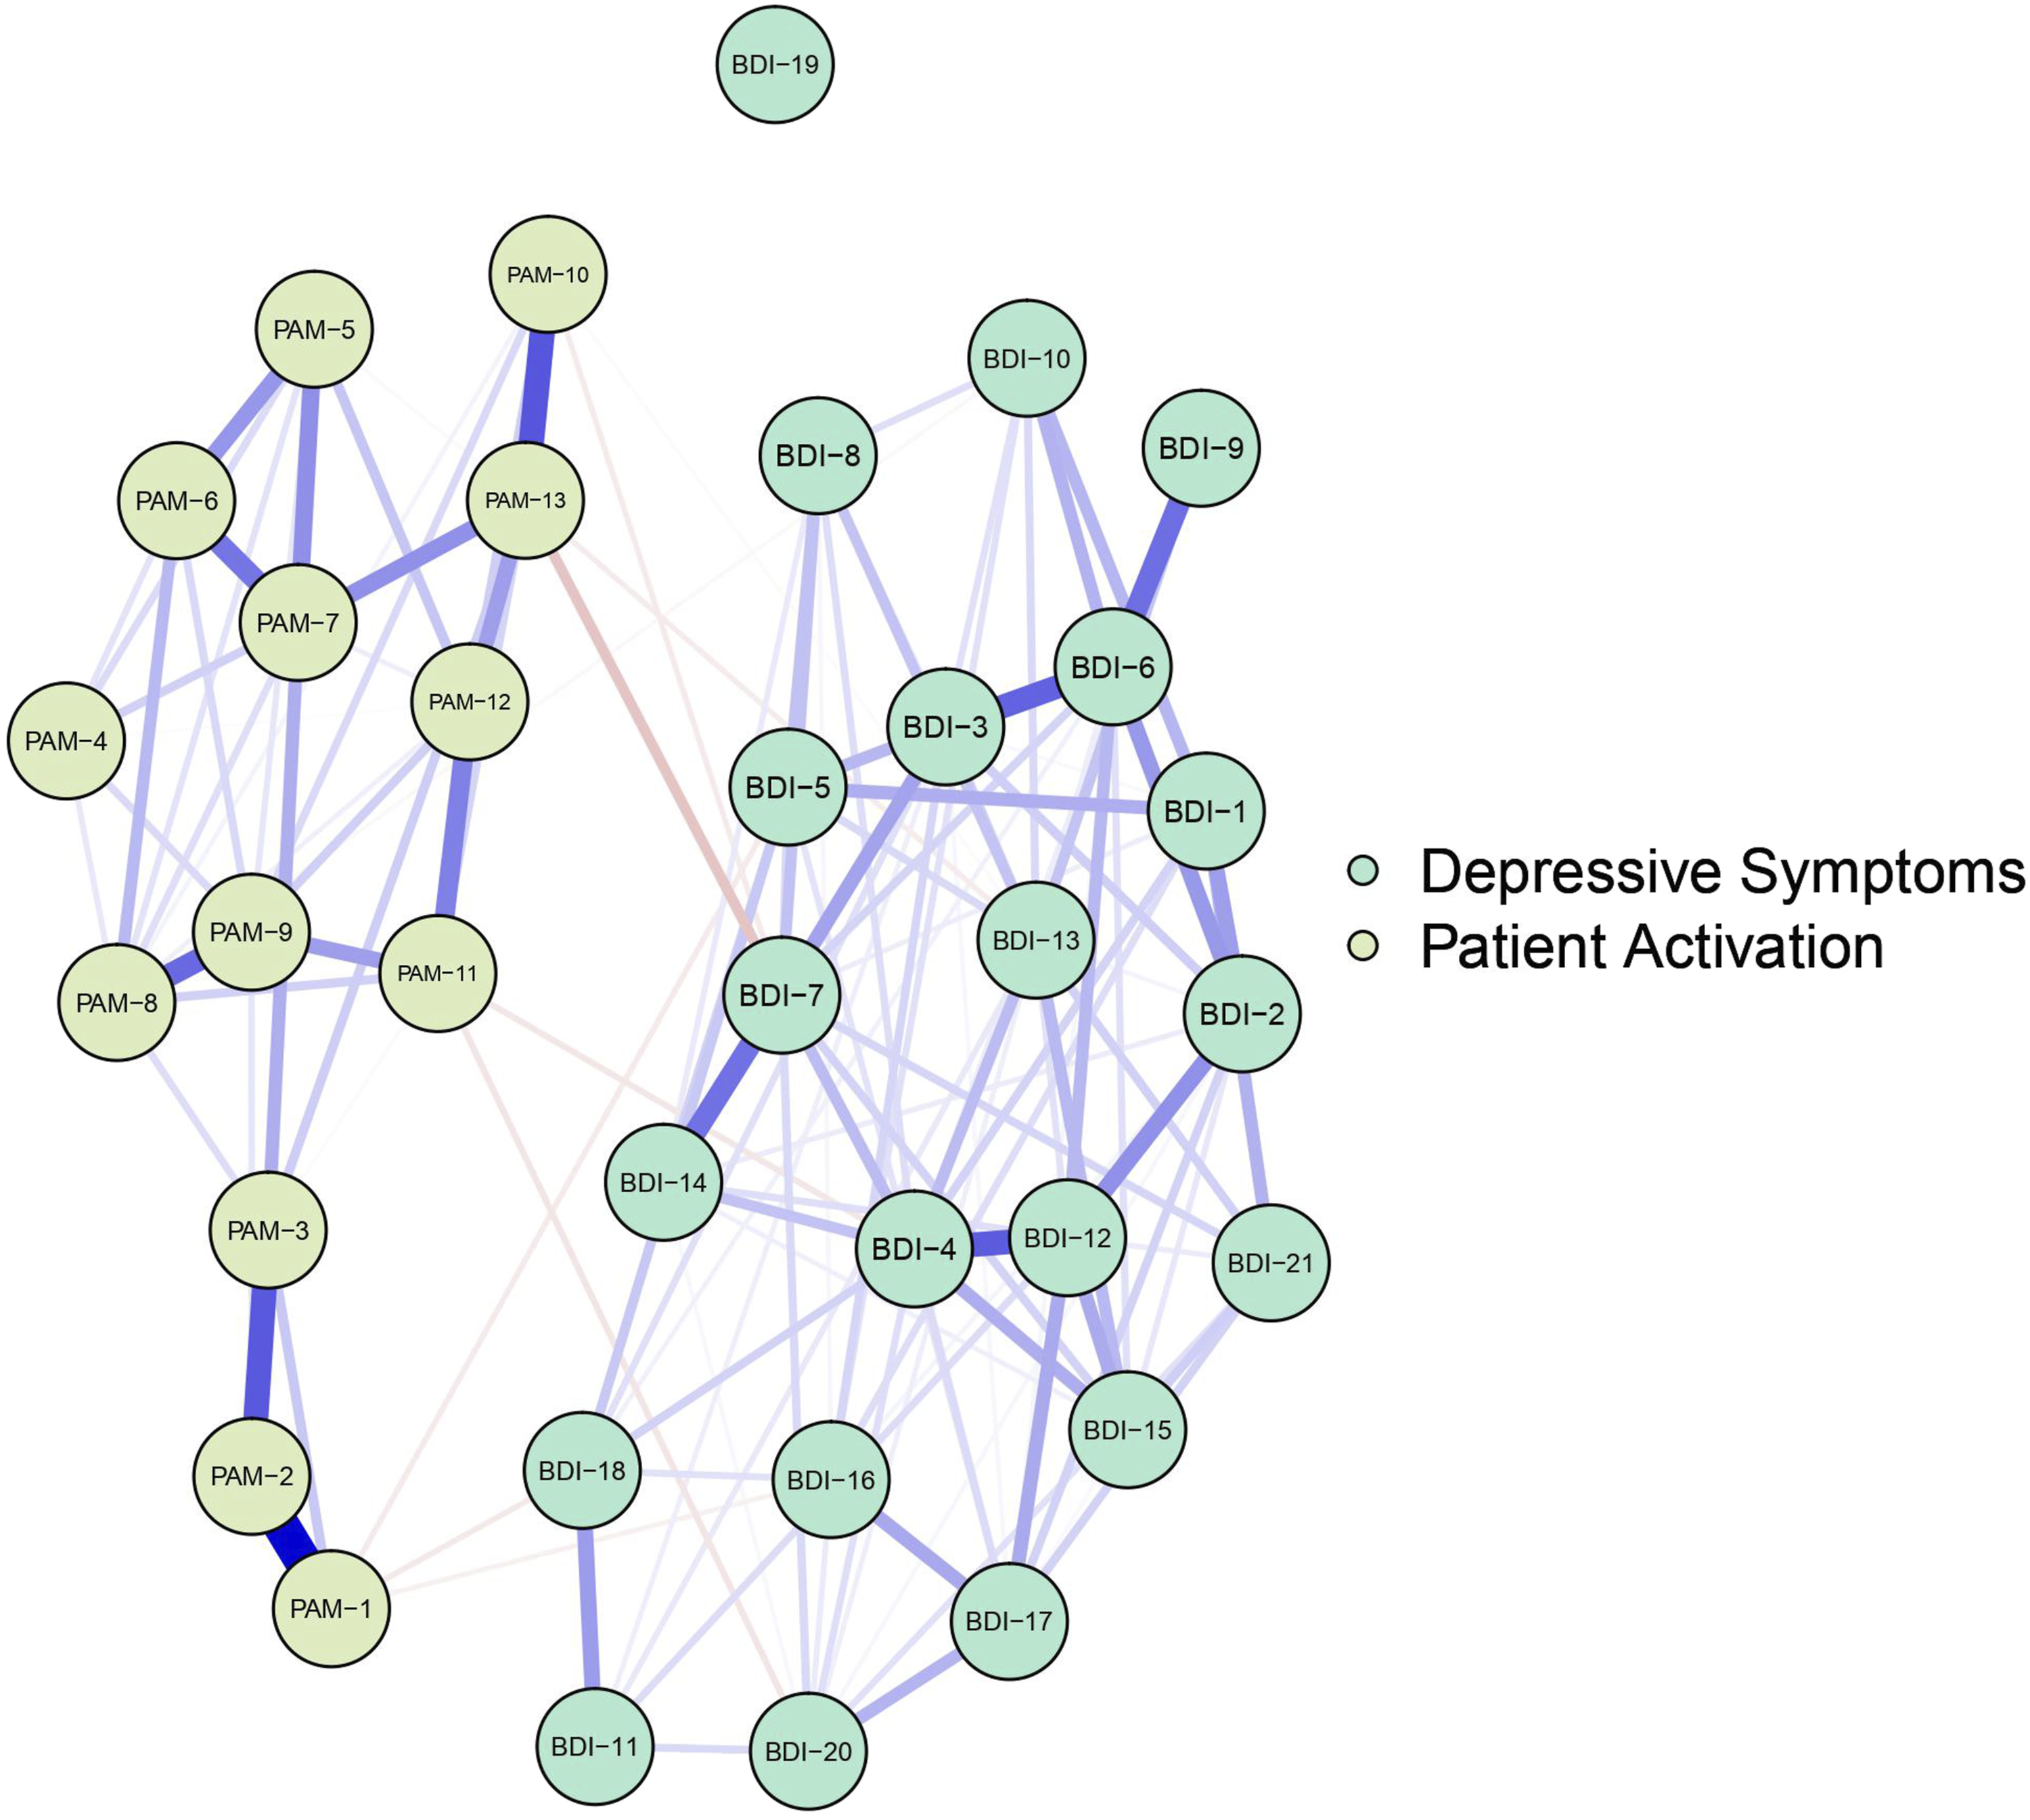
The CS-coefficient indicates that the betweenness [CS (cor = .7) = .15] and closeness [CS (cor = .7) = 0] centrality was not sufficiently stable in the network. Node strength [CS (cor = .7) = .24] and expected influence [CS (cor = .7) = .24] show better stability (see Supplemental material). Based on the stability analyses, only strength centrality and expected influence were interpreted. As can be seen in Figure 2, BDI-6, BDI-4, BDI-7, and BDI-12 were found to be the most central nodes in the depressive symptom–patient activation network. In particular, BDI-6 (strength = 1.90), BDI-4 (strength = 1.77), BDI-7 (strength = 1.71), and BDI-12 (strength = 1.52) had significantly greater strength than 63.6%, 63.6%, 63.6%, and 54.5% of the other nodes in the network, respectively. Further, BDI-6 (EI = 2.15), BDI-12 (EI = 1.75), and BDI-4 (EI = 1.67) had significantly higher expected influence than 66.7%, 69.7%, and 54.5% of the other nodes, respectively (see Supplemental material for bootstrapped significance test results). Centrality Indices for Each BDI and PAM Item in the LASSO-regularized Partial Correlation Network (N = 200)/Note: Plots depict the normalized (z-scored) values for ease of comparison. The farther right an index is positioned, the higher the node centrality, with the leftmost values representing the least central nodes (see Supplemental material for more detailed values).
Figure 3 includes estimates of one-step (EI1) and two-step (EI2) expected influence. From the BDI community, BDI-7 had the highest overall bridge-expected influence (EI1 = −.14, EI2 = −.26). From the PAM community, PAM-13 (EI1 = −.14, EI2 = −.30), PAM-1 (EI1= −.10, EI2 = −.16), and PAM-11 (knowledge on preventing health problems; EI1 = −.09, EI2 = −.18) were also highly influential for both one-step and two-step estimates. A person-dropping bootstrap procedure indicated that one-step expected influence estimates are fairly acceptable (bridge expected influence stability coefficient = .21; see Supplemental material). Estimates of One-step and Two-step Expected Influence (N = 200)/Note: Standardized one-step bridge-expected influence and two-step bridge-expected influence values are reported. The farther left an index is positioned, the higher the node centrality, with the rightmost values representing the least central nodes (see Supplemental material for more detailed values).
Discussion
This study included a sample of 200 patients with elevated risk of CVD and/or type 2 diabetes in a primary care setting and identified symptoms that bridge depressive symptoms and patient activation, and those that are central within the network.
“Self-dislike” (disappointed in self for being ill; BDI-7) and “confidence to maintain lifestyle changes during times of stress” (PAM-13) were identified as bridge pathways representing the negative links between depressive symptoms and patient activation. The partial correlation test also revealed that BDI-7 and PAM-13 were the strongest edges between these psychological and behavioral constructs. This finding supports the results from previous studies,28-30 which show that negative self-view (i.e., self-stigma) is strongly associated with activation levels for self-care behaviors in patients with type 2 diabetes. Our results are also consistent with those of the randomized trial by Ludman et al, 31 which demonstrated that among patients with comorbid depression and poorly controlled diabetes and/or coronary heart disease, early improvements in confidence to maintain lifestyle changes even during times of stress resulted in subsequent improvements in depressive symptoms.
In a theoretical network model, bridge symptoms are proposed as important treatment targets, given that interventions for bridge symptoms may disrupt powerful maintenance loops.16,32 While the current results do not indicate that interventions targeting the bridge symptoms identified here will most strongly disrupt the negative flow from depression to patient activation in practice, these symptoms may be important sites of intervention in novel treatment development. For instance, studies could evaluate whether reducing “self-stigma” may have downstream effects for improving patient activation levels in those at risk for CVD or type 2 diabetes. This discussion is important because patient interventions have predominantly focused on enhancing self-efficacy although only enhancing self-efficacy appears insufficient. 28 Patients likely require assistance in developing a positive attitude toward type 2 diabetes or other chronic conditions to minimize self-stigma and support self-management. Conceptually, this is supported by one of the first studies of health coaching in those with type 2 diabetes. 33 Compared to those randomized to a wait-list control, coaching participants increased their patient activation over the 6 months of coaching while also improving their ability to perceive positive contributions from having to live with diabetes (e.g., “Having type 2 diabetes has taught me to be patient,” or “. . . has led me to deal better with stress and problems,” or “. . . has helped me become more focused on priorities, with a deeper sense of purpose in life”) and mitigating negative appraisals of diabetes. 33 It may be that treatment targeted to shift self-stigma by enhancing appraisal of benefits associated with a health condition will positively impact patient activation. Further research is needed to explore the role that identifying and integrating positive aspects of living with a disease has in activating patients to better self-manage their health. Conversely, interventions for building confidence in maintaining active lifestyle changes during stressful encounters might be particularly crucial in patients with comorbid depression and chronic conditions, wherein lower motivation and confidence for self-care may be hallmarks of the illness. For example, Ludman 31 implemented a team-based intervention that combined self-management support and collaborative care management and reported improvements in depression symptoms.
Another element of self-stigma, “punishment feelings” (feeling that your illness is your fault; BDI-6), along with “self-dislike” (BDI-7), was identified as a core symptom strongly associated with other symptoms in the depressive symptom–patient activation network. Network theory suggests that interventions to improve core symptoms should have maximal effects in decreasing all symptoms within a psychological or behavioral network. 14 Based on our findings, we can infer that interventions tailored to undermine the elements of self-stigma may allow for better reduction in depressive symptom burden and improvements in patient activation among those with elevated CVD or type 2 diabetes risk.
“Loss of satisfaction” (“I am dissatisfied or bored with everything”; BDI-4) and “loss of interest in people” (BDI-12) were also identified as core symptoms in the depressive symptom–patient activation network. This finding supports previous studies,34,35 which argue that the affective symptoms of depression such as anhedonia can thwart even small behavioral changes needed to manage chronic medical illnesses. Interestingly, previous studies have shown that these affective symptoms of depression appear to be particularly cardiotoxic.36-38 Anhedonia-lowered mood and loss of energy are the most sensitive and frequent symptoms of depression in patients with cardiac illness and directly affect their participation in health behaviors, resilience, and self-care.39,40
The identification of “loss of satisfaction” as a core symptom in the depressive symptom–patient activation network has important clinical implications. First, it demonstrates the need to customize intervention strategies based on individual interests and priorities to elicit motivation. Second, it stresses the role of health coaching in the primary care setting as a patient-centered approach to increase patient participation in self-selected goals as well as self-management. 41 Health coaching is distinct from other strategies as the patient sets the agenda and is encouraged to choose goals aligned with his/her values. Wolever et al33,42 showed that among patients with type 2 diabetes, health coaching improved objective measures of medication adherence as well as self-reported adherence, exercise frequency, patient activation, perceived health status, stress levels, and HbA1c.
The identification of “loss of interest in people” as a core symptom in the depressive symptom–patient activation network merits closer attention. This facet of social anhedonia—potentially associated with the feeling that one does not belong to a group—may interfere with the ability to perform adequate self-management tasks and achieve better control. Accordingly, our result suggests that existing treatment and educational strategies in primary care practice should continue to include tailored components to keep patients engaged in their care. For instance, “personalized health feedback” can be adapted to a patient’s individual characteristics and needs to make the feedback more meaningful. 43 This adaptation, like good rapport with peers, families, and providers, 44 has been shown to lead to improved glycemic control and amelioration of depression in patients with diabetes. These findings are consistent with the emphasis of health coaching on establishing and fortifying support networks as a strategy toward strengthening patient coping and promoting adherence. 41
This study had several limitations. First, given our use of cross-sectional data and the fact that our adopted network analysis approach does not estimate the directionality in associations, we could not draw conclusions regarding the directionality of the influence of symptoms in the network. Second, our data were limited by the symptoms we chose to include and define in our network. The inclusion of additional symptoms may produce a different psychological or behavioral network. Third, our findings should be interpreted with caution as the network’s centrality, including the bridge centrality, was only sufficiently stable. One potential explanation for this result is that our sample size was too small to accurately model the depressive symptom–patient activation network, reducing the reliability of the centrality estimates. We recommend that future studies test the robustness of this result using a larger sample of patients at risk for CVD or type 2 diabetes. Lastly, network analysis as applied to psychological or behavioral medicine is a relatively new enterprise. Methods such as tests of reliability and establishment of fit indices are still in development. While network analyses may have the ability to lead to important insights in behavioral medicine and clinical psychology, it is necessary to consider other traditional methods such as latent variable analysis and multi-dimensional models of psychology and behavioral outcomes. 45
Despite these limitations, our findings are significant because they contribute to our understanding of the interplay between depressive symptoms and patient activation in elevated CVD risk populations and to the growing use of network analysis to understand psychological and behavioral variables. Specifically, while depression and patient activation are correlated, we provided more precise evidence to inform interventions to increase activation among depressed patients with chronic illnesses. At the same time, our analyses may help healthcare professionals identify specific interventional targets that can be personalized to disrupt the flow from one set of symptoms to another.
In conclusion, “self-dislike” and “confidence to maintain lifestyle changes during times of stress” emerged as important bridge pathways to explain the relationship between depressive symptoms and patient activation in elevated CVD risk populations in the current study. Moreover, “punishment feelings,” “loss of satisfaction,” “self-dislike,” and “loss of interest in people” anchored the center of the depressive symptom–patient activation network. We hope that future research will examine the clinical utility of targeting the bridge and core symptoms identified in this study for prospective and interventional study designs.
Supplemental Material
sj-pdf-1-gam-10.1177_2164957X221086257 – Supplemental Material for A Network Analysis of the Association Between Depressive Symptoms and Patient Activation Among Those With Elevated Cardiovascular Risk
Supplemental Material, sj-pdf-1-gam-10.1177_2164957X221086257 for A Network Analysis of the Association Between Depressive Symptoms and Patient Activation Among Those With Elevated Cardiovascular Risk by Chiyoung Lee, Ruth Q. Wolever, Qing Yang, Allison Vorderstrasse, Se Hee Min and Xiao Hu in Global Advances in Health and Medicine
Footnotes
Acknowledgments
We gratefully acknowledge the support of the individuals and institutions in helping to acquire the original grant and run the primary trial. Additionally, we appreciate the contributions of the participants who enrolled in the study.
Declaration of Conflicting Interests
The authors declared no potential conflicts of interest with respect to the research, authorship, and/or publication of this article.
Funding
The authors disclosed receipt of the following financial support for the research, authorship, and/or publication of this article: This secondary study comes from data collected in a trial sponsored by Air Force Medical Support Agency, Medical Research and Innovation Directorate AFMSA/SG5I under agreement number FA8650-12-2-6374.
Disclaimer
The views and conclusions contained herein are those of the authors and should not be interpreted as necessarily representing the official policies or endorsements, either expressed or implied, of Air Force Medical Support Agency, Medical Research and Innovation Directorate AFMSA/SG5I, or the US Government.
Supplemental Material
Supplemental material for this article is available online.
References
Supplementary Material
Please find the following supplemental material available below.
For Open Access articles published under a Creative Commons License, all supplemental material carries the same license as the article it is associated with.
For non-Open Access articles published, all supplemental material carries a non-exclusive license, and permission requests for re-use of supplemental material or any part of supplemental material shall be sent directly to the copyright owner as specified in the copyright notice associated with the article.