
Abstract
Bangladesh’s government had been constantly conscious of its health-care system. As a result, the health-care system had seen a significant rise in quality in the past few years. The Lean Six Sigma concept is used to boost up the productivity as well as the quality of products or services. The purpose of this article was to measure the process capability in the health-care system by lean tools. In this study, we selected the dialysis unit as our investigation area where we applied the Six Sigma DMAIC (Define, Measure, Analysis, Improve, and Control) model which had been structured step by step, respectively. Furthermore, different tools of Total Quality Management, Statistical Quality Control and Lean manufacturing like SIPOC (Supplier, Input, Process, Output, and Customer) diagram, P Control chart, Fishbone diagram, and Pareto analysis had been performed in different phases of the DMAIC model. Measuring process capability using the DMAIC model helped to identify the problems associated with the dialysis unit and also recommendations were developed based on investigation and analysis. These recommendations will help the hospital management to overcome all problems and increase service rate and patient safety in the dialysis unit.
Keywords
Introduction
Lean Six Sigma is a dominant philosophy that is applied for improving the quality, profitability, productivity, and also gain the market competitiveness among the competitors. 1 Motorola first implemented Six Sigma in the 1980s and Lean manufacturing was emerged at the end of 1990s. 2 It became a popular and prevalent method that it had been applied in all industrial and service sectors very soon. The Six Sigma ensures at a minimum of 3.4 defective products in the per million opportunities. It is similar to the Three Sigma model yet more up to date. Lean manufacturing ensures both of good quality and eliminating waste. 3 In the global competitive marketing environment, company strategies are to survive in the market eventually. Productivity is evaluated as one of the most important indicators of business performance. A product’s quality is determined by its error level in millions. For ensuring good quality, the whole system should work correctly from the design step that it can produce the perfect one at the first approach. Six Sigma helps to increase and maintain quality by reducing errors and variations. It deals with the quality of the product; on the other hand, Lean management resolves the speed of productivity. 4
The health-care system, which is also referred to as the health system, is the organization of people, institutions, and resources that deliver health-care services to meet the health needs of target populations. The health-care sector was changing according to modern science and technology. Bangladesh, as a developing country, was facing problems in its health-care system. To achieve global competitiveness and to develop a robust model for health-care services was crucial for both public and private sector hospitals in Bangladesh. It involved the appropriate measurement of the quality dimensions, the barriers analysis, and suitable recommendations for policy management to uplift the entire system.
For this, Lean Six Sigma was an effective way to find all the causes and errors. The rate of lean implementation in the health-care system of Bangladesh was too low to be considered. Moreover, Six Sigma was not practiced up to the mark in the other sectors as well. 1 Most of the Bangladeshi people liked to go to public hospitals for their treatment as it was free of cost or cost very low. Nevertheless, the public health sector was suffering from lots of complications and drawbacks. So, there were plenty of scopes for applying the DMAIC (Define, Measure, Analysis, Improve, and Control) model. For this reason, we selected a public hospital named Rangpur Medical College Hospital, Bangladesh for the experiment. We selected a particular ward (Dialysis Unit) to collect all data and find out the problems associated with Six Sigma implementation. However, this method could be applied to any other wards or the total hospital management system. The objectives of this study were to analyze the problems and measure the process capability and based on the analysis and measurement suggest some recommendations for making the process suitable for competitive servicing.
Literature Review
Lean Six Sigma is a philosophy of relentless and oppressive pursuit of eliminating nonvalue added activities and variations of a system or process to achieve breakthrough results in the service and quality of that organization. 5 Lean management helps Six Sigma by speeding the processes. The Lean Six Sigma process is established by the combination of 2 techniques together. The ultimate goal of the application is to make the process lean and increasing the level of sigma. 6 Six Sigma is more concerned about quality rather than speed. It is a philosophy that can lead to a continuous decrease in process variation. 7 Although Six Sigma has been already implemented in manufacturing fields, its philosophy and methodologies do have a significant effect in education, health care, and several sectors. 8 The DMAIC method in Six Sigma study is an approach for problem-solving. De Mast and Lokkerbol 9 critically compared the DMAIC method and the scientific theories for problem-solving.
There also have some practical studies on the Six Sigma DMAIC process and Lean Management. Lean Six Sigma approach offers a better health-care facility at the lowest possible time and costs. 10 Kwak and Anbari 11 had tried to minimize the waiting time which indicates the improvement of the quality of health care. In the future, Six Sigma and Lean Management will have a significant impact on the health-care system. The nature of the discharge process is complicated, and very few studies had been done in process capabilities or discharge processes in a particular health-care sector. At the community hospitals of Alliance, Ohio in the United States, Allen et al. 12 found that focusing on the physician preparation for writing discharge orders had the most impact. Vijay 13 suggested various improvement strategies to reduce the cycle time of the patients’ discharge process have given in multidisciplinary hospitals in India. One of them was applying the Six Sigma DMAIC model. The study identified 5 critical issues that were responsible for delays in discharging the patients.
In this study, Lean Six Sigma methodologies have been implemented through the DMAIC model. Lean tools have been suggested to minimize the defective rate and Six Sigma tools such as control chart, Pareto analysis, fishbone diagram, and so on to analyze and determine process capability and its errors.
Research Methodology
The methodological frameworks which had been used for the subsequent empirical analysis were presented here. The approach of DMAIC tools helps to analyze the root cause behind problems and to drive processes toward near perfection. 14 DMAIC, an acronym for Six Sigma methodology, is used to solve problems. The DMAIC model has 5 stages according to Define, Measure, Analysis, Improve, and Control. 15 The objective of the DMAIC model is to determine multiple perspectives of a single organization, many situations, different events, or various processes over a time period. 16
This study followed 6 steps:
Step 1: The research started with collecting the relevant data for the model. Data collection was very significant in the DMAIC approach. Biased data might impact the outcome severely. So, proper rules were strictly followed. We went through a detailed questionnaire and visited the site to find out the primary defects and rework to prevent them or reduce them. The data were collected in 2 ways. Firstly, field questionnaires were conducted from the operators or workers and then data were collected from the particular department. Furthermore, the authors’ direct observations in-depth knowledge were included.
Step 2: After data collection, the Define Phase would be conducted. In this phase, the main goal was to determine the need for running the research to an exact issue and also try to find out which type of causes could be available in the process. SIPOC (Supplier, Input, Process, Output, and Customer) and Process flow chart would also be performed in this section to observe the system in detail.
Step 3: Next comes the Measure Phase. Here, we would try to find out how the system was doing and where the problem was happening. In addition, we would apply a control chart to determine the process stability and provide a numerical point of view.
17


Step 4: In Analyze Phase, the aim was to connect the effects with causes and try to investigate why the problem was occurring. For this reason, the fishbone diagram was used here to observe the common reasons behind the effects. These common reasons were accountable for the maximum number of problem occurrences. Besides, a Pareto chart was performed to identify the main reason which was causing the maximum number of defects.
Step 5: In Improve Phase, we needed to have a systemic view of our solution. It combined the whole organization and process to develop a culture. 5S was applied here for a sustainable solution.
Step 6: The solution that we would find from the research should be sustainable. That was why regular monitoring and responses were necessary. Critical to Quality (CTQ) or statistical control chart would be useful tools to check the process capability and make it more sustainable.
Result Analysis
Define Phase
The define phase of the Six Sigma methodology narrates the scope and goals of the project or process improvement. 18 In this research, we created a data table of the dialysis unit of Rangpur Medical College Hospital, Rangpur, Bangladesh, which was shown in Table 1.
Number of Doctors, Nurses and Other Staff in the Dialysis Unit.
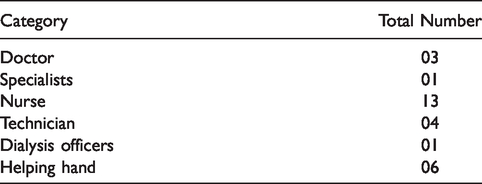
Table 1 reflected the workforce available in different categories and also showed that the number of human resources was limited than its demand.
Table 2 showed that different facilities or machines which were available, and Table 3 showed that how many patients were served in the dialysis unit in January 2019.
Number of Equipment in the Dialysis Unit.

Number of Patients Served in Dialysis Unit (January 2019).
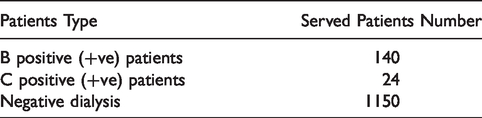
Rangpur Medical College Hospital had 25 beds in the dialysis ward. It could provide dialysis about 25 patients at a time and 24 hours with 3 shifts. The average service rate was 60 patients per day. There were 3 doctors and a specialist in the dialysis unit. Besides, there were 13 nurses and 11 working staff. This dialysis unit served 3 types of patients which were: negative virus, B positive (+ve) virus, and C positive (+ve) virus. The positive B virus and the positive C virus are also known as the hepatitis B and C virus. Hepatitis B and C are infectious diseases caused by the attack of these viruses. These viruses may cause serious damage to health, lead to liver cancer, liver failure or death. The dialysis took 4 hours to complete and it cost $ 4.72 per dialysis. After the dialysis, the machine needed 1 hour and 50 minutes to ready for the next dialysis. The important thing was, it took about 6 to 10 months to audit the machine which was lengthy. 19
The problems which were measured to this statement
Unavailablity of specialist doctors at the right time Unavailablity of nurses and staffs Errors in waste management The audit of a machine took a long time No management in attendance Some machinery remained unused Inadequate monitoring or follow-up treatment
The goal statements of the dialysis unit were
To ensure that the hospital could provide dialysis within 24 hours with the availability of required services. To improve the process capability of the dialysis unit. To provide a better environment and proper waste management which was necessary for treatment.
Now, it was needed to determine how the dialysis unit worked in a health-care system. For this reason, a tool named SIPOC (Supplier, Input, Process, Output, and Customer) was used in this phase which, demonstrated in Figure 1. As the SIPOC model was a visual tool for documenting a process from beginning to end, we could easily find out the system process in the dialysis unit.

SIPOC Diagram of Dialysis Unit.
For understanding the SIPOC diagram, the process flow chart was also introduced in the define phase (Figure 2). The flowchart diagram described the workflow, algorithm, or process of the system. All the steps of various kinds were connected with each other by the arrow signs. The workflow model displayed a solution to the existing problem.
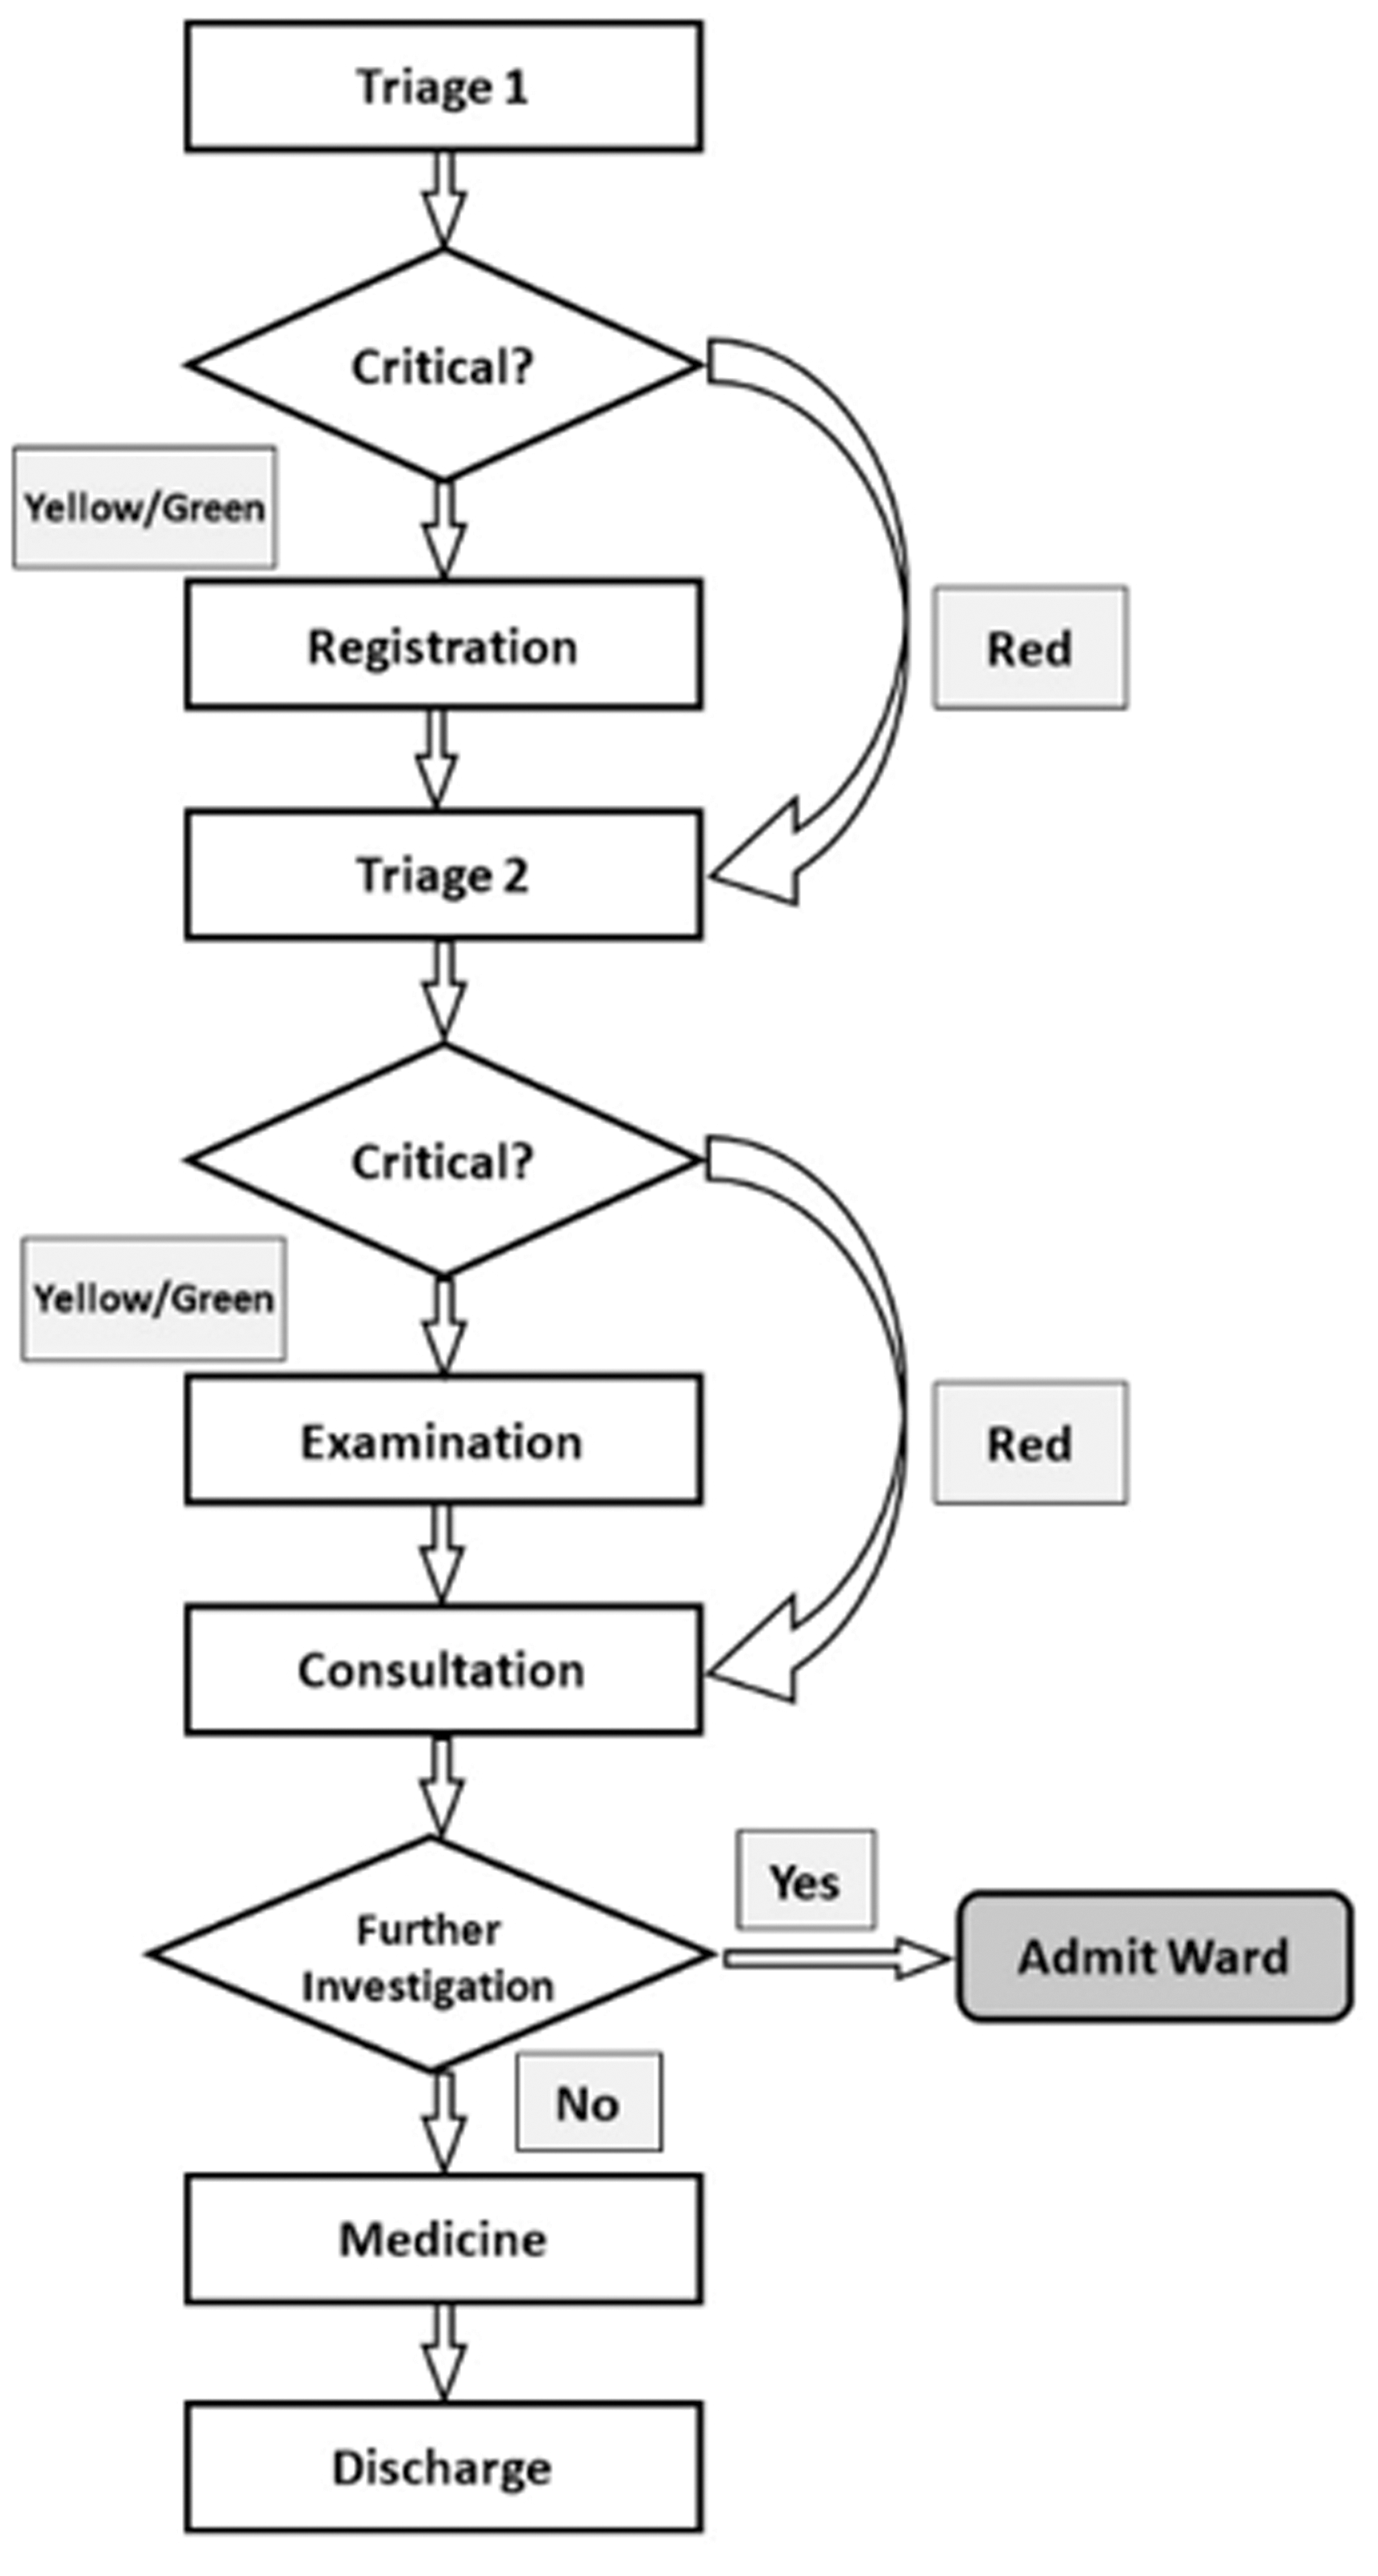
Process Flow Chart of Dialysis Unit.
Measure Phase
This phase deals with selecting appropriate product characteristics, mapping the process, determining the accuracy of the system, recording the data, and set up a baseline for determining the process capability of sigma rating for the process. 20 We used control chart in this phase. Control chart can be acted as a diagnostic of the possible out of control state of the process. The process which is in control situation is considered as a stable process and the process which is out of control situation is unstable. When a process goes out of control situation, the engineers and management who are associated with it try to find out the main problems, reasons, and solve it. In the dialysis unit, we applied a p chart to find out the process capability of that perspective unit. Our data attribute was conforming or nonconforming type. For this reason, the p chart was mostly auspicious. There are also some other types of attribute charts available like c chart, np chart, and u chart, but c chart follows the Poisson distribution, and in np chart, population’s fraction nonconforming data are needed to know. That was why we claimed that the p chart would the most suitable here.
Table 4 showed the number of nonconforming pieces of 30 days with sample size, n = 60 pieces. From the table, we saw that there were different numbers of negative dialysis varies day to day in January 2019.
Number of Nonconforming Pieces From 30 Days With Sample Size n = 60 Pieces.

Abbreviations: CL, control limit; LCL, lower control limit; UCL, upper control limit.
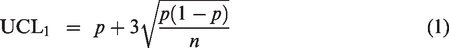
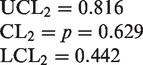
For constructing this p chart, we assumed p was the fraction nonconforming. Then, (1 − p) was fraction conforming. Mean fraction nonconforming for the data of Table 4 was 0.639. Since the population fraction of nonconforming was unknown, the p value could be applied to the calculation of the upper control limits (UCL) and lower control limits (LCL).


Figure 3 demonstrated that the process was in control, yet on the 24th day, the number of negative patients was higher than the other days, which caused the process unstable. After proper investigation, we found that 2 dialysis machines were shut down suddenly. So, the service rate fell severely. As it was not a usual scenario, it could be neglected. After neglecting the data, mean fraction nonconforming for the data of Table 4 was 0.629 and the modified control limit becomes

P (Fraction Nonconforming) Chart.
Then, the revised control limits were plotted in another p chart shown in Figure 4. It showed that all data were randomly distributed within the control limits. Moreover, 10th and 29th January had the nearest points to the upper control limits. Further investigation was needed to identify the root cause of these points.

P (Fraction Nonconforming) Chart After Neglecting 1 Point.
Analysis Phase
In this stage, brainstorming sessions were performed to identify the potential factors that could result in a delay in the service. 21 A fishbone or Cause–effect diagram displays the possible reasons or causes of a particular effect. Here, fishbone diagram and Pareto diagram both were used to find out the problems in the dialysis unit. The main problems were identified with their subproblems in the diagram. These problems were found by the “why” questions. The main problem in the dialysis unit was waiting for the dialysis bed. That was why the unit failed to provide treatment to the patients accurately. We tried to find the root of this problem.
Figure 5 showed that the leading causes of the delay in a hospital bed. These were Resources, Timing, Machine, Communication, Hospital Procedure, and Attendance. In this phase, the critical work or significant problems that were responsible for the effect was identified.

Root Cause Analysis for Waiting for a Hospital Bed in the Dialysis Unit.
Furthermore, we also drew a Pareto chart to identify the vital problem of the unit. The background reason was to emphasize the potential culprit which minimized the process capability. Table 5 showed the shortage of doctors, nurses, technicians, and machines.
Data of Required Doctors, Nurses, Officers, Specialists, and Helping Hand.
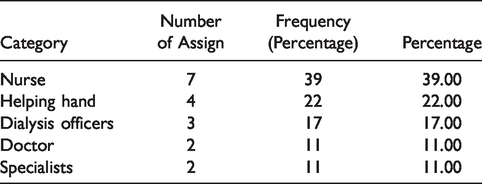
All the data were summarized in table and drawn in Figure 6. From the figure, we observed that Nurses and Helping hands were the vital few who contributed around 61% of total required items, and others 3 were the trivial many who were not in alarming stage.

Pareto Chart of Required Doctors, Nurses, Officers, Specialists and Helping Hand.
Improve Phase
The goal of this phase is to improve the system. In this phase, specific ideas or suggestions had been made to understand the relationship between the CTQs (Critical to Quality). In the analysis phase, it was noticed after employing the Pareto analysis and Cause–effect diagram techniques, the shortage of nurses and helping hands were the main problem for shifting the process mean value from the desired value and the value of the broader zone. Moreover, there were some problems with its waste management and distribution of necessary commodities. For this purpose, 5S philosophy would be a useful tool. 5S is a philosophy of organizing workspaces for performing the work efficiently, effectively, and safely. 5S focuses on putting everything where it belongs and keeping the workplace neat and clean. It makes it easier for workers to do their job without wasting time or risking their lives. 5S is a methodical way to organize your workplace and your working practices and way of working. Each term starts with an S. In Japanese, the 5 S’s are Seiri, Seiton, Seiso, Seiketsu, and Shitsuke. In English, the 5 S’s are translated as Sort, Set in Order, Shine, Standardize, and Sustain. 22
After implementing 5S in the dialysis unit, there was some change in the waste management and distribution of required commodities. Those 5 terms of 5S rebooted the working place concerning their characteristics. The 5S operation model brought many benefits. Some of those were economical and improvement of human capital resources. The results of strategic 5S implementation were seen in doctors, patients, staff, environment, and quality. Moreover, the patient’s treatment were appropriately given to allocating more workforce in the unit. Also, it improved the treatment quality of the dialysis unit.
Control Phase
In the Control phase of Six Sigma’s DMAIC methodology, the project should be documented, monitored regularly, and any countermeasure should be taken to maintain the process for sustainability. A key objective is to complete the proposed work and evaluate the improved process with the old process, with procedures for maintaining the gains. The goals here were to ensure that the processes continue to work well, produce the desired output results, and maintain quality levels and documentation of all records. For this purpose, continuous training schedule for the working stuffs needed to set up and also documents (ie, procedure, work inspection) needed to update at new standards. The environment of the hospital and the behavior of the doctors and nurses also needed to be on the patient’s side. Besides, patients should co-operate with the hospital management system. Also, data records were needed to be stored in a database daily. Improved maintenance schedules and downtime tracking logs should be introduced to reduce the loss of time for repairing the machines. Basically, in the control phase, the primary purpose was to control the activity as if would have been done according to preplanned.
Recommendations and Future Works
The ultimate objective of this research study was to find out the process capability by using Six Sigma philosophy through the DMAIC model approach. Many tools were applied such as the Pareto chart, Cause–effect diagram, and SIPOC diagram to identify the problems which were the barriers of improving the service quality. Furthermore, many other techniques like Multi-Criteria Decision-Making analysis, fuzzy sets, and Gray relations analysis can be applied in future work. Also, the data were used in this article for 1 month only. If the data were taken for a more extended time, the result would be more precise. Also, the study was limited within the dialysis unit. In future, researchers may apply this technique widely in different sectors. The limitation of this study was it did not consider hypothesis and analysis of variance test. These limitations might be overcomed in future. This article described and found the causes associated with the poor quality of service of that particular unit. If there any relation between these causes to each other or dependency were available, then regression analysis should be performed to understand the relationship. In Bangladesh, Lean Six Sigma was a novel philosophy for the service sectors. So, this philosophy should be more practiced and proper guidelines should be made for the future.
Conclusion
From all the observations, analyses, and discussion discussed earlier, we concluded that the health-care system of Bangladesh was very delicate. We only experimented in a particular ward of a hospital, yet we found the scarcity of doctors, nurses, machines, and other resources. Patients had to suffer when they came to do their dialysis and the system could not sustain in a high-pressure situation. The study replicated the actual scenario of the health-care system of a developing country like Bangladesh.
In this study, a few problems in the existing process were identified from different kinds of data from various sources. The SIPOC model and the DMAIC method were applied to measure the process capability. It will be helpful to the management to understand their process capability for future uncertainties and challenges. Most of the hospital’s management was not concerned with their actual capability because of the lack of knowledge of data analysis. In this article, a brief presentation of these kinds of problems and their precise solution was demonstrated. Furthermore, the non-value-added activities were needed to be identified to apply 5S philosophy or elimination of other types of defects. Finally, it can be stated that the proposed DMAIC methodology was proven to be applicable in the health-care sector according to the given recommendation. It will provide high efficiency and quality of service to the health-care sectors in making sound decisions.
Footnotes
Declaration of Conflicting Interests
The author(s) declared no potential conflicts of interest with respect to the research, authorship, and/or publication of this article.
Funding
The author(s) received no financial support for the research, authorship, and/or publication of this article.