
Abstract
This study explores how test-takers process multiple-choice questions in a reading comprehension test using eye-tracking data. A total of 159 participants completed a 10-item English test, while their eye movements were recorded with the Smart Eye Aurora eye tracker. The study first examined item processing patterns using latent profile analysis and then compared test performance across these groups. To identify processing patterns, latent profile models (ranging from one to four classes) were tested for each item based on average log process times across defined Areas of Interest (AOIs) for text lines and answer choices. Results showed that a two-class model (fast- and slow-pacing) provided the best fit for five items, while a three-class model (fast-, moderate-, and slow-pacing) best fit the remaining items. Items with two subgroups were typically moderately difficult (short) or easy (long), while items with three subgroups varied in difficulty and length. Additionally, test-takers in fast-pacing group were more likely to answer items correctly and achieved higher total scores than those in other groups, particularly for highly discriminating and moderately difficult or easy items. Overall, these findings highlight the importance of examining item processing patterns to better understand how individuals interact with multiple-choice test items. Item characteristics—such as difficulty, discrimination, and length—play a crucial role in shaping processing behaviors, providing deeper insights into the cognitive aspects of eye movement patterns during test-taking.
Plain Language Summary
This study examined how test-takers process multiple-choice items in a reading comprehension test by using eye-tracking technology. A total of 159 students completed a 10-item English test while their eye movements were recorded. The goal was to identify distinct processing patterns and investigate how these patterns relate to test performance. Results showed that test-takers could be grouped into fast-, moderate-, and slow-pacing profiles depending on how they allocated their time across each item. Fast-pacing test-takers were generally more successful, particularly on items that were easier or moderately difficult and highly discriminating. In contrast, slow-pacing test-takers tended to perform less well. These findings highlight the importance of examining response processes to better understand how individuals interact with test items and how item characteristics shape their processing. They offer valuable insights for improving test design and instructional strategies.
Introduction
Eye-tracking technology, which records where and in what order an individual gazes while interacting with stimuli (Carter & Luke, 2020; Holmqvist et al., 2011), has become an increasingly valuable tool for understanding cognitive aspects of response processing that are not directly observable (Just & Carpenter, 2018; Rayner, 1995). This technology is particularly useful in educational research, offering insights into how students process information within a given timeframe—for example, while engaging with educational material or performing a task (e.g., Hyönä, 2010; McCray & Brunfaut, 2018). Researchers use it not only to refine instructional and assessment strategies but also to gain deeper insights into cognitive processes, ultimately enhancing both learning and evaluation methods (Jarodzka et al., 2017; Was et al., 2016). Eye-tracking, by providing response process data, helps researchers explore how test-takers navigate through the test and what kind of strategies they employ while completing the test items. It also offers insights into the knowledge and competencies test-takers draw upon, whether they truly engage with items instead of guessing, and how they utilize the resources and information provided in the test (Ercikan & Pellegrino, 2017). This detailed understanding of test-taker behavior enhances the interpretation and use of test scores, ultimately improving assessment validity and fairness.
Eye-Tracking in Educational Assessment
In recent years, there has been growing interest in using eye-tracking technology to obtain response process data in educational assessment settings. One of the key advantages of eye-tracking is its ability to capture response processes that are not accessible through traditional data sources. For instance, Maddox et al. (2018) used eye-tracking in the OECD Programme for the International Assessment of Adult Competencies (PIAAC) and demonstrated how it can provide detailed insights into response processes, offering an explanatory depth beyond think-aloud protocols or log files.
Recent studies have used eye-tracking to explore test-takers’ cognitive strategies by analyzing how they process assessment items. Y. Hu et al. (2017) analyzed students’ eye movements while solving complex problems in the Programme for International Student Assessment (PISA) to understand problem-solving strategies used by low- and high-performing students. Similarly, Krstić et al. (2018) examined eye movement patterns in PISA reading tasks and identified notable differences between students with high and low scores. Bax (2013) investigated the cognitive processing of test-takers completing the International English Language Testing System (IELTS) reading tasks. His study examined how successful and unsuccessful candidates approached reading items, revealing that successful test-takers demonstrated more expeditious reading behaviors, focusing efficiently on relevant portions of the text, while less successful ones spent a longer time on larger chunks of text and exhibited inefficient search patterns. Also, Langenfeld et al. (2020) explored test-takers’ problem-solving strategies and cognitive load in a Graphic Literacy Assessment with multiple-choice items, showing that high performers used different strategies and engaged with graphics in distinct ways compared to low performers. These studies have provided results highlighting that efficient test-taking strategies might be a key differentiator between high- and low-performing test-takers across different test formats.
Another line of research has focused on how item characteristics, such as format and difficulty, influence response patterns. Bax and Chan (2019) examined the potential impact of item types (e.g., heading matching and multiple-choice) on students' reading behaviors, revealing that it significantly affects test-taking strategies. Similarly, Yaneva et al. (2021) examined how multiple-choice answer options influence medical students’ response processing in questions assessing clinical reasoning. Their findings showed that students first examined the item stem before reviewing the answer choices, spending more time and fixating more frequently on the stem than on the options. Together, these studies highlight the value of eye-tracking in understanding response processes in assessments. They emphasize the role of cognitive strategies and item characteristics in shaping test performance, contributing to a deeper understanding of how individuals engage with test items and how assessments can be improved.
Research to date suggests that eye-tracking technology is particularly useful for identifying and describing eye movement patterns unique to test-takers responding to multiple-choice items, helping with the associated quality control and validity studies (Langenfeld et al., 2020; Zumbo & Hubley, 2017). By examining response processes through eye movements, researchers can assess whether test items engage test-takers as intended and whether the inferences drawn from test scores are justified (Ercikan & Pellegrino, 2017). Research specifically focused on distinct multiple-choice item processing patterns and their associations with test-takers’ scores would provide nuanced insights into score meaning and interpretation. Additionally, such research could enhance our understanding of the capabilities of the items that might be irrelevant to the construct, hence might be differentially affecting test-takers’ performances (e.g., American Educational Research Association et al., 2014; Kane & Mislevy, 2017).
The Present Study
Previous research using eye-tracking to investigate response processes has often focused on different tasks or tests, comparing high- and low-performing test-takers in terms of their processing patterns. These studies have provided valuable insights into the association between response processes and performance. However, relatively few studies have examined how item characteristics influence response process patterns, leaving open questions about how specific item features shape test-takers’ approaches.
The present study investigates test-takers' item processing patterns in a ten-item multiple-choice reading comprehension test using eye-tracking data. Specifically, it examines eye fixation patterns and their relationship with item and total test scores, while also evaluating item characteristics that may be associated with distinct response processes.
First, we applied Latent Profile Analysis (LPA) for each test item using segment-specific process times derived from time-stamped eye fixation metrics for defined Areas of Interest (AOIs). Each item included up to ten AOIs—five corresponding to the text lines preceding the choices and five representing the answer choices (A to E). Average process times were computed for each AOI, and potential subgroups of test-takers were identified for each item based on their processing patterns. Next, we tested models to examine the predictive effect of subgroups on item and total test scores, assessing whether processing patterns were associated with performance differences. Finally, we evaluated the items collectively to identify common characteristics among those with similar subgroup structures and significant subgroup performance differences.
The study addresses the following research questions:
Which distinct subgroups of test-takers can be identified based on eye fixation patterns for each item?
How do these subgroups differ in their item scores?
How do these subgroups differ in their total test scores?
What are the common characteristics of items with similar subgroup structures?
What are the common characteristics of items where subgroup differences in item and total test scores are observed?
This study extends prior research by modeling response processing heterogeneity and linking subgroup membership not only to item- and test-level performance outcomes but also to item features. Using LPA on fine-grained eye-tracking data, it reveals processing patterns that remain hidden in aggregate analyses, thereby offering a more nuanced account of test-taking behavior and contributing to the literature on response processes in educational assessment.
Methodology
Participants
A total of 159 participants were recruited from Gazi University through voluntary sign-up. The participants were enrolled in a variety of teacher-education programs, such as mathematics, Turkish, art, English, and biology, and were distributed across all four academic years (first through fourth). All participants were English as a Foreign Language (EFL) learners residing in Türkiye. They had normal or corrected-to-normal vision. The study was approved by the Gazi University Ethics Committee (No: 80287700-302.08.01-156936). Informed consent was obtained from all participants before the study.
Experimental Procedures
Eye-tracking data were collected using the Smart Eye Aurora screen-based eye tracker, which performed binocular tracking at a sampling frequency of 250 Hz. The study was conducted on an MSI computer (Intel Core i9-11900K @ 3.50 GHz, 64.0 GB RAM), with test items displayed on a 21.5-inch flat-panel monitor with a 1,920 × 1,080 resolution.
The experimental sessions took place in a research laboratory. At the start of each session, participants were informed about the procedure, followed by a five-point calibration to ensure the quality of the eye movement recordings. Each test-taker completed the test individually, responding to one item at a time in the same fixed order. The test screen layout positioned the item stem on the left side and the answer choices on the right. There was no time limit for the test; each session concluded when the participant submitted their responses.
Materials
Figure 1 shows the multiple-choice test items used in the study. These items were drawn from the publicly released item pool of a nationwide English as a foreign language exam administered by a governmental testing agency (The Measurement, Selection and Placement Center, 2018). Items were selected to represent a range of skills such as grammar, vocabulary, translation, and reading comprehension. For each item, up to ten Areas of Interest (AOIs) were defined: Instruction, Line-1, Line-2, Line-3, Line-4, and Choices A, B, C, D, and E. As illustrated in Figure 1, the AOIs for the answer choices (A–E) remained consistent across items, whereas the AOIs in the stem varied due to item-specific features, such as differences in the number of lines or words per line.

Items in the test and defined AOIs.
We first calculated the psychometric properties of the test items using Classical Test Theory (Crocker & Algina, 2006). Table 1 provides item discrimination and difficulty indices along with item format and word count within AOIs. Item discrimination (a) is represented by the corrected item-total correlation coefficient, where higher values indicate that an item differentiates more effectively between high- and low-performing test-takers. Item difficulty (b) is represented by the proportion of correct responses, where higher values indicate that an item is easier, meaning that more test-takers responded correctly.
Characteristics of the Items in the Test.

Note. a = Item discrimination, b = Item difficulty, Ins = Instruction, L-1. … L-4 = first line, …, fourth line, A, B, C, D, E = Choice A, B, C, D, E. Items were presented in descending discrimination order for convenience, but were given randomly during test experiment. Item discrimination = corrected item-total correlation. Item difficulty = proportion of correct responses. Cronbach α internal consistency coefficient = .85 for the test.
Data Extraction and Analysis
The dataset included item response data (i.e., incorrect or correct [0/1]), total test scores (ranging from 0 to 10), and a series of up to ten AOI process times derived from time-stamped fixations, binary-coded per AOI over item encounter times. After exporting the data based on the AOIs, we screened it for corrupt, irrelevant, or inaccurate recordings and excluded any problematic data from the dataset. For the analyses, mean log AOI process times per item were calculated using time-stamped fixation data. This was done by averaging the time a test-taker spent reading an AOI from the moment they started reading an item until they provided a response (Çorbacı & Kahraman, 2022). The dataset also included total fixation durations, representing the sum of all time spent fixating on an item, that is, item response times.
Data analysis was conducted in two stages:
Preliminary Analysis: Descriptive statistics of total fixation duration were calculated. We then examined whether fixation durations differed between response groups using t-tests. Additionally, mean AOI process times within items were computed and compared across response groups to assess differences in AOI process times.
Latent Profile Analysis (LPA): We tested three latent profile analysis models (Figure 2), where AOI process times served as the manifest/observed variables of the latent variable. LPA, a variation of Latent Class Analysis for continuous variables, identifies hidden subgroups in the data by estimating the probability that individuals belong to different latent profiles (Ferguson et al., 2020). This method uses individuals' responses to a set of indicators to classify them into subgroups with similar response patterns (for more information, see Nylund-Gibson & Choi, 2018).
Profiles are represented by two sets of parameter estimations: latent class parameters and class-conditional parameters (for more information, see Hickendorff et al., 2018). Latent class parameters estimate the proportion of individuals in each class (class prevalence), while class-conditional parameters define the measurement model by describing the relationship between the latent variable and its indicators. Since LPA uses continuous indicators, it estimates profile-specific parameters (e.g., means and variances), that characterize each subgroup.

Graphical representation of the LPA models tested.
In Model-a (the unconditional model), we tested a series of Latent Profile Analysis (LPA) models, ranging from one-profile to four-profile solutions per item, to identify distinct item processing patterns present in the data (Research Question 1). The unconditional model was used to determine the optimal number of profiles that best fit the data. To evaluate model fit, we used the Akaike Information Criterion (AIC) (Akaike, 1987), Bayesian Information Criterion (BIC) (Schwarz, 1978), Vuong-Lo-Mendell-Rubin Likelihood Ratio Test (VLMR-LRT) (Lo, Mendell & Rubin, 2001; Vuong, 1989), and Bootstrap Likelihood Ratio Test (BLRT) (McLachlan & Peel, 2000). A model with lower AIC and BIC values indicates a better fit. VLMR-LRT and BLRT compare the K-class model to the K-1 class model and provide a p-value to assess whether adding a class results in a statistically significant improvement in model fit (Nylund-Gibson & Choi, 2018). To assess classification precision, we examined the entropy value, which ranges from 0 to 1, where higher values (>0.80) indicate better classification accuracy (Clark, 2010).
In Model-b, we incorporated item scores as a distal outcome (i.e., a consequence of latent class membership) into the LPA model to determine whether item scores differed across test-takers in the identified profiles of item processing patterns (Research Question 2). To include the distal outcome, we used the three-step approach (Vermunt, 2010), which consists of the following steps: (1) estimating the latent class model using only the latent class indicator variables (i.e., the unconditional model), (2) creating the most likely class variable based on the latent class posterior distribution obtained in the first step, and (3) regressing the most likely class on the predictor variables while accounting for misclassification from the second step (Asparouhov & Muthén, 2014). For distal outcomes, class-specific means and variances are estimated for each distal outcome to examine differences across profiles, followed by pairwise comparisons to determine whether the differences were statistically significant (Nylund-Gibson & Choi, 2018). This approach ensures that the measurement of the latent class variable remains unaffected by the inclusion of covariates or distal outcomes, as the measurement parameters are fixed at the values estimated in the unconditional model (Nylund-Gibson et al., 2014). For effect size, we calculated Cohen’s d for each pairwise comparison and interpreted following Cohen’s (1988) guidelines: small (d = 0.20), medium (d = 0.50), and large (d = 0.80).
In Model-c, we incorporated total test scores as a distal outcome to examine whether test scores varied across the identified profiles (Research Question 3). Using the same three-step approach as in Model-b, we specified distal variables with unequal means and equal variances to account for potential differences across profiles. All analyses were conducted using Mplus (Muthén & Muthén, 1998–2017; for details on the three-step approach, see Asparouhov & Muthén, 2014; for illustrative applications of this approach, see Nylund-Gibson & Choi, 2018 and Nylund-Gibson et al., 2014).
Finally, we synthesized our findings and presented a comprehensive summary to determine whether there were any common characteristics among items with similar subgroup structures (i.e., profiles) and significant subgroup differences in item and total test scores (Research Questions 4 and 5, respectively).
Results
Preliminary Analysis: Descriptive statistics
Table 2 presents the descriptive statistics for total fixation duration per item, along with t-test results. The results indicated that test-takers who answered incorrectly had significantly longer fixation durations than those who answered correctly for items 1, 2, 3, 4, and 6. These results indicate that incorrect responses were often associated with longer processing times, potentially reflecting inefficient strategy use. A similar pattern was observed for the remaining items, except for item 9, but the mean differences were not statistically significant.
Descriptive Statistics of Total Fixation Duration Across Item Response Groups.

Note. df = degrees of freedom.
<.05.
Figure 3 presents the mean process time per AOI for each response group. The results indicated that, for most AOIs and items, test-takers who answered incorrectly had longer mean process times than those who answered correctly. The t-test results comparing AOI process times across response groups are not included here for simplicity, but followed a similar pattern to the total fixation duration comparisons reported in Table 2. For items 1, 2, 3, 4, and 6, significant differences were observed in process times across response groups for most AOIs. For the remaining items, differences in process times were either limited to a few AOIs or not statistically significant.

Mean AOI process time in terms of response groups.
Latent Profile Analysis: Results of The Unconditional Model (Model-a)
In Model-a, we tested a series of LPA models, ranging from a one-profile to a four-profile model, to address the first research question: identifying the presence of subgroups of item processing patterns. Table 3 presents the model fit indices.
Fit Indices of LPA Models (Model-a).

Note. AIC = Akaike’s Information Criterion; BIC = Bayesian Information Criterion; 2 LL Difference = 2 Times the Loglikelihood Difference; VLMR = Vung-Lo-Mendell-Rubin Likelihood Ratio Test; BLRT = Bootstrap Likelihood Ratio Test. The chosen models were written in bold.
The results showed that a two-profile model provided the best fit for items 1, 5, 6, 7, and 8, based on lower AIC and BIC values, significant VLMR-LRT and BLRT tests, high entropy, and interpretability of the identified profiles. While selecting the model, we also considered the smallest profile size (to avoid groups smaller than 5%) and ensured adequate separation between profiles to reflect meaningful differences in processing patterns. Based on these criteria, two distinct item processing patterns emerged among test-takers for these items. In contrast, a three-profile model provided the best fit for items 2, 3, 4, 9, and 10, indicating three item processing patterns for these items.
After determining the best-fitting model for each item, we interpreted the proportions of test-takers in each subgroup (latent class parameters) and their mean AOI process times (class-conditional parameters). These estimations are presented in Figure 4.

Mean AOI process time estimations conditioned on profiles.
The results showed that in the first item, Profile-1, which included test-takers with lower mean AOI process times, was labeled as fast-pacing, while Profile-2, consisting of test-takers with higher mean process times, was labeled as slow-pacing. For the second item, three distinct profiles emerged. Profile-1 (fast-pacing) included test-takers with lower mean process times, Profile-2 (moderate-pacing) consisted of test-takers with moderate mean process times, and Profile-3 (slow-pacing) comprised test-takers with higher mean process times. Additionally, test-takers in the slow-pacing group spent more time on the answer choices than those in the fast- or moderate-pacing groups. Using this labeling approach, we categorized profiles based on mean process time, assigning fast-pacing to groups with lower process times, moderate-pacing to those with moderate times, and slow-pacing to those with higher times.
Figure 4 also presents the proportion of test-takers in each profile. For example, in the first item, 58% of test-takers belonged to the fast-pacing group, while 42% belonged to the slow-pacing group. Across all items, profiles contained a substantial number of test-takers, with the smallest group representing 10% of the sample.
Results of the Model with Item Score as a Distal Outcome (Model-b)
In Model-b, item scores were incorporated as a distal outcome to address the second research question, which examines differences in item scores across item processing groups. Table 4 presents the paired comparisons of item scores.
Equality Tests of Mean Item Scores Across Profiles (Model-b).

Note. n = number of test-takers assigned to the profiles; d = Cohen’s d effect size.
p < .05.
The results indicated that test-takers in the fast-pacing group had significantly higher mean item scores (i.e., correct response rates) than those in the slow-pacing group for items 1, 2, 3, 4, 6, and 8 (p < .05). These findings suggest that test-takers in the fast-pacing group were more likely to respond correctly compared to those in the slow-pacing group. Additionally, test-takers in the fast-pacing group had significantly higher mean item scores than those in the moderate-pacing group for items 2, 3, and 4, indicating that fast-pacing test-takers were more likely to respond correctly than moderate-pacing ones. However, no significant differences were observed in mean item scores between the moderate- and slow-pacing groups (p > .05). Effect sizes for the item score differences ranged from small to large, indicating varying magnitudes of practical significance across comparisons.
Results of the Model with Total Test Score as a Distal Outcome (Model-c)
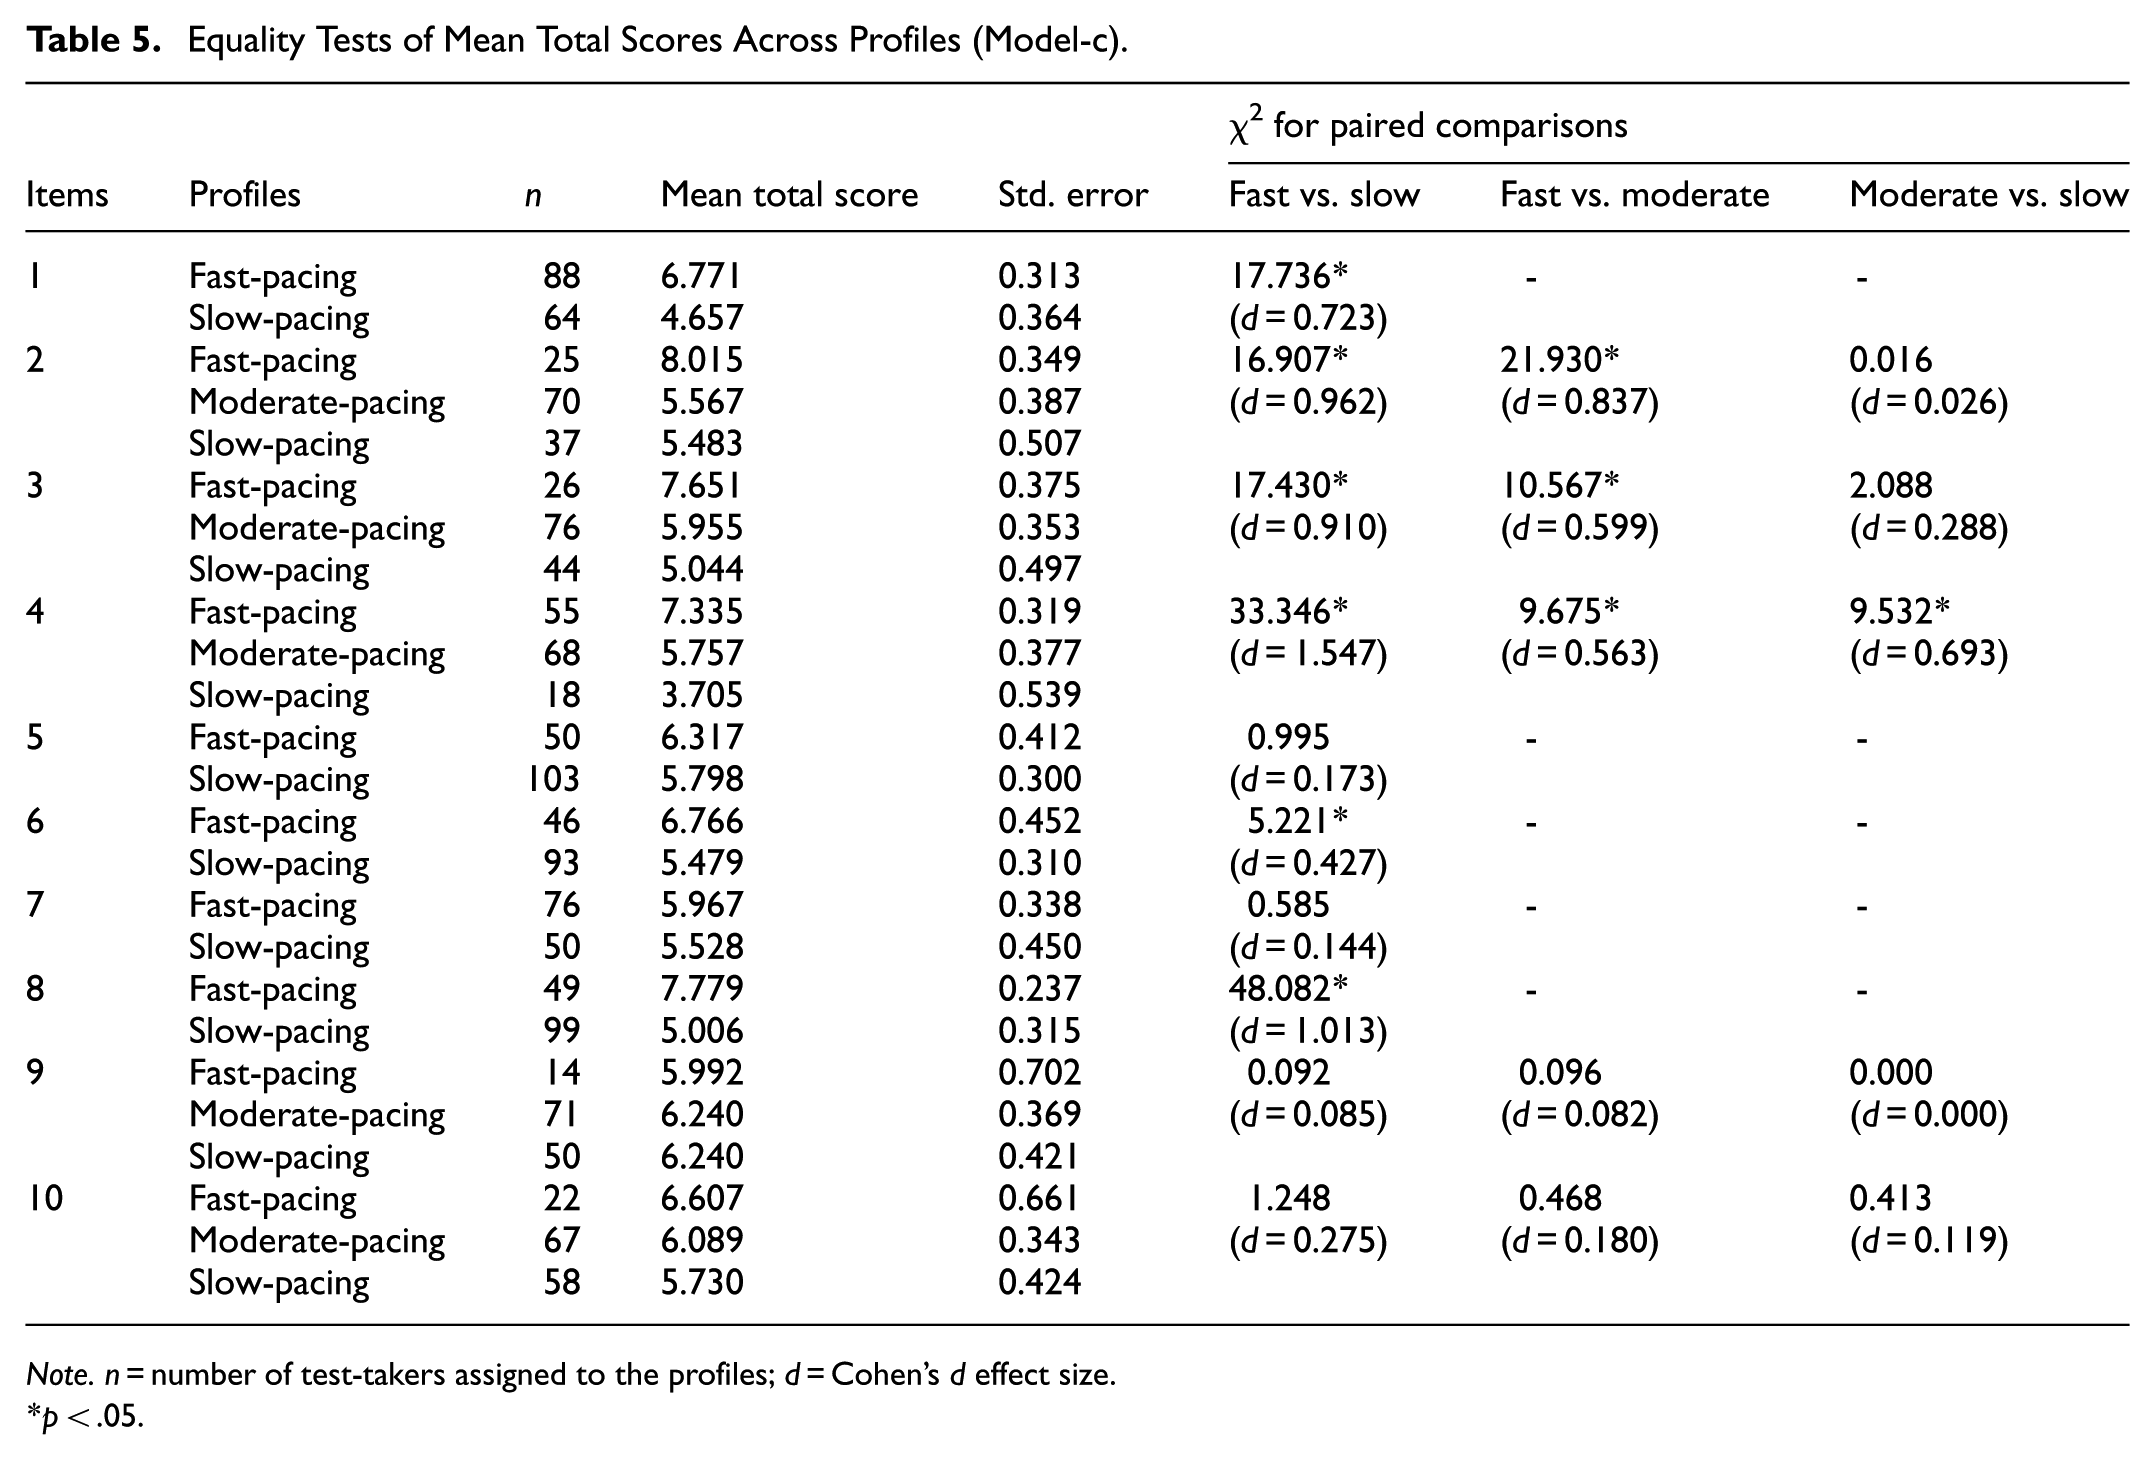
In Model-c, total test scores were incorporated as a distal outcome to address the third research question, which examines differences in total test scores across item processing groups. Table 5 presents the paired comparisons of test scores.
Equality Tests of Mean Total Scores Across Profiles (Model-c).
Note. n = number of test-takers assigned to the profiles; d = Cohen’s d effect size.
p < .05.
The results indicated that test-takers in the fast-pacing group had significantly higher total scores than those in the slow-pacing group for items 1, 2, 3, 4, 6, and 8 (p < .05). Additionally, test-takers in the fast-pacing group scored significantly higher than those in the moderate-pacing group for items 2, 3, and 4 (p < .05). For item 4, test-takers in the moderate-pacing group also had significantly higher total scores than those in the slow-pacing group (p < .05). The magnitude of effect sizes varied from small to large, reflecting varying levels of practical significance across these comparisons.
Common Characteristics of Items with Similar Group Structures and Observed Performance Differences
To address the fourth and fifth research questions, we examined the common characteristics of items with similar processing subgroups (i.e., profiles) and those with significant score differences among these groups.
Items tended to produce either two (fast- and slow-pacing) or three (fast-, moderate-, and slow-pacing) subgroups. Items with two groups were either moderately difficult (b ∼ 0.50) or easy (b > 0.60), with moderately difficult ones being short (47 and 48 words) and easy items relatively longer (82, 112, and 119 words). Items with three subgroups, however, spanned a broader range of difficulty and length, including a difficult and very long item (192 words), moderately difficult and shorter items (56 and 59 words), and easy but longer items (93 and 150 words). These findings reveal that multiple processing subgroups can emerge across a range of difficulty levels and lengths, suggesting that the interaction of these factors may drive variation in processing patterns.
Significant item and test score differences among the subgroups were most often found on items that were moderately difficult or easy and also highly discriminating. In these cases, fast-pacing group was more likely to respond correctly to these items and had higher total test scores than the other groups. However, items that showed no subgroup differences varied widely in both length (e.g., 47–192 words) and difficulty. These results suggest that when items are both discriminating and moderate or low difficulty, response processing differences may align with performance differences.
Discussion
Using latent profile modeling of fine-grained eye movement data from a reading comprehension test consisting of ten multiple-choice items, this study presents empirical evidence that there may be distinct response processing patterns, and that these patterns may vary depending on items’ psychometric properties (e.g., difficulty and discrimination parameters) or other characteristics such as word count.
Pertaining to the investigation of distinct response processing patterns (i.e., the first research question of the study), our results showed that there may be two (fast- and slow-pacing) or three (fast-, moderate-, and slow-pacing) response processing subgroups, which differed in process times across all AOIs. Moreover, the results revealed that the slow-pacing groups spent more time on the choices compared to the stem AOIs, whereas the fast-pacing groups allocated similar amounts of time to both the choices and the stem AOIs. Overall, these findings indicated that the subgroups differed not only in the total time spent on items but also in how they distributed their time across different parts of the item, reflecting distinct cognitive approaches to response processing. Although the influences of item-related factors on process times and processing groups remain relatively unexplored, two processing groups are often distinguished in the literature. For example, Hicks (2019), using process data such as response time and the number of highlight events to examine reading strategies in the PIAAC testlets, reported two subgroups: one group that progressed through items quickly, resembling a skimming strategy, and another group that took longer, suggesting a full-reading strategy. Also, Evans and Stanovich (2013) describe a dual-process, which distinguishes between fast, intuitive, and automatic processing (Type 1) and slow, reflective, and controlled processing (Type 2).
The item processing subgroups described in the present study nicely align with the two-group findings, and further present that, depending on the psychometric properties of the test items used, a ‘moderate-processing’ processing subgroup may emerge as a third group. We argue that the three-group structure, at least in part, might be related to how test-takers with varying performance levels might be engaging different modes of response processing when responding to items with varied psychometric properties, such as those with high versus low difficulty levels or other specific properties such as word count. The presence of a moderate-pacing group may reveal that some test-takers might be adopting a flexible processing strategy depending on an item's perceived difficulty and complexity (e.g., Nazareth et al., 2019; Mézière et al., 2023).
The findings of this study warrant future research investigating underlying cognitive strategies when processing items with varying psychometric properties and length. Longitudinal modeling (Çorbacı and Kahraman, 2022) as well as qualitative methods such as think-aloud protocols (Noushad et al., 2023; Stark et al., 2024) could provide deeper insights into response processing behavior. Additionally, test-takers with higher metacognitive awareness may adapt their strategies to enhance performance while those with lower metacognitive awareness may struggle to regulate their approach and achieve lower scores (Bax, 2015; Fritzsche et al., 2018). Assessing metacognitive awareness through questionnaires or interviews could help determine whether specific response processes are associated with better self-regulation and adaptive test-taking behaviors.
Pertaining to the comparison of item and test scores across response processing groups (i.e., the second and third research questions of the study), our results indicated that test-takers in the fast-pacing group had higher scores compared to the other groups. Previous studies comparing eye movements of high- and low-performing test-takers support that high-performing test-takers tend to have shorter response times and fewer AOI fixations (e.g., Bartolomé et al., 2020) and exhibit longer fixations with fewer visits to problem information areas, resulting in shorter overall test durations (e.g., Y. Hu et al., 2017). Regarding the potential causes of differences, previous research has provided important insights. For example, Bax’s study found that successful test-takers tended to use conscious strategies to locate relevant information in the text, whereas unsuccessful test-takers struggled to do so efficiently (Bax, 2013). Similarly, Tsai et al. (2012) and Krstić et al. (2018) concluded that high-performing test-takers were better able to recognize and focus on relevant information necessary for correct responses. In contrast, low-performing test-takers had difficulties distinguishing and prioritizing relevant details, leading them to search through the item for clues rather than processing it strategically. Further supporting this, Yaneva et al. (2022) examined response processes in multiple-choice items and reported that incorrect responses were associated with a reverse processing order, where test-takers worked from the answer options to the stem rather than the other way around. Conversely, correct responses were linked to processing the stem first, spending more time carefully reading the problem, and making a more decisive selection of a response option.
Analyses incorporating test-takers’ performance levels may help explain why test-takers in the slow-pacing group tended to answer incorrectly and had lower total test scores. Slow-pacing test-takers might struggle to locate relevant clues in the items or fully comprehend the stem due to unknown vocabulary or complex sentence structures. As a result, they may engage in a trial-and-error approach, searching for the correct answer among the alternatives. The observed relationship between fast-pacing and higher test scores may reflect differences in processing efficiency, defined as the relationship between performance effectiveness and the amount of resources invested in processing (Eysenck & Calvo, 1992). High-performing test-takers may process information more effectively, enabling them to answer correctly in a shorter time. Additionally, test-takers in the fast-pacing group may exhibit better metacognitive awareness (Bax, 2015), allowing them to allocate cognitive resources more effectively. In contrast, slow-pacing test-takers may experience higher levels of anxiety (Derakshan & Eysenck, 2009), which can negatively impact performance by increasing cognitive load and response times. Efficiency advantage among fast-pacing test-takers could stem from better retrieval of relevant knowledge or more efficient problem-solving strategies. However, it is important to note that fast-pacing might not always be associated with efficient cognitive processing. As we defined response processing using only fixation-based metrics and did not include effort- or engagement-related variables, some instances of fast processing could reflect skipping or guessing without fully focusing on or comprehending the item. Indeed, fast-pacing may be an indicator of low effort and disengagement (Wise & Kong, 2005), warranting further study using engagement metrics.
Pertaining to the evaluation of the common characteristics of items with similar processing subgroups (i.e., the fourth research question of the study), our results showed that participants’ response processing patterns might change depending on the items’ psychometric properties and that the latent class structure underlying item processing behavior may reveal two or three subgroups. Items with two subgroups were typically moderate or low difficulty, with moderately difficult items tending to be very short and easier items relatively longer. In contrast, items with three subgroups covered a wider range of difficulty levels, from difficult to easy, and included both short items and much longer ones. Overall, these findings indicated that both difficulty and length contribute to subgroup variation, suggesting that the interaction of item-related factors may drive differences in response processing patterns. Longer items may encourage a more thorough reading strategy, while shorter items may be skimmed more quickly (e.g., Gerth & Festman, 2021). Beyond length, the complexity of an item—for instance, the presence of unknown words or complex sentences—might play a role in determining processing behaviors (Bartolomé et al., 2025). Such characteristics may increase demand in cognitive resources, leading to slower processing and potentially lower accuracy.
Pertaining to the evaluation of the common characteristics of items with observed score differences across groups (i.e., the fifth research question of the study), our results showed that items with high discrimination and moderate or low difficulty were most likely to reveal score differences across processing subgroups, with fast-pacing test-takers generally outperforming others. In contrast, some items did not differentiate among groups. For instance, one of the easiest items included weak distractors and an explicit clue to the correct answer (item 5), while others were among the shortest in the set, causing limited textual content (items 7 and 9). Another was the longest and most difficult item, but showed relatively low discrimination, meaning that processing differences did not translate into performance differences (item 10). These results suggest that item-related factors play a nontrivial role in the differences observed among item processing subgroups, with weak distractors, short text, or low item discrimination. Particularly, highly discriminating items are effective not only in differentiating test-takers based on their knowledge but also in distinguishing their response processing patterns. Overall, these findings reveal that response processing differences may nicely align with performance differences depending on the item’s characteristics, such as difficulty, discrimination, and length, suggesting that item-related factors might be driving the variation observed in item processing patterns (e.g., Akgün & Ünaldı, 2022; Arslan et al., 2020).
Inferences derived from a joint analysis of item and performance-related sources of differing item processing behavior carry important implications for both psychometric evaluation and educational practice. From a psychometric perspective, test developers can use item-level process indicators (e.g., time spent on stems vs. options or on distractors) to assess item quality, revise the items if necessary, and create more discriminative items that better reveal individual differences. From an educational standpoint, the findings point to response processing as a potential target for instructional support. Slow-pacing groups, for example, may benefit from strategy training in time management and efficient reading, such as techniques for locating key information and allocating time across item components. Process data can also be used to deliver individualized feedback that fosters metacognitive awareness and self-regulation. These data-driven insights, in turn, can guide the development of personalized training programs aligned with learners’ individual processing profiles. Ultimately, leveraging eye-tracking data in this way can enhance both the validity of assessments and the effectiveness of instructional practices, contributing to more equitable and supportive learning and testing environments.
Limitations and Future Directions
While this study provides valuable insights into test-takers' response processing patterns, there are some caveats to consider. The results presented may not be fully generalizable due to the limited number of test items with specific characteristics, such as item difficulty and discrimination. Additionally, this study relied solely on fixation-based eye-tracking data, which may not fully capture the complexity of response processes. Future research could integrate both fixation- and saccade-based data to provide a more detailed understanding of how test-takers interact with multiple-choice items. Expanding the study to include a wider range of item characteristics, such as very difficult, low-discriminating, and extremely short or long items, would further enhance the findings.
Also, this study primarily focused on eye-tracking data, but incorporating multiple measures—such as neuroimaging techniques and self-report questionnaires—could offer a more comprehensive perspective on cognitive and emotional factors influencing response processes. Future research could also explore the role of affective variables, such as test anxiety and motivation, by incorporating physiological measures (e.g., heart rate monitoring) and self-report scales to assess their relationship with response processes and test performance. While the sample size was sufficient for the analyses conducted, future studies could benefit from a larger and more diverse participant pool, including test-takers with varying levels of reading comprehension proficiency. A broader sample would provide a more generalizable understanding of response processing patterns across different proficiency levels and demographic groups.
Moreover, all participants in this study were native Turkish speakers and learners of English as a foreign language. Although they were enrolled in different departments, all were undergraduate students from the Faculty of Education. While their sociocultural and linguistic backgrounds may appear relatively similar, some variability is inevitable. A further limitation of the study is that sociocultural factors and linguistic variables—such as native and foreign language proficiency—were not assessed. Previous research has emphasized that reading is a multifaceted construct, encompassing a wide range of competencies that collectively shape this skill (Koda, 2005). Therefore, unmeasured variables such as cultural background, language proficiency, and other linguistic characteristics may have influenced the response processes. Future studies would benefit from incorporating these variables to gain a deeper understanding of how test-taking strategies vary across linguistic and cultural contexts. In addition, future research could move beyond exploratory questions by incorporating theory-driven hypotheses (e.g., Processing Efficiency Theory; Eysenck & Calvo, 1992), which would help to clarify how individual differences in response processes are shaped by underlying cognitive mechanisms.
Conclusion
This study uses latent profile analysis to address an important issue concerning the use of eye movement data to identify item response processing patterns in test-takers. The results indicated that two or three response processing patterns (fast-, moderate-, and slow-pacing) emerged depending on the difficulty and length of the items. Furthermore, the fast-pacing group exhibited higher test performance than others, particularly for highly discriminating and moderately difficult or easy items. The presented results suggest that although often overlooked, the psychometric properties of test items might indeed influence test-takers’ item processing behavior. In particular, key characteristics such as difficulty, discrimination, and length play a crucial role in shaping the underlying response processing patterns. Our findings support that response processing patterns and their relationship with observed scores provide valuable insights into qualitative differences in multiple-choice item processing behaviors. Overall, our findings offer invaluable insights into response processing behavior, serving as an important source of evidence for evaluating the validity of inferences drawn from observed test scores (X. Hu & Aryadoust, 2024; Messick, 1995; Sousa et al., 2025). Beyond research implications, such analyses can support practical applications, including the development of items that more effectively reveal individual differences, the identification of distinct test-taker processing profiles, and the design of targeted feedback or instructional interventions that address specific processing behaviors. Studies aiming to relate specific eye movement patterns to proficiency measures of interest could greatly benefit from a psychometric analysis of choice to ensure the characteristics of the items used in test applications are well-suited for the intended inferences.
Footnotes
Ethical Considerations
The experimental methods were approved by the Gazi University Ethics Committee (No: 80287700-302.08.01-156936).
Consent to Participate
Informed consent was obtained from all participants before the study.
Author Contributions
Derya Akbaş, conceptualization; methodology; formal analysis; visualization; writing – original draft: Ergun Cihat Çorbacı, conceptualization; investigation; data curation; writing – review and editing: Nilufer Kahraman, conceptualization; data curation; funding acquisition; writing – review and editing.
Funding
The authors disclosed receipt of the following financial support for the research, authorship, and/or publication of this article: This study was partially supported by the Scientific and Technological Research Council of Türkiye (TUBITAK) (Grant number 120K142).
Declaration of Conflicting Interests
The authors declared no potential conflicts of interest with respect to the research, authorship, and/or publication of this article.
Data Availability Statement
The data that support the findings of this study are not publicly available.
GenAI Use Disclosure Statement
GenAI Use Disclosure Statement During the preparation of this manuscript, the authors used ChatGPT to assist with language editing and improving the clarity of the text. After using this tool/service, the authors reviewed and edited the content as needed and take full responsibility for the final version of the manuscript.