
Abstract
Frequently, public service deliverance has adverse substantive impacts on the environment. Wolf’s theory of non-market failure views these impacts as derived externalities, while Moore’s theory of public value invites to view them as resulting from a partial or biased consideration of the public-value dimensions by the service providers. In the case of healthcare, such environmental damages also have a boomerang effect, so they often affect people’s health. However, the carbon footprint (CF) of public hospitals remains understudied in many countries. More specifically, very little research focuses on the evolution of CF at the organizational (hospital) level under a systemic shock like the last pandemic. To our knowledge, this is the first study that combines CF computation and data envelopment analysis (DEA) to investigate the environmental efficiency of public hospitals before and during the pandemic. We compare a big and purely public hospital (HA) with a smaller public hospital managed through a public-private partnership (HB). In both hospitals, the main sources of emissions were electricity consumption (55.89% in HA and 48.41% in HB) and natural gas (28.89% in HA and 26.41% in HB). During the pandemic, the two hospitals achieved higher scores in our DEA-based environmental efficiency measure, even when a standard general activity volume indicator is added as input. Our results portray 2020 as the abrupt shock year and 2021 as the year of a shock attenuation (HA) or partial return to normalcy (HB).
Plain Language Summary
The provision of public services in general and healthcare in particular often generates greenhouse gas emissions. Moreover, in the case of healthcare, the environmental impacts can have a boomerang effect, adversely affecting people’s health. This study begins by looking at the phenomenon in the light of two different approaches, non-market failure theory and public value theory. Then, it combines two technical tools to measure and analyze the CO2 emissions of two public hospitals with different management models. The main sources of emissions were electricity consumption and natural gas. The hospitals’ environmental efficiency increased during the pandemic. The results portray 2020 as the year of abrupt shock and 2021 as the year of partial recovery.
Keywords
Introduction
Unfortunately, most economic activities in today’s world cause imbalances in the environment. However, the costs of such imbalances are often not borne by the economic agents that carry out these activities, but end up being borne by society. Climate change and pollution are the best example of these costs. We often tend to believe that these are damages caused by companies or individuals pursuing their self-interest, but in many cases, they are caused by the government itself (see Wiedmann & Barrett, 2011 and Ottelin et al., 2018 for two notable examples of carbon footprint measurement in government). This fact introduces a contradiction in the logic of government action since an organization that aims to correct market failures is generating similar failures. A second contradiction arises from this, which is the one between what the government requires of private agents and what the government itself does. In Novaes Das Virgens et al.’s (2020) words, “public agencies that require the private sector to recognize and manage their greenhouse gas emissions are the same public agencies that do not recognize their own carbon footprints.”
The Environmental Damage of Public Services as a Non-market Failure and Public Disvalue
In the field of public economics, market failure is identified with an allocation of resources that departs from Pareto efficiency, that is, a situation in which it is not possible to increase the welfare of one person without reducing the welfare of another. The carbon footprint of market activities is, from this point of view, included in one of the six market failures listed by Stiglitz and Rosengard (2015): externalities. If a market activity causes beneficial or harmful effects to third parties and these effects are not reflected in the market price, an externality is said to exist (Rosen & Gayer, 2013). When the activity of, for instance, a private hospital damages the environment, this is a negative externality.
In some cases, it is the government itself that, when offering a public service, generates certain damage to society. In this case, the government offers public services free of charge or almost free of charge, so there is neither a charge nor a market price that can be “reproached” for not reflecting this damage to society. In Wolf’s (1979a, 1979b, 1988) theory of non-market failures, this difference between private and public provision is seen as a fundamental key to assert that the derived externalities caused by government are analytically distinct from the externalities resulting from market transactions. By derived externality, he means an unanticipated side effect of a government intervention to correct some market failure. Just as externalities at the market level may or may not be foreseen, derived externalities have the characteristic of not being foreseeable or, at least, not having been foreseen when the causing policy is initiated. While negative externalities like pollution from market producers occur because these are not forced to pay for the environmental costs they impose, derived externalities like pollution from government agencies happen because these do not realize them, thereby not affecting their calculations or behavior. Underlying derived externalities is the fact that the effects of government instruments are often far reaching and difficult to forecast, as well as the strong political pressures for intervention, the myopia of political actors, and the ill-defined nature of non-market outputs. An early line of criticism of Wolf’s theory contends, however, that unintended side effects are not a problem exclusive to governmental or non-market organizations. In Le Grand’s (1991: 431) words, “there seems no a priori reason for supposing that government organizations are likely to create more ‘derived externalities’ than private ones; and, if that is the case, these kind of externalities are as much a source of the market as of government failure.”
A more recent intellectual tradition conceives of the role of government not so much as a corrector of market failures as a creator of public value. This concept, introduced by Moore (1995), suggests that public administration aims to create value for citizens, just as private enterprise aims to create value for shareholders. Public value encompasses the contribution of public sector institutions to improve the quality of individual and collective life, not only in the economic, political, social, or cultural dimensions but also in the ecological dimension (Benington, 2009, 2011). Public value theory invites, therefore, to view the ecological damage arising from public services as resulting either from a deliberate choice in a tradeoff between such dimensions or from a partial or biased consideration of the set of dimensions (i.e., the public value) by the service provider. Going further, Swilling (2011) criticizes that this approach locks us into a language of tradeoffs, with each dimension retaining its respective logic, and calls for a systems approach that allows us to see the different dimensions as embedded within each other. He also argues for moving beyond the traditional anthropocentric perspective of public value theory to a more ecocentric view, which requires us to protect nature for its own sake and in the interest of non-human species as well. Along these lines, Vollmer (2021) elaborates on the notion of planetary public value and outlines its corresponding accounting, with a planetary people that includes humans and non-humans as the ultimate reference. Also, Coffey (2021) underlines that, while the public value concept offers considerable potential, it has yet to fully address the challenges posed by ecology thinkers. To contribute to this, he identifies and discusses five of the challenging themes.
The Case of Public Healthcare Providers
According to a study published in 2017 by the World Bank in collaboration with Health Care Without Harm, in 2011 the healthcare sector was already responsible for 5% of global CO2 emissions (Karliner et al., 2019). For the year 2014, Pichler et al. (2019) found that the sector was responsible for 4.4% of the total emissions from India, China and all Organization for Economic Cooperation and Development (OECD) countries minus Chile. Contributing to such emissions are all healthcare logistics; workers and patients’ daily commuting to hospitals; ambulances; hospital energy consumption; product manufacture, use, and disposal; etc. In the studies systematically reviewed by Rodríguez-Jiménez et al. (2023), between 15% and 50% of the carbon footprint of healthcare settings is attributed to the direct emissions from non-purchased energy use and the indirect emissions related to purchased electricity. The rest of the indirect emissions consequence of the healthcare activity ranged between 50% and 75% of the total emissions, corresponding mainly to disposables, equipment, and pharmaceuticals. From another point of view, the literature evinces that the three hospitals’ largest contributors to greenhouse gas emissions are the operating theater, intensive care unit, and gastrointestinal endoscopy (Tee et al., 2024).
It is worth noting that a polluting public health system poses a particularly acute contradiction because the boomerang effect is, in this case, intrasectoral. The pollution caused by public healthcare contributes to the emergence of chronic diseases that require hospitalization and constant use of drugs, which will generate more emissions by the health system. In other words, the very environmental problems generated by healthcare and the very causes of these problems are feedback on each other, making it essential to take action. It is therefore imperative to project onto health care the notion of a green economy, which encompasses all those initiatives that promote respect for the environment and sustainable development in policy making, strategy formulation, and the use of natural resources for global development (Sami et al., 2021).
As early as 2010, the U.S. Department of Energy (DOE) began to encourage the design and construction of energy-efficient large hospitals (Bonnema et al., 2010). Already under the umbrella of green hospitals, the World Health Organization (WHO) has also carried out activities with the theme “Health in the green economy” to reduce the environmental impact of hospitals in the world (Xia et al., 2021). However, in general terms, green economy initiatives are not yet very visible in the healthcare sector and studies on the subject have been available for relatively few years. According to hospital stakeholders, common barriers to reducing carbon footprint are non-demanding policies, organizational complexities, perceived trade-offs between “greenness” and healthcare performance, and lack of awareness and prioritization (Quitmann et al., 2023). At a broader social level, healthcare is still not seen as a polluting industry, probably because environmental activism tends to focus on issues with a clearly identifiable offender and victim, and we typically assume that everyone is to blame for healthcare carbon emissions (Richie, 2020).
Covid-19 and Hospitals’ Carbon Footprint
The impact of the pandemic on the carbon footprint of hospitals was twofold (Venkatesh et al., 2022). On the one hand, Covid-19 patient care and the protection of healthcare personnel triggered the use of face masks and shields, gowns, RT-PCR tests, respirators, and personal protective equipment (PPE), with a consequent increase in resource consumption, waste generation, and CO2 emissions. On the other hand, hospitals’ carbon footprint was pushed down by the cancelations or postponements of elective surgeries and, more broadly, the major setback in regular care resulting from the pandemic. Interestingly, the relative importance of both effects varied both in the cross-section and over time. Not all hospitals assumed the same prominence in treating Covid-19 patients. And not at all points in the pandemic did regular health care suffer to the same degree. As such care was reactivated with anti-Covid-19 precautions, hospitals’ carbon footprints tended to increase.
At the hospital level, there are already a few empirical studies that approximate the impact of the Covid-19 pandemic on the carbon footprint. Santiago et al. (2021) might be mentioned as a mere precursor to this literature since they did not yet measure the carbon footprint but only electricity consumption. Specifically, they used daily and quarter-hourly data from February 24 to April 30, 2019, and 2020, to measure and analyze the complete electrical consumption of the “Hospital de la Axarquía” (Torre del Mar, Spain). They found that, from the start of the pandemic-related restrictions until April 30, 2020, power demand became 19.49% lower. This reduction was recorded mainly between 9:00 and 17:00 hr, whereas a slight increase in demand was observed at night in spaces adapted for 24-hr care to Covid-19 patients. Morooka et al. (2022) measured the carbon footprint of Nagoya University Hospital (NUH) from April 2010 to March 2021, using the Greenhouse Gas (GHG) Protocol. They pointed out that NUH was one of the largest hospitals in Japan, employing over 2,000 staff and receiving over 500,000 outpatients annually. Its overall carbon footprint was 2.19% lower in 2020 than in 2019. This slight decrease was mainly attributable to the decreased amount of solid waste underlying to indirect emissions, and it likely arose from the reduced number of patients. Hajjarianti et al. (2023) observed that the Universitas Airlangga Hospital’s indirect carbon emissions, coming from its electricity use, were lower during the pandemic. Using the Intergovernmental Panel on Climate Change (IPCC) method, emissions went from 5.078.91 to 6.395.32 tons CO2e/year, while for the Universitas Indonesia (UI) GreenMetric the figures went from 5.509.23 to 6.937.97 tons of CO2e/year.
Already in the current year, the results of two other studies on the impact of the pandemic on the hospitals’ carbon footprint have been published. Di Russo et al. (2025) analyze the trends and level changes in the waste production and social cost of carbon of four Italian facilities, using a Mann-Kendall trend test and an Interrupted Time Series Analysis. Although they assume that the pandemic caused a surge in hospital waste (HW) and the associated CO2 emissions, their findings are mixed. Whereas the Istituto Mediterraneo per i Trapianti e Terapie ad Alta Specializzazione went from emitting 308,749 tons CO2e in 2019 to 486,494 tons CO2e in 2021, the Istituto Europeo di Oncologia and the Istituti Fisioterapici Ospitalieri experienced only slight increases, and the Cristo Re Hospital even reduced its emissions by 5.8%. Jiménez-Lacarra et al. (2024) take a Spanish hospital as a case study and evaluate the direct and indirect environmental aspects of its activities, from the perspective of life cycle assessment. They perform an inventory analysis and assess the environmental impact of the different categories inventoried, using a ReCiPe method and the CML-IA baseline V3.05/EU25 methodology. Environment Efficiency Indexes (EEIs) are then calculated by dividing the environmental impact by the annual hospital complexity unit, which is an annual activity measure. The results indicate that in 2020, compared to 2019, the hospital’s overall EEI increased by 17.2% and the hospital activity EEI (excluded the transport of patients, employees and goods) by 44%.
Objectives and Main Features of This Research
Despite the contributions just reviewed, the carbon footprint (CF) of public hospitals remains understudied in many countries and very few researches focus on how the Covid-19 pandemic affected CF at an organizational level. In this regard, Morooka et al. (2022) stated 2 years ago that, “although the (…) pandemic greatly impacted the medical sector, its influence on carbon footprints remains unknown.” And Lau et al. (2024 have recently underlined “the importance of carbon footprinting on an organizational level, to guide future sustainability strategies.” This research aims to contribute to fill these gaps in the literature. Our research objectives are to (1) measure the carbon footprint of the hospitals under study, (2) analyze the relative importance of their various emission sources, and (3) approximate the impact of the Covid-19 pandemic on its environmental efficiency relative to the carbon footprint. To our knowledge, this is the first study that combines CF computation and data envelopment analysis (DEA) to investigate the environmental efficiency of public hospitals before and during the pandemic. It is also the first to analyze the evolution of the global carbon footprint of entire hospitals in 2021 compared to 2020. We study a big and purely public hospital (HA) and a smaller public hospital managed through a public-private partnership (HB).
Materials and Methods
Our research was mainly based on the data on the different carbon footprint activities provided by the management of the two hospitals analyzed, which ultimately came from the invoices. The HA, which is fully public, has more than 1,000 beds and more than 100,000 square meters of floor space. The HB, on the other hand, had approximately 200 beds and a staff of about 1,000 health professionals. However, its floor area was close to that of the HA, being close to 100,000 m2. The HB was built under the Public Finance Initiative (PFI) formula, whereby a private company finances the construction and carries it out, under a public works concession contract, in exchange for receiving an annual fee for the lease of the building. The difference between this Public Private Partnership (PPP) hospital concerning the original PFI model applied in the UK is that, in our HB, the private partner has been in charge of both the construction and the subsequent provision and operation of the adjacent non-health services such as parking, cafeterias, etc. In the following subsections, we describe the methodologies used to calculate the carbon footprint of both hospitals and to obtain their DEA-based environmental efficiency indexes. The information on data sources is also complemented in these subsections.
Carbon Footprint Computation
To determine the carbon footprint of the two selected hospitals, we applied a methodology inspired by ISO 14064-1, with adaptations made by Smith Rodríguez and De Titto (2018). We followed the four steps shown in Table 1. Organizational limits were defined in terms of space and time. Regarding the former, all the buildings and facilities that make up the hospitals were taken into account. In the case of indirect emissions from organizations outside the hospital, we calculated the emissions or estimated them based on available information. As for the time limits, we took the years 2019, 2020, and 2021, with the first of these as the base year for further calculations and comparisons. Operational limits were established in terms of gases and the scope of emissions. Emissions of the main greenhouse gases were taken into account: carbon dioxide (CO2), methane (CH4), and nitrous oxide (N2O). Our focus was on Scope 1 and 2 emissions primarily and Scope 3 emissions partially. The identified sources of Scope 1 emissions were natural gas (stoves, kitchens, etc.), diesel (consumption for generators and ambulances) and refrigerant gases. Scope 2 emissions were electrical energy consumption for lighting, computer systems and medical devices. Scope 3 emissions included only those resulting from water consumption and distribution, paper production, building construction, urban waste management and the emission of medical gases.
Methodological Steps for Carbon Footprint Determination.

Source. Adapted from Smith Rodríguez and De Titto (2018), who based on ISO 14064-1.
Regarding the calculation method, we quantified emissions by means of the below formula:

where tCO2e would be the universal unit for measuring greenhouse gas emissions in tons equivalent in terms of CO2 emission, thereby indicating the global warming potential (GWP). The tCO2e values would result from multiplying the activity data (DA) by the emission factor (EF) corresponding to such activity. DA would be the volume of the greenhouse gas emitting activity, while EF would be the amount of CO2 emitted per unit of DA.
Many of the sources, such as gas, for example, could be calculated directly from official consumption data. Other sources were obtained through indirect calculation. To quantify the emission factors for Scope 1 and 2 data, the procedures described in the greenhouse gas emissions calculation guide of the Catalan Office for Climate Change (COCC) were mainly taken into account. For Scope 3 emissions, we resorted to as many available sources as we considered useful to obtain the data of interest. Given the diversity of data and sources used, we tried to qualitatively assess the statistical uncertainty of the DA and EF parameters. As shown in Table 2, we assume that both the activity data from supplier invoices and the emission factors for natural gas, diesel and electricity consumption have a low level of uncertainty.
Method of Obtaining, Data Sources and Level of Uncertainty of DA and FE Figures.
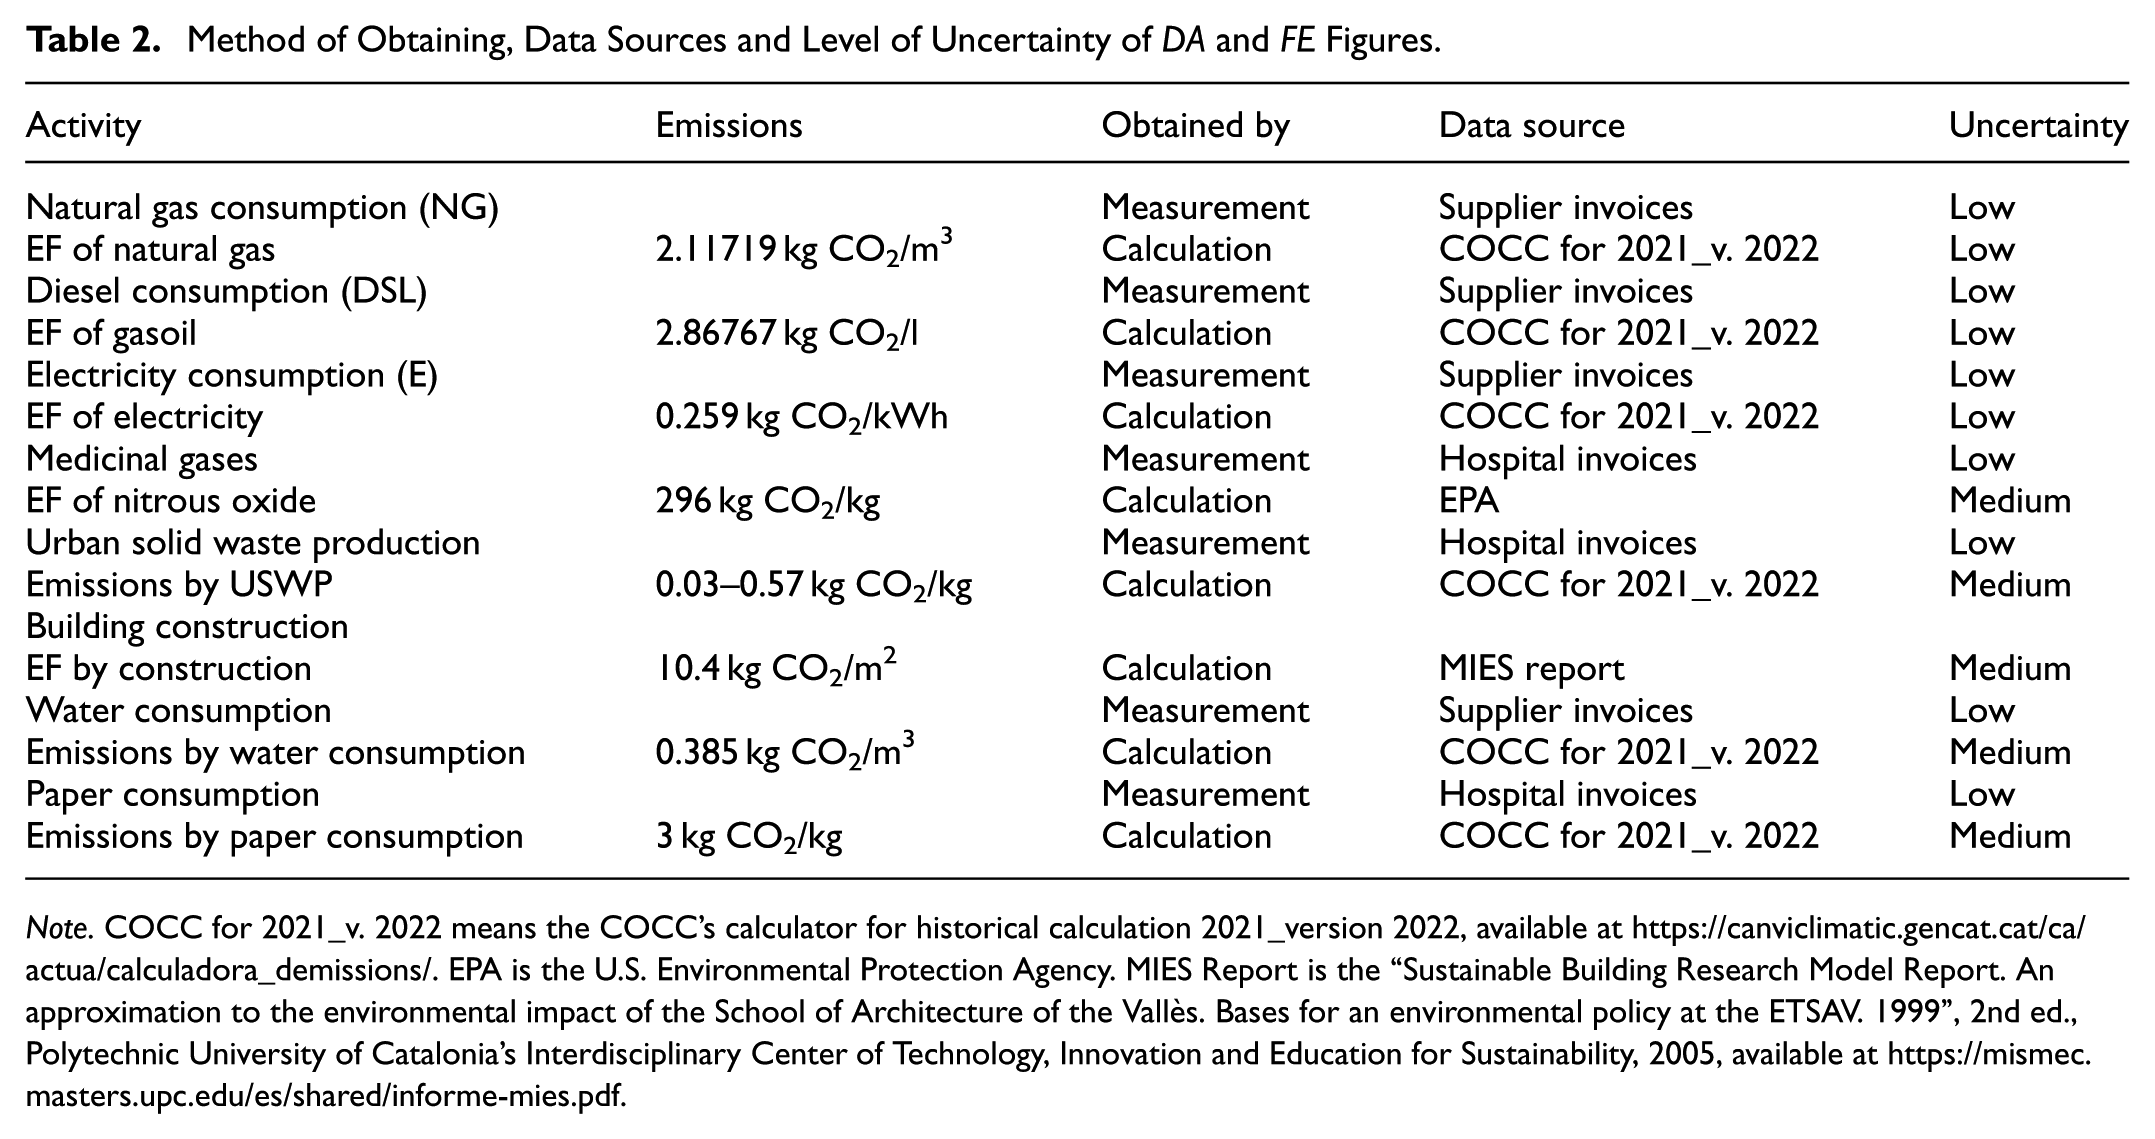
Note. COCC for 2021_v. 2022 means the COCC’s calculator for historical calculation 2021_version 2022, available at https://canviclimatic.gencat.cat/ca/actua/calculadora_demissions/. EPA is the U.S. Environmental Protection Agency. MIES Report is the “Sustainable Building Research Model Report. An approximation to the environmental impact of the School of Architecture of the Vallès. Bases for an environmental policy at the ETSAV. 1999”, 2nd ed., Polytechnic University of Catalonia’s Interdisciplinary Center of Technology, Innovation and Education for Sustainability, 2005, available at https://mismec.masters.upc.edu/es/shared/informe-mies.pdf.
DEA-Based Environmental Efficiency Indexes
Once carbon footprints were computed, a data envelopment analysis (DEA) was performed to obtain an environmental efficiency index for the two hospitals under study, in the year prior to the pandemic (2019) and in the two Covid-19 years for which data have been available for us (2020 and 2021). The environmental efficiency measured refers to CO2 emissions from the consumption of natural gas, electricity, water, paper and medical nitrous oxide, plus those resulting from prorating the emissions attributable to the construction of the hospital over its 50 years of useful life. In a first analysis, the only input was the number of beds in each hospital and the output was its emissions from the aforementioned sources, expressed in kilograms of carbon dioxide equivalent (kg CO2e). The DEA model applied was the multiplicative model with an output orientation, measuring the radial distance from each observation to the maximum emissions boundary. Since the DEA score is higher the smaller the distance or, in other words, the closer the observation is to the maximum emissions boundary, the environmental efficiency index (EEI) is taken here as the opposite of the DEA score (θ):

In a second analysis, an additional input was entered into the DEA model in order to take into account the volume of activity. The indicator for this input was the product of patient discharges by the average weight of discharges, which “reflects the average complexity of the patients treated in a hospital, measured through the consumption of resources” (Observatorio de Resultados del Servicio Madrileño de Salud, 2025, p. 25). Based on the range in which the relative weight of fixed costs in hospitals tends to move (between 60% and 85% according to the works handled), we apply type II restrictions in this analysis. These restrictions limit the proportion of each weighted input in the sum of all the weighted inputs from the bottom and the top, thus excluding the possibility that any of the two inputs has a zero weighting. In our case, the constraints applied were:


As for the treatment of the time dimension of the data, we chose a window DEA model with a width equal to the number of available years. With respect to the “returns” (CO2 emissions per bed) of scale, we initially estimated the classical models of Charnes et al. (1978) and Banker et al. (1984), which assume respectively constant returns to scale and variable returns to scale. It is therefore assumed in the CCR that the scale at which services are provided does not influence the volume of CO2 emissions per hospital bed, while the BCC adopts the opposite assumption. Following standard practice, the results of both models will be presented, although one of the statistical tests proposed by Fukushige and Miyara (2003) will then be applied to try to decide between the two models. This test is nothing more than a test of the difference in means of the scores of both models, performed with the z statistic, and whose null and alternative hypotheses are the following:

The statistic to be obtained is as follows:

Results
The Hospitals’ Carbon Footprint
Identification of Emissions
Natural Gas
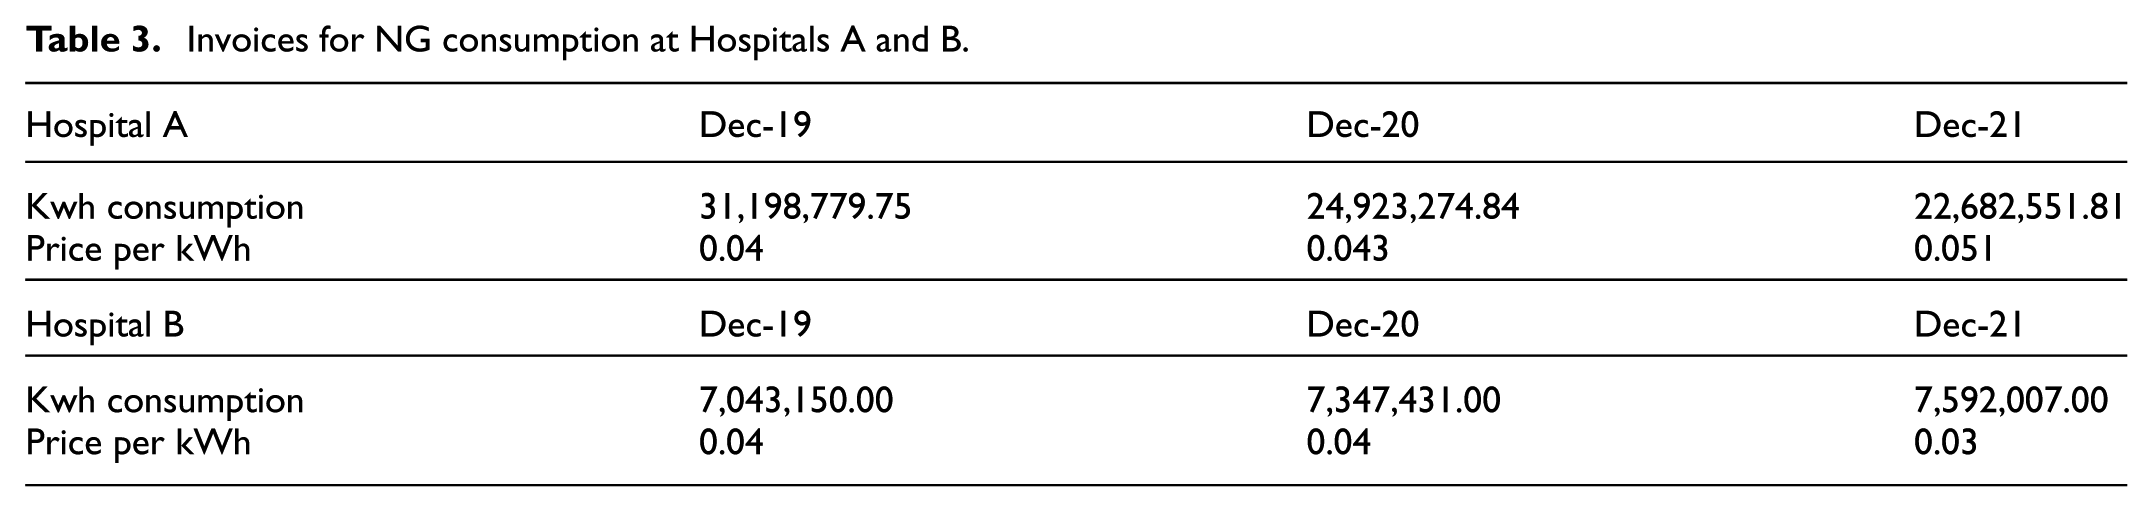
Since this gas is burned in the hospital itself, it constitutes a direct emission from the organization. It comes mainly from the heating of the buildings that make up the hospital complex and from the kitchens and cafeterias. The data have been provided directly by the hospitals from the gas consumption invoices shown in Table 3. Since it takes 1 m3 (cubic meter) of natural gas to produce 11.70 kWh, it can be deduced that in the year 2021, the Natural Gas consumption of Hospital A was 1,938,679.64 m3 while in Hospital B it was 648,889.49 m3.
Invoices for NG consumption at Hospitals A and B.
Diesel
According to the available data, when calculating direct emissions due to diesel consumption, we will only take into account consumption from generators. These refer to all machines that operate with an electric generator through an internal combustion engine. In the year 2021, the consumption of diesel fuel for generator sets in Hospital B was about 9,000 l based on the information provided by the hospital. We do not have the diesel consumption data for Hospital A, so we will not include it among its sources of emissions (we will see, in any case, that the proportion of emissions linked to this consumption is negligible). As for the ambulances, none of them depend directly on the hospital but belong to the emergency service of the Community of Madrid. Therefore, the emissions resulting from their activity would be recorded as external emissions. There is no data on other vehicles belonging to the hospital itself.
Electricity Consumption
The electrical energy consumed by a hospital comes from external sources, usually from an electric power company that can produce such energy from renewable or non-renewable sources. The hospital’s electricity consumption is mainly for lighting, equipment and other electrical appliances such as televisions, elevators, etc. The electricity consumption data for our Hospitals A and B have been provided directly by both from the electricity consumption invoices shown in Table 4.
Invoices for Electricity Consumption at Hospitals A and B.

Water Consumption
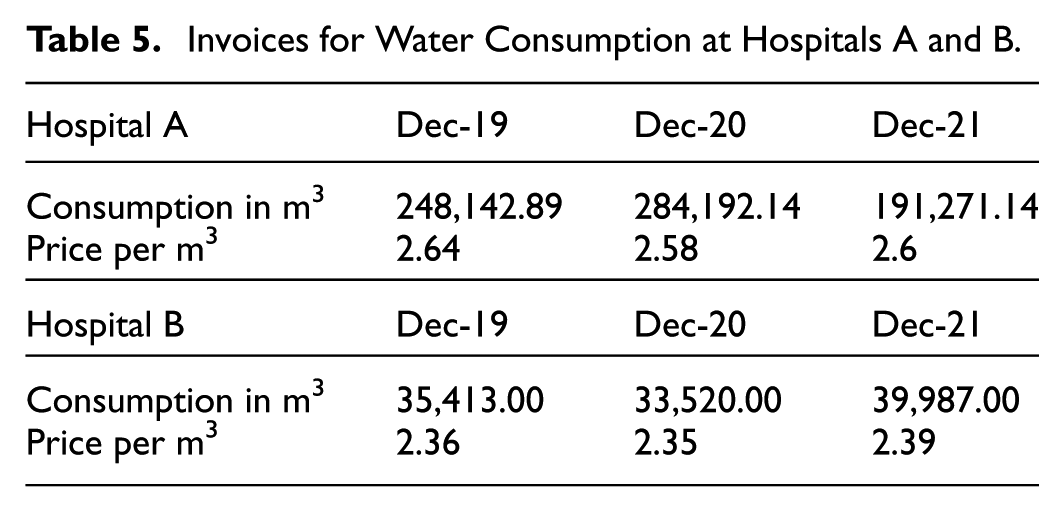
This is an important source of emissions both in its potabilization and purification. Since the water in a hospital is supplied by the water company of the municipality where the hospital is sited, we are dealing with an indirect source of emissions, which depends on instances external to the organization. According to the Catalan Office of Climate Change, of the total emission factor of the urban water cycle of 0.385 kg CO2/m3 (Table 2), 0.152 kg CO2/m3 would correspond to the supply and 0.233 kg CO2/m3 to the treatment and purification of wastewater (Catalan Office for Climate Change [COCC], 2022). The water consumption data shown in Table 5 come from the invoices provided by the hospitals for this kind of consumption, expressed in cubic meters.
Invoices for Water Consumption at Hospitals A and B.
Paper Consumption
Paper production is an external emission to the organization. The data provided in Table 6 correspond to the annual consumption of DIN A4 paper for photocopiers of our two hospitals. Since the consumption data are expressed in units, they must be translated into kilograms to apply the emission factor and thus obtain the carbon footprint. With an estimated weight of 0.00498 kg for each DIN A4 sheet with a surface area of 62,370 mm2, the total weight of all the sheets consumed by Hospital A in 2021 was 101,394 kg and in Hospital B it was 17,306 kg. It should be clarified that the emission factor of 3 kg CO2/kg shown in Table 2 is for the production of white paper, while the EF for the consumption of recycled paper is 1.8 kg CO2/kg (in both cases, the EF is taken from the Aragonese strategy against climate change). We do not have data on the percentage of paper recycled by each hospital, but the annual average for paper recycling in Spain is around 80%.
Invoices for DIN A4 Paper Consumption at Hospitals A and B.

Building Construction
Based on the MIES Report of the Polytechnic University of Catalonia, De Toro Jordano et al. (2014, p. 10) point out that the construction of buildings generates considerable emissions and, when calculating them, the useful life of the infrastructures without the need for maintenance works must be taken into account. In the case of our two hospital complexes, each has a built-up area of approximately 100,000 m2, according to the Cadaster. For each square meter built, the emission factor would be 520 kg of CO2, according to the aforementioned MIES Report. As for the useful life of a hospital, Spain’s Royal Decree 1247/2008, approving the structural concrete instruction, estimates it at about 50 years. Dividing the aforementioned emission factor by the 50 years of useful life, we obtain an emission factor of 10.4 kg of CO2/m2 each year.
Mobility
To obtain reliable data on the emissions generated by the commuting of workers, we should know the individual case of each worker, whether he/she commutes by public transport or private vehicle, the type of fuel used by each vehicle, the average consumption of the vehicles, the distance from the hospital to the home of each worker, etc. Although, based on the already cited study by Smith Rodríguez and De Titto (2018), we could estimate the impact of the displacement of health professionals at 800 tCO2e, we have not included this data in our study for three main reasons. First, the excessive level of uncertainty in the calculation. Second, the limitation of having taken into account only health professionals, and not other administrative workers or students. Third, the obvious fact that how workers travel can vary considerably from one city to another. Moreover, ambulances and helicopters are external to our hospitals, as the former belong to the emergency service of the Community of Madrid or to other organizations, and we do not have the necessary data to quantify their carbon footprint about Hospital A or Hospital B. In general, the transport of workers and students would constitute a Scope 3 emission and, therefore, external to the hospital and, to a large extent, beyond its control.
Waste Management
Table 7 shows the waste production of Hospital B in the years 2019 to 21 in Kilos and the EFs of the management of the different types of waste, according to the Catalan Office of Climate Change. Biosanitary waste assimilable to urban waste (BWAUW) are those wastes derived from healthcare activity but that do not require special treatment, such as bandages or clothes, so they have been counted as light packaging. Special biosanitary wastes (SBW) and cytotoxic waste have been counted as hazardous chemical waste. For chemicals, glass, and cardboard, the COCC provides specific data and bulky waste has been counted as general waste. Comparing the year 2021 with that of 2019, it is observed that Hospital B’s SBW waste increased by 100.4%, bulky waste by 53.9%, cardboard consumption by 26.7%, chemical waste by 13%, cytotoxic waste by 5%, and glass waste by 3.7%. Only BWAUW waste decreased (by 5.2%), although it was higher than in 2020. In addition, it is worth noting the 272.5% increase in SBW waste recorded in 2020, against a backdrop of a reduction in almost all other waste categories. Furthermore, we do not have data on solid urban waste from hospital A, but, as is the case with diesel, emissions from solid urban waste treatment are negligible in the overall calculation.
Hospital B Waste Generation and EFs of the Different Wastes According to the COCC.

Medicinal Gases
Many of the gases used in medicine are potent greenhouse gases. Some of the most commonly used are anesthetic gases, especially nitrous oxide. According to the information provided by our Hospital A, the consumption of nitrous oxide in 2021 was 153.8 units while in Hospital B it was 25 units. Based on the prices per kilo consulted on different sales websites and on the price per unit in Hospital B’s invoices, we assumed that each unit corresponds to a 10 kg tank.
Quantification of Emissions
The carbon footprint of Hospital A in 2021 was 14,207.72 tCO2e, while that of Hospital B in the same year was 5,201.11 tCO2e. This difference, considerable in absolute terms, would be reversed, however, if it were taken into account that Hospital A had more than 1,000 beds, while Hospital B had about 200. Indeed, Hospital A generated emissions of 11.3 tons of CO2e per bed, while Hospital B generated emissions of 27.7 tons of CO2e per bed. Although, of course, there may have been many other factors beyond beds that explain this difference (e.g., greater weight in Hospital B of medical activities that do not involve hospital admissions), what can be stated at the outset is that the per capita emissions of the public hospital are lower than those of the PFI hospital. Both are university hospitals.
Tables 8 and 9 summarize the impact of each of the hospitals’ activities. The emissions released directly by Hospital A were equivalent to 4,559.69 tons of CO2 while the emissions of Hospital B were equivalent to 1,473.63 tons of CO2. Indirect emissions to meet the energy demand of Hospital A amounted to 7,941 tons of CO2e, compared to 2,518 tons at Hospital B.
Hospital A Emission Sources Year 2021.

Hospital B Emission Sources Year 2021.

Analyzing Figure 1, we can see that Hospital A was directly responsible for 32% of its greenhouse gas emissions. Had the impact of worker mobility been included, this percentage would have been considerably lower. The main direct source of emissions was natural gas followed by nitrous oxide. Natural gas consumption decreased considerably over the years for which we have data, as can be seen in Table 3 (above, subsection 3.1.1). Nitrous oxide consumption was reduced considerably during the first year of the pandemic in Spain (2020), since it was not a necessary gas for COVID-19 treatment.

Distribution of Hospital A emissions.
Electricity consumption, that is, Scope 2 emissions, accounts for most of the emissions, as in most of the case studies. This implies that the largest source of emissions in the hospital is caused by the electricity supply companies and it is these that must reduce their environmental impact, continuing with the transition to renewable energies. The consumption of electrical energy has been continuously reduced in the 3 years for which we have data.
In terms of Scope 3 emissions, the construction of the hospital was the largest source of emissions, although the mobility of workers would certainly have been the largest source if it could have been quantified. Water and paper consumption are hardly relevant in terms of emissions, but this is not their main impact on the environment. Water consumption had a huge decrease in 2021 while paper consumption remained constant.
As can be seen in Figure 2, Hospital B was directly responsible for 28% of the emissions resulting from its activity. The consumption of natural gas increased steadily from the first year for which we have data (above, Table 4), implying a trend completely opposite to that of Hospital A. Overall, Hospital B had lower direct emissions than hospital A in absolute terms, but higher direct emissions per bed (around 7.8 tCO2e for HB compared to 3.6 tCO2e for HA). Diesel and nitrous oxide were barely relevant in global emissions but, taking into account only Scope 1 emissions, natural gas accounted for 93%, diesel for 2%, and nitrous oxide for 5%. Nitrous oxide use remained constant in the years for which data is available, with a slight reduction in 2020.
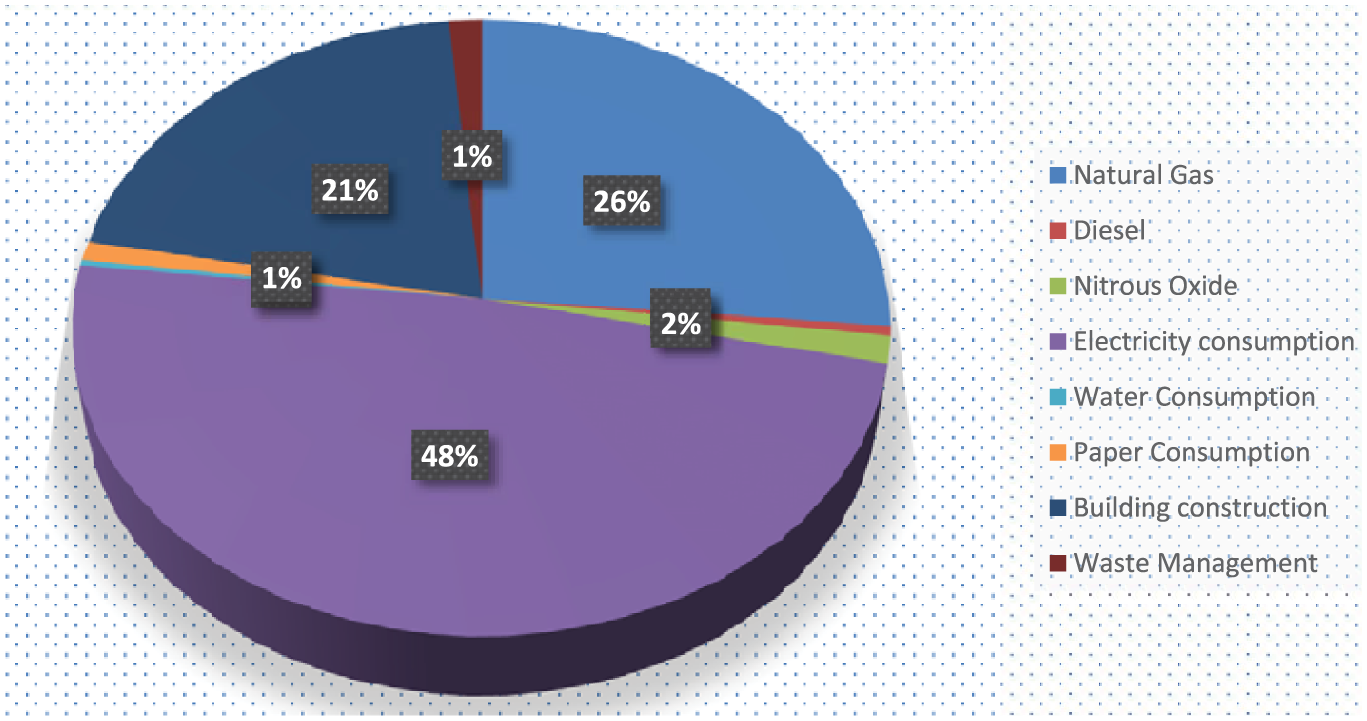
Distribution of Hospital B emissions.
The consumption of electrical energy accounted for 49% of the emissions in Hospital B, since it came mostly from polluting sources, in the same way, that in hospital A. As evidenced in Table 4 (supra, subsection 3.1.1), electrical energy consumption remained steady during the years for which data are available, although with a slight decrease in 2020 during the Covid-19 pandemic. This trend of maintaining the level of electricity consumption contrasts with the evolution seen in Hospital A, where consumption decreased.
With regard to Scope 3 emissions, the construction of the hospital itself is the source of most of the emissions measured, but, if it had been possible to quantify the emissions produced by the movement of workers, indirect emissions would have increased considerably.
The DEA-Based Environmental Efficiency Index With a Plant Proxy as Unique Input
Figure 3 shows the environmental efficiency indexes obtained from the CCR model, that is, assuming that the size of the hospital does not affect the volume of emissions per bed. The environmental efficiency of the “pure” public hospital, which is also the largest, appears to have been much higher than that of the public hospital managed in a public-private partnership. The greatest difference corresponded to the second year of the pandemic, in which the first hospital obtained a score of 0.58, while the second only got a 0.002 because its observation was located very close of the border of maximum emissions. In the reactions or responses to the pandemic, there were similarities and differences between both hospitals. Their environmental efficiency was higher during the pandemic than in the pre-pandemic period, but only Hospital A, which is purely public, achieved significant EEIs and continued to increase its EEI in 2021.

Environmental efficiency indices of the hospitals based on the CCR model.
Figure 4 plots the environmental efficiency indices obtained from the BCC model, which assumes that hospital size affects the volume of emissions per bed. The environmental efficiency of the larger public hospital still appears to be much higher than that of the smaller PPP hospital, but the distance between their scores is much shorter than in the CCR model, and Hospital B is no longer the only one to reach the maximum emissions frontier. The biggest difference between hospitals is still in the second year of the pandemic, where HA scores 0.24, while HB scores 0.002. Again, there are similarities and differences between both hospitals in their reactions or responses to the pandemic. Their environmental efficiency was higher during the pandemic than in the pre-pandemic period, but only Hospital A, which is purely public, continued to increase its EEI in 2021. It was necessary, however, to go further in the analysis (see next subsection) to know whether this meant that the pure public hospital had environmentally better managed the challenges of the pandemic or, on the contrary, its better evolution only reflected a different effect of the pandemic on the activity levels of both hospitals. After all, a higher volume of activity in proportion to the number of beds can most likely lead to higher emissions per bed.
Environmental efficiency indices of the hospitals based on the BCC model.
In Figure 5, the window model is dispensed with to plot pure cross-sectional frontiers of maximum emissions for 2019 (P1) and 2021 (P2). With constant returns to scale (CRS, own of the CCR model), these frontiers are vector radii given by the origin of coordinates and the observations of the smallest hospital, which emits the most CO2 per bed. With variable returns to scale (VRS, inherent to the BCC model), on the other hand, the bulk of the boundary is given by the segment between the observations of the two hospitals, becoming vertical for the smaller hospital and horizontal for the larger one. The fact that the frontier practically turns downwards (lesser emissions) in 2021 confirms the improvement of environmental efficiency with the pandemic, attributable to hospital A.
Shifting of the maximum emissions frontier from 2019 (P1) to 2021 (P2) with respect to the number of beds.
To try to determine whether the BCC or the CCR model is more appropriate in this case, we returned to the 3-year window DEA and applied the first step of the C-contrast proposed by Fukushige and Miyara (2003). Since, in the present case, the mean and standard deviation of the scores of the BCC model are 0.9257 and 0.0966 and those of the CCR model are 0.7306 and 0.2627, the value of the test statistic is:

as ∣z∣ = 1.708 > zc = 1.645, the null hypothesis is rejected at 5% significance, which would constitute favorable evidence for the BCC model. It would thus be confirmed that the scale at which services are provided or, in other words, the size of the hospital influences the volume of CO2 emissions per hospital bed.
The Environmental Efficiency Index When Activity is Added as Input
Figure 6 shows the EEIs obtained from the CCR model when the volume of activity (

Environmental efficiency indices of the hospitals based on the CCR DEA, when activity (weighted discharges) is added as input and the restricted multiplier model is used.
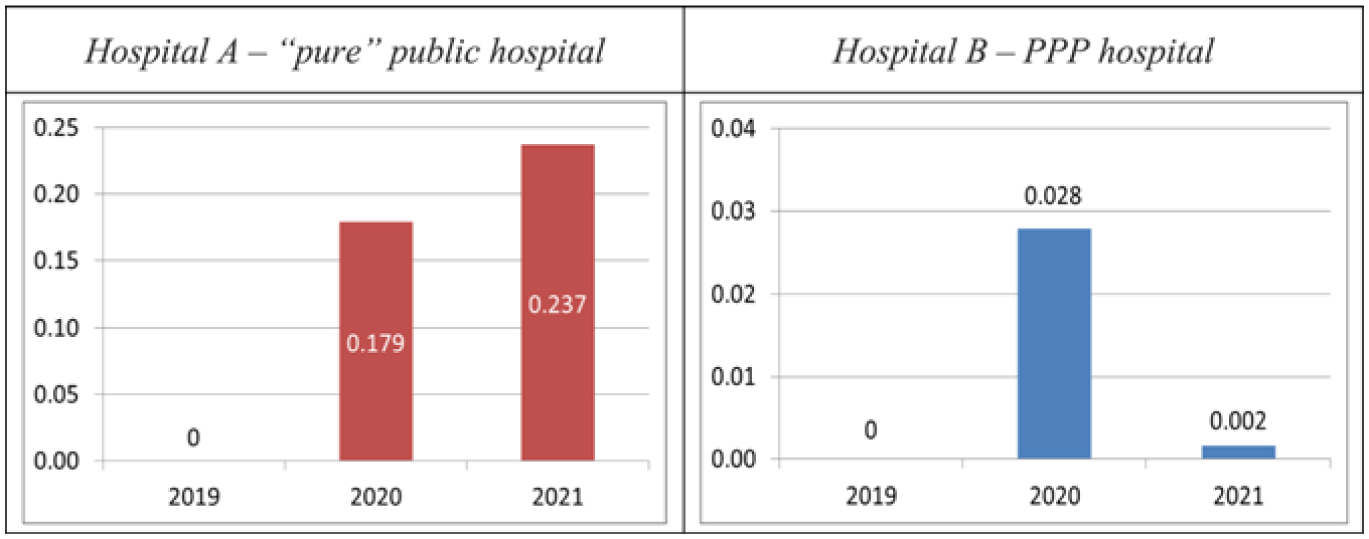
Figure 7 plots the environmental efficiency indices obtained from the BCC model in the two-input restricted multiplier DEA. The resulting EEIs are very close to those previously obtained with our single-input BCC DEA. For the year 2020, the EEI for Hospital A is 0.164, compared to 0.179 for the aforementioned single-input model. For the year 2021, the EEI of Hospital B is 0.005 compared to 0.002 for the single-input model. Otherwise, the features already observed in this model are maintained in the two-input model. Both HA and HB show higher environmental efficiency in the pandemic than before it. The “pure” public hospital continues to appear to be the most environmentally efficient and is the only one that continues to improve its EEI in 2021. Indeed, the biggest difference between both hospitals is again in 2021. In sum, the addition of complexity-weighted discharges as input does not cause significant changes in the results of the BCC DEA.

Environmental efficiency indices of the hospitals based on the BCC model, when activity (weighted discharges) is added as input and the restricted multiplier model is used.
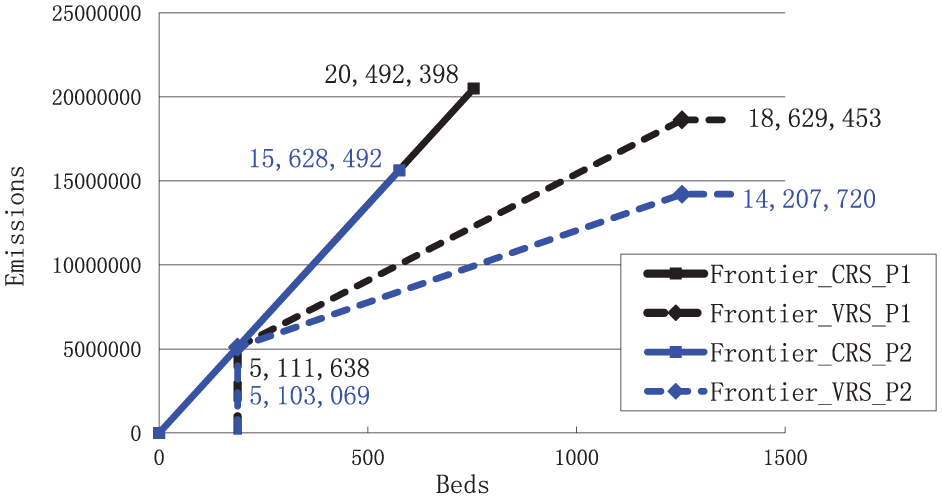
Figure 8 contains the cross-sectional frontiers of maximum emissions for 2019 (P1) and 2021 (P2). The CO2 emissions of each hospital are expressed as a function of the number of beds (left graph) and weighted discharges (right graph). The observed behavior is very similar to that shown in Figure 5. With variable returns to scale, the frontiers on the left and right graphs turn downwards in 2021 with respect to 2019. This implies lesser emissions in the second year of the pandemic than in the pre-pandemic period and reconfirms the improvement of environmental efficiency with the pandemic, attributable to hospital A.

Shifting of the maximum emissions frontier from 2019 (P1) to 2021 (P2) with respect to the number of beds and the weighted discharges.
Returning to the 3Y window model of our restricted multiplier DEA, we perform again the Fukushige and Miyara’s test with the following result:

Since ∣z∣ = 1.752 > zc = 1.645, the null hypothesis is rejected at 5% significance, which would constitute favorable evidence for the BCC model and, therefore, would reconfirm that “scale matters.”
Discussion
In this research, carbon footprint computation shows a share of Scopes 1 + 2 emissions that is higher than usual for healthcare settings. Whereas, in these, the kilograms of CO2 from emissions of such Scopes usually represent between 15% and 50% of the total (Rodríguez-Jiménez et al., 2023), in our Hospital A they represented 88% and in our Hospital B 76.8%. This was quite predictable because our study does not quantify Scope 3 emissions derived from mobility in HA or HB, nor does it measure emissions from solid urban waste management in HA. Judging by the figures for Hospital B, emissions from this waste management had a very small relative weight. However, emissions associated with mobility are likely to have had a large importance and, therefore, their exclusion constitutes a relevant limitation of our study.
Our research confirms the findings of previous studies suggesting that Scope 2 emissions, linked to electricity consumption, have a prominent share. Such was the case, for example, of the Universitas Airlangga Hospital, which was the largest contributor to its Universitas secondary emissions precisely because it had consumed the great amount of electricity, both before and during the pandemic (Hajjarianti et al., 2023). In the Erasmus University Medical Center, Scope 2 emissions accounted for the 23.1% of the CO2e kilotons emitted in 2021 (Lau et al., 2024). A similar behavior was shown from April 2010 to March 2021 by the Nagoya University Hospital, whose carbon emissions from electricity consumption amounted to 26% of total emissions, on average (Morooka et al., 2022). The higher relative weight of Scope 2 emissions in the hospitals that we studied admits two complementary explanations. The first lies in the limitations of our quantification of Scope 3 emissions, which raises the shares of Scope 1 and 2 emissions. The second explanation lies in the high variation that emissions from electricity consumption often have, both between hospitals and as a function of the national energy mix. Between the Swiss hospitals analyzed by Keller et al. (2021), for example, the climate impact for electricity ranged from 1% to 45% of the total, and the average share of electricity on total impact increased from 9% to 42% when, in the calculations, the Swiss electricity mix of the hospitals was replaced by the European electricity mix ENTSO-E. Despite all of the above, in 2021 the ratio of Scope 2 emissions to Scope 1 emissions at our two hospitals (1.7) was significantly lower than, for example, that of the Erasmus University Medical Center (4.8), which was very close in size to our Hospital A in terms of number of beds (Lau et al., 2024).
Overall, the pandemic was associated with a reduction in the carbon footprint, very strong in our pure public hospital and extremely weak in our PPP hospital. The slowdown in activity was also much more pronounced in the former hospital, whose weighted discharges fell by more than 2,000 in the year 2020, while those of the PPP hospital remained practically constant (even with a very slight increase). In HA, emissions from electricity consumption in 2021 were 26.8% less than in 2019, while in HB they barely fell by 4%. The drop occurred mainly in 2020, with HA’s electricity consumption emissions falling by 18.8% and HB’s by 6.6% (the latter hospital’s consumption even rebounded timidly in 2021). In the Spanish hospital studied by Jiménez-Lacarra et al. (2024), there was also a decrease in this type of consumption in 2020, although only by 2.8%. At Nagoya University Hospital, in contrast, the volume of electricity used increased by 1.9% in 2020 and, if CO2 emissions from this source decreased by 4%, it was only because the emission factor applied for its calculation fell from 0.000431 tCO2e/kWh in 2019 to 0.000406 tCO2e/kWh in 2020 (Morooka et al., 2022). The Universitas Airlangga Hospital, for its part, recorded an increase in secondary carbon emissions during the pandemic of no less than 25.9%, according to both the IPCC method and the UI GreenMetric calculation (Hajjarianti et al., 2023). The second major source of emissions in the hospitals in our study, which was natural gas consumption, decreased significantly in HA but increased steadily in HB. In 2020, such consumption fell by 20.1% in the first hospital while it grew by 4.3% in the second. HA’s result is in line with that obtained by Jiménez-Lacarra et al. (2024), who found an even greater drop (31.9%) in the hospital they analyzed. Nagoya University Hospital also reduced its gas consumption in 2020, but only by 0.8%, which did not allow Morooka et al. (2022) to speak of a statistically significant effect. From all of the above, it is clear that there is notable heterogeneity between hospitals in terms of the impact of the pandemic on their carbon footprints, which only seems to be partially explained by the behavior of conventional global activity indicators. If a global indicator of environmentally weighted discharges was available, there could be established between the hospitals’ activity changes caused by the pandemic and their carbon footprints a much more direct relationship, which would probably account for the heterogeneity found between hospitals.
Regarding the environmental efficiency of the two hospitals analyzed, our DEA-based indices show a much better performance in the pure public hospital than in the PPP one. Moreover, the gap between the two hospitals in environmental efficiency is attenuated but does not disappear when scale effects are considered and the volume of activity (weighted discharges) is added as an input in the DEA. This raises the suggestive question of whether the public/private dichotomy, even in an extenuated public/PPP version, matters in the management of a hospital’s CO2 emission sources. If we were to assume Le Grand’s (1991: 431) assertion that derived externalities occur in both public and private organizations, it could be argued that the latter tend to emit more CO2 because, in addition to their derived externalities, they generate fully-fledged externalities. In other words said, private organizations provoke both unpredicted or unpredictable carbon emissions (derived externalities) and carbon emissions incentivized by not being reflected in the private cost of the producer (proper externalities). The counterargument would be that also public organizations generate, in addition to CO2 emissions due to lack of foresight, emissions attributable to incentive problems. It has been pointed out, for example, that governments’ departmentalism and vertical silos can incentivize a “tunnel vision” that stresses departmental goals and leaves out the crosscutting eco-dimension (Pollitt, 2003; Soberón et al., 2020). It is worth asking, however, whether the tunnel vision is not even more acute in PPPs, whose property rights configurations typically lead to a narrowing of goals or failure to realize some of the putative goals of the public organization (Vining & Weimer, 2016).
During the pandemic, the two hospitals under study achieved higher scores in our DEA-based environmental efficiency measure, even when the global activity indicator was added and a restricted multiplier model was adopted. However, the scores achieved by the PPP hospital still continued to be negligible in the pandemic biennium, as such hospital remained close to its maximum emissions boundary. Consistently, the boundary of that hospital barely turns downward in 2021 with respect to 2019, while that of the pure public hospital clearly does. These results contrast with those obtained at two other recently analyzed hospitals. In the case of Nagoya University Hospital, the carbon footprint per hospital admission increased significantly between 2018 and 2020, passing from 0.24 to 0.26 tCO2e (Morooka et al., 2022). Also in the Spanish hospital researched by Jiménez-Lacarra et al. (2024), the ratio of the hospital’s environmental impact over its annual activity or “complexity unit” increased significantly in 2020 compared to 2019. Taking the global environmental impact, the increase was 17.2%, while if only the impact of “hospital activity” is considered, it was 44% (the latter excludes the impact derived from the transport of patients, employees and goods, which tended to decrease during the pandemic).
The contrast between these results, and between them and ours, admits some competing or even complementary explanations. One lies in the differences in the scope of emissions covered by each research and, particularly, in the unequal coverage of Scope 3 emissions. Another lies in the differences in the behavior of the activity indicators, either because of the diversity between indicators or between hospitals. Whilst Jiménez-Lacarra et al. (2024) did not provided data on their indicator, Morooka et al. (2022) found a 9.2% drop in their admission number from 2018 to 2020. In turn, our Hospital A’s weighted discharges only decreased by 5.1% in 2020 and then, in 2021, they exceeded the pre-pandemic figure by far. And our Hospital B’s weighted discharges even increased by 0.36% in 2020 and much more in 2021. It should be borne in mind that the higher the volume of activity, the lower the emissions per unit of activity for a given total emissions and, therefore, the higher the environmental efficiency. A third explanation for the diversity among hospitals (in terms of the impact of the pandemic on the carbon footprint) lies in the diversity of their activity structures and their roles in the face of the pandemic. The antagonistic forces resulting from the pandemic and noted in subsection 1.3, hospital anti-Covid-19 performances and setback in regular care, are likely to have had unequal relative weights across hospitals.
As for the pandemic time evolution, our results portray 2020 as the abrupt shock year and 2021 as the year of a shock attenuation (HA) or partial return to normalcy (HB). To our regret, we can hardly place this trait in the context of the reviewed empirical researches on the impact of the pandemic on the hospitals’ carbon footprint. Morooka et al. (2022) and Jiménez-Lacarra et al. (2024) only went as far as 2020 as the most recent year in their analyses. Hajjarianti et al. (2023) only distinguished between carbon footprints “before the Covid-19 pandemic” and “during the Covid-19 pandemic,” without any further clarification or disaggregation of the latter period. Lau et al. (2024) focused on the year 2021, but they did not include any previous or subsequent years, so it is not possible to draw insights from their work on the evolution from 1 year to the next during the pandemic. Only Di Russo et al. (2025) studied the annual evolution in the 2020 to 21 biennium, but limited to waste management. In 2020, the tCO2e produced by their Istituto Mediterraneo per i Trapianti e Terapie ad Alta Specializzazione’s waste management grew by 16.3%, relatively close to the 18.2% increase recorded at our Hospital B. And it is worth emphasizing that this increase in our hospital was almost exclusively due to the 272.5% rise in SBW waste, which was the category to which the Spanish Ministry of Health ascribed the waste generated in the care of Covid-19 patients (GE–MS (Gobierno de España – Ministerio de Sanidad), 2020: 11). However, in 2021 the Italian Istituto grew by 34.4% while the Spanish HB decreased by 5%. A partial return to normalcy seems thus to be observed in our HB, which, on the other hand, is not seen in the Italian hospital.
Our study certainly has several limitations. A fundamental one, which has already been pointed out, is the exclusion of emissions associated with mobility. Another is the availability of data for a single pre-pandemic year, rather than a multi-year baseline period. A third limitation, also attributable to the unavailability of data, is the focus on only two hospitals. A larger sample would have allowed us to take much more advantage of the potential of DEA and, by including a group of pure public hospitals and another group of PPP hospitals, would have allowed us to give a conclusive answer to the question of whether this difference affects the hospitals’ environmental efficiency.
Conclusions
This research aimed to measure the carbon footprint of two hospitals in the triennium 2019 to 21, analyze the relative importance of their various emission sources, and approximate the impact of the Covid-19 pandemic on their environmental efficiency relative to the carbon footprint. To our knowledge, this is the first study that combines CF computation and DEA to investigate the environmental efficiency of public hospitals before and during the pandemic. It is also the first to analyze the evolution of the global carbon footprint of entire hospitals in 2021 compared to 2020. We studied a big and purely public hospital (HA) and a smaller public hospital managed through a public-private partnership (HB).
Our results point to electricity consumption and natural gas as the main sources of emissions. The former accounted for 55.89% of total CO2 emissions in Hospital A and 48.41% in Hospital B, while the latter accounted for 28.89% and 26.41% of the respective hospitals’ emissions. Overall, the pandemic was associated with a reduction in the carbon footprint, very strong in the pure public hospital and extremely weak in the PPP hospital. Also the environmental efficiency showed a much better performance in the pure public hospital than in the PPP one, being the gap between them attenuated but not disappeared when scale effects and the volume of activity are considered. During the pandemic, the hospitals achieved a higher environmental efficiency, even when the global activity indicator was added as input and a restricted multiplier model was adopted. However, the scores achieved by the PPP hospital continued to be negligible in the pandemic biennium, as such hospital remained close to its maximum emissions boundary. Regarding the dynamics during the pandemics, 2020 appears as the abrupt shock year, and 2021 is the year of shock attenuation (HA) or partial return to normalcy (HB).
Our study has implications for both research and public policy. Regarding the former, it is evidenced the need to larger samples, longer series, and environmentally weighted activity indicators to determine: (1) to what extent the activity structure of the hospital explains the impact of a systemic shock on the hospital carbon footprint, and (2) whether the hospital’s public, private or hybrid nature matters. At the policy level, our analysis calls for extending to the evaluation and decision-making frameworks that the WHO (2016, p. 29) recommended in health research, namely, to treat environmental costs and benefits “as an outcome measure or a dimension of quality akin to access or equity.” It also calls for consideration of this environmental dimension in determining the scale of hospital care delivery and in deciding where on the public/private continuum to place each hospital. Finally, it suggests paying special attention to electricity and natural gas consumption as well as to emissions from building construction, which are the fundamental sources when emissions associated with mobility are abstracted.
Footnotes
Acknowledgements
In this section, you can acknowledge any support given that is not covered by the author contribution or funding sections. This may include administrative and technical support, or donations in kind (e.g., materials used for experiments).
Funding
The authors disclosed receipt of the following financial support for the research, authorship, and/or publication of this article: This work was supported by the Agrifood and Environmental Economics, Rural Development and Social Economy (ECOAGRASOC, from its Galician acronym) of the University of Santiago de Compostela, Spain.
Declaration of Conflicting Interests
The authors declared no potential conflicts of interest with respect to the research, authorship, and/or publication of this article.
Data Availability Statement
Our data is contained in the article itself and could be made available in a reusable format on request.