
Abstract
This study presents a thematic review of the direction of business performance metrics through a bibliometric analysis framework, employing novel methods to map the multi-dimensionality of research in this vital area. Utilizing the VosViewer tool for visualization and analysis and sourcing data from the Dimensions database, we cover an extensive period from 1965 to 2024. The study’s approach includes co-authorship analysis, citation analysis, and bibliographic coupling, offering a multifaceted view of the field’s research dynamics, key contributors, and thematic evolution. It identified significant trends, influential studies, and core themes that have shaped the discourse on business performance metrics through a comprehensive bibliometric analysis. By emphasizing the significance of KPIs, the study provides crucial insights into the historical evolution of research and emerging areas of interest, guiding directions for future investigation. This study serves as a crucial resource for scholars, practitioners, and policymakers seeking to deepen their understanding of business performance metrics and their impact on organizational success.
Plain Language Summary
This study explores how businesses measure their performance and how those measurements have changed over time. By analyzing published research from 1965 to 2024, the study identifies key trends, ideas, and tools that companies use to track their success. Using VOSviewer software and data from the Dimensions database, the researchers reviewed articles to see who is working together, which studies are most influential, and how the focus of research has shifted. Traditionally, businesses have relied heavily on financial data to measure success. However, this review shows a shift toward more holistic ways of evaluating performance. Today, businesses are looking at environmental impact, social responsibility, customer satisfaction, and internal processes in addition to profits. New tools and frameworks, like the Performance-Based Scorecard (PBSC) and Integrated Performance Measurement Framework (IPMF), are helping organizations track both short-term results and long-term goals using technologies such as real-time analytics and artificial intelligence (AI). The study also highlights the importance of global cooperation in shaping how business performance is measured. It points out that companies benefit from transparent and multi-dimensional performance metrics that improve internal decision-making and increase trust among customers and stakeholders. Looking ahead, future research should focus on developing tools that better measure sustainability and social impact. It should also explore how AI can support smarter business decisions. Studies that compare business practices across different
cultures and countries will be useful in designing flexible performance tools for global companies. In summary, businesses need better ways to measure success as the world changes. This study offers useful insights into how performance measurement is evolving and how companies can adapt to stay competitive and responsible in a fast-changing world.
Keywords
Introduction
Performance Measurement Systems (PMS) have changed dramatically in the corporate world, moving from basic financial measures to complex multi-dimensional frameworks which directly influences organizational success and strategic decision-making in the dynamic and ever-evolving world of business (Aripin & Yulianty, 2023; Dahal et al., 2020; He et al., 2020; Mahrinasari et al., 2021; Ojha et al., 2020; Tasheva & Nielsen, 2022). It is useful for improving operations, and being adaptable as an organization (Bititci et al., 1997; Henri, 2004). To assess how successfully an organization is accomplishing its aims and goals, PMS entails the methodical gathering and analysis of data (Chiesa et al., 2009; Frederico et al., 2021; Jardioui et al., 2020; Kgatle, 2020; Mustapha et al., 2017). Facilitating strategic planning, informed decision-making, and continual improvement are the main goals of putting in place an intense PMS (Aracıoğlu et al., 2013; Norlander & Varma, 2019; Rao, 2004; Yadav & Dabhade, 2013). Methodically examining the development and diversification of corporate performance measurements via bibliometric methodologies, this thematic study covers almost six decades of research (1965–2024). Its contextual to know how these indicators represent shifting business imperatives from profitability to stakeholder value, sustainability, and technology adaptation by following the evolution of PMS.
Profitability, cost management, and productivity measurements were the mainstays of traditional performance evaluation systems, which focused on financial indicators to represent the health of the firm. Business performance measures have seen notable changes, primarily due to technological developments, market conditions, and stakeholder expectations (Karki et al., 2024; Mallikarjunaradhya et al., 2023). In the 1980s and 1990s, frameworks such as the Balanced Scorecard brought a more balanced approach by including financial and non-financial measures, broadening this tight emphasis (Kaplan & Norton, 2000). This paradigm change was revolutionary because it recognized the importance of learning and development, internal processes, and customer viewpoints in measuring organizational success. In response to the increasing need for accountability beyond shareholder profit, PMS has been broadened via the wider use of stakeholder theory, which incorporates indicators of Corporate Social Responsibility (CSR), environmental impact, and ethical governance (Bititci et al., 1997; Freeman, 1984; Fuertes et al., 2020; Henri, 2004; Ittner et al., 2003; Sardi et al., 2023; Striteska & Spickova, 2012).
There has not been much systematic collection and theme analysis of PMS literature that covers both historical development and new trends, even if there have been significant breakthroughs. This research fills that need by doing a thorough bibliometric evaluation in the Dimensions database and analyzing and visualizing the results using VosViewer. To map important research, key contributors, and developing topics in the area, the methodology employs methods such as bibliographic coupling, co-authorship analysis, and citation analysis (Cruz Villazón et al., 2020; Tasheva & Nielsen, 2022). The study is guided by foundational studies, theoretical frameworks, and empirical results, this technique presents a comprehensive and multi-dimensional assessment of the research environment.
Personalizing performance measures guarantees conformity to industry standards and strategic objectives (Dahal, 2022; Frolick & Ariyachandra, 2006; Muller et al., 2005; Rajbhandari et al., 2020; Sardana et al., 2016). Clear objectives, pertinent KPI selection, data collecting and analysis procedures, and feedback loop implementation for continuous improvement are common elements of PMS (Bendoly et al., 2007; Dewangan & Godse, 2014). An organization’s culture of responsibility is fostered by effective PMS (Agrawal & Chauhan, 2023; Siti-Nabiha et al., 2023). Key Performance Indicators (KPIs) inside the PMS framework, including important measures like operational efficiency (S. S. Nudurupati et al., 2021; Vallurupalli & Bose, 2018), customer happiness, financial stability, and staff engagement, are the center of attention in this research. Employee engagement and growth are further supported by routine performance evaluations and feedback systems (Dahal et al., 2024; Joshi et al., 2023; Pitt & Tucker, 2008). The importance of KPIs in driving data-driven choices, strengthening organizational resilience, and ensuring that performance results are in line with changing business objectives is being recognized more and more (Ante et al., 2018; Franceschini et al., 2007).
This paper shows that modern PMS models put an emphasis on real-time monitoring, predictive analytics, and flexibility, which helps businesses to proactively handle performance issues (Gunasekaran et al., 2001; S. S. Nudurupati et al., 2021). This study puts contemporary and classic PMS theories in context within a unified review that traces the development and present status of the topic. This study shows a thorough analysis of how PMS has evolved to address the challenges of contemporary corporate settings by comparing and contrasting traditional ideas with current methods, such as data analytics and sustainability indicators (Henri, 2004; Striteska & Spickova, 2012). More important theoretical paradigms are illuminated by the theme analysis, which reveals both the continuity and novelty of PMS research. This stance shows the importance of PMS as a tool for strategy that goes beyond operational monitoring, encouraging a growth mindset and responsibility at every level of the business (Bendoly et al., 2007; Bhandari et al., 2021, Sardi et al., 2023).
The study’s general goal is to fill the observed research gaps and enhance the quality of PMS scholarship. Specifically thematic analysis aims to trace the development of PMS in business, taking trend of changes in emphasis, technique, and theoretical orientation as documented by Henri (2004) and Fuertes et al. (2020). The study shows the ability of PMS to adapt to the changing performance needs of organizations. Also, aims is to catalog the literature on corporate performance measurements and to critically examine its guiding principles, key figures, and theoretical frameworks. This involves classifying study groups, which shows how certain paradigms, including data analytics and PMS implementations (Franceschini et al., 2007; Kgatle, 2020). The purpose of this study is to provide light on how PMS may be better integrated into larger organizational and social initiatives via the use of metrics that are centered on stakeholders, digital transformation, and sustainability. According to Aripin and Yulianty (2023) and S. S. Nudurupati et al. (2021), PMS may improve strategic resilience and social responsibility, which is why this purpose highlights its importance.
With these goals accomplished, this study shows data-driven analysis that satisfies the academic and practical demands of those involved in company performance management, establishing itself as a vital resource for the advancement of PMS theory and practice. Despite extensive research on performance metrics, there is no systematic bibliometric analysis that maps the thematic evolution of this field over six decades, particularly in the context of emerging trends like sustainability and digital transformation. Existing reviews often focus on specific models (e.g., The Balance Scorecard) or timeframes, neglecting the holistic interplay between historical developments and contemporary innovations. This study addresses this gap by leveraging bibliometric methods to analyze 2500+ publications from 1965 to 2024, identifying key shifts from financial metrics to stakeholder-centric and technology-driven frameworks. By doing so, it provides a unified perspective on how PMS adapts to dynamic business imperatives. Therefore, this study is important for organizational effectiveness and future research base.
This paper is organized in the following sections: The study’s methodology is described in Section “Methodology,” and the statistical and citation analyses of the selected publications are covered in Section “Data Analysis.” The results and findings of the research on the unique characteristics of PMS are shown in Section “Results and Findings.” Section “Discussions and Key Learnings” discusses the results and key learnings, and section “Conclusions” summarizes the main conclusions and implications of the study project.
Methodology
There is an organized literature search process that includes using electronic databases and keeping track of backward and forward citations to make sure that all relevant literature on organizational performance metrics and thematic analysis techniques is included. The method used here follows standard procedures for systematic reviews, which help include a lot of different studies in the study’s scope (Booth et al., 2016).
Research Outline
The basic theories have helped shape this study explaining success measures, group behavior, and making smart decisions in business settings (Bhattarai et al., 2020). The study uses Contingency Theory, which says that measuring the success of a company cannot be done in a way that works for everyone (Otley, 2016). It is more efficient for performance systems to be customized to fit the specifics of the company, such as its size, structure, and working conditions (Vidal et al., 2017). This theory stresses how important it is for performance review systems to be able to change and adapt so that they work with both internal powers and market situations outside the company (Mahmud et al., 2021; Pang et al., 2020).
This study is also based on the Resource-Based View (RBV) idea. RBV says that an organization’s resources, like its people, technology, and secret information, are what give it a competitive edge and help it do better (Connor, 2002; Madhani, 2010). Over time, organizations can improve their performance by using resources that are valuable, rare, unique, and cannot be replaced (Boyd et al., 2010; Lubis, 2022). While this study is going on, RBV helps to show how performance metrics that focus on internal resources and skills (like employee performance data, technological infrastructure, and efforts to come up with new ideas) can be used to measure and improve business results (Armstrong & Shimizu, 2007; Srivastava et al., 2001).
Another important theory view used in this study is the Balanced Scorecard (BSC) system (Hansen & Schaltegger, 2016; Kumar et al., 2022). The BSC looks at groups from four different points of view: financial success, customer happiness, internal business processes, and learning and growth. This gives it a broad method to measuring performance (Hansen & Schaltegger, 2016; Karki et al., 2023). The BSC gives companies a fair picture of success by using both financial and non-financial measures. This helps them make sure that their strategies are in line with their long-term goals (Jassem et al., 2022; Yawson & Paros, 2023). This all-around method to performance management is especially useful for research that looks at how to combine old and new measures, like ESG and sustainability-related indicators (Betto et al., 2022). Theoretical basis shows operation companies create, use, and rate success measures that take into account internal strengths, outside forces, and new ways of doing things. The study uses these theories to look into how companies can use performance measurement systems to make better decisions, make sure their strategies are aligned, and have long-term success in a business world that is becoming more complicated and competitive.
To view empirical, Hasan et al. (2024) described research that uses business analytics and machine learning to predict employee performance. The study shows how this strategy improves talent management and resource allocation in firms by combining employee data with performance measures. Novirani et al. (2024) described collaborative performance assessment for fresh produce supply chains and suggested a lateral structure that blends vertical and horizontal partnerships. This methodology gives measures to meet objectives that are generally missed in standard collaborative settings, hence improving sector performance monitoring. Mahohoma (2024) described performance assessment in South African SMEs, comparing financial and non-financial indicators. According to the report, including both sets of indicators provides a more holistic perspective of SME performance, with bigger and older organizations benefiting more from this broad approach. Kaggwa et al. (2024) described how artificial intelligence is changing corporate strategies and decision-making by allowing firms to go beyond established paradigms. The study emphasized AI’s ability to improve company performance and support sustainable practices, establishing AI as a strategic asset in business progress. Finally, Prajapati et al. (2024) examined innovation measures for green business practices and provide a paradigm for balancing end-user goals with environmental advantages. They argue for long-term, comprehensive criteria to assess innovation effect, adding to the larger discourse about sustainable business practices.
Fleming and Harley (2023) examined the concept of collegiality as a form of control within neoliberal business schools, examining how “uncounted” work, such as peer reviews and mentorship, is sustained despite institutional emphasis on measurable achievements like high-impact publications. They argue that collegiality, while valuable, operates as “concretive control,” compelling academics to fulfill roles that are unquantified but essential for maintaining audit cultures in academia. Kurnia et al. (2024) explored the integration of Environmental, Social, and Governance (ESG) metrics into traditional accounting systems. This study delivered framework for incorporating ESG into financial reporting, analyzing its potential to enhance transparency, stakeholder engagement, and regulatory compliance, ultimately supporting sustainable business practices. Pan et al. (2024) applied the Decision-Making Trial and Evaluation Laboratory (DEMATEL) framework to examine supply chain resilience. By analyzing cause-and-effect relationships among performance metrics, they identify collaboration, flexibility, and information sharing as key drivers of resilience, offering a model for strategic resilience planning. Siamionava et al. (2024) focus on cognitive coordination within top management teams, particularly the role of IT and organizational metrics in fostering trust and shared understanding between CIOs and executives. Their multimethod study shows that using unit-specific IT metrics enhances trust, while broader organizational metrics facilitate a unified perspective on IT’s contribution to organizational goals. Finally, Geetha et al. (2024) propose circularity metrics for open innovation-enabled business models, introducing measurements that assess resource circulation, collaboration, and knowledge transfer. Their study links these metrics to financial performance, promoting a framework for evaluating business model circularity that encourages sustainable innovation and supports ethical consumption.
Even though the authors have built a strong base by reading a lot of literature, the paper would be better with more theme explanation and a stronger statement of the study gap. In Hasan et al. (2024) show a new way to use business analytics and machine learning to predict how well employees will do on the job. They show that this method is useful for improving talent management and resource allocation by using data to evaluate performance. To solve problems in the supply chain, Novirani et al. (2024) suggest a system for evaluating the success of joint teams in fresh produce supply chains that includes both vertical and horizontal partnerships. This special framework includes goals that are not always taken into account in regular working groups, which makes sector-specific performance reporting better. Mahohoma (2024) supports a balanced approach to evaluating performance in South African small and medium-sized businesses, showing that mixing financial and non-financial measures gives a more complete picture of SME performance, which is especially helpful for bigger and more established businesses. Kaggwa et al. (2024) look into how artificial intelligence can change corporate strategy and decision-making. They show how incorporating AI into strategic planning can help businesses grow and use sustainable practices. Prajapati et al. (2024) added to the discussion on sustainability by suggesting new ways to innovate that are specifically designed for green business practices. They stress the importance of long-term effect studies that balance the needs of consumers with the needs of the environment. These studies show that more research is needed that combines both old and new metrics in different types of organizations. This would give us a better picture of how well companies are doing in changing business environments.
For significant knowledge establishment, it significant to work into more depth about the research methods used in the studies that were talked about. Hasan et al. (2024), for example, used machine learning to predict how well employees would do on the job. This is helpful for dealing with big datasets, but it can be hard to make sure the models are correct and easy to understand. In the same way, Novirani et al. (2024) used a joint performance review for supply chains. The lateral structure of mixing vertical and horizontal partnerships can lead to new ideas, but it can be hard to put into practice in industries that are broken up. A more in-depth look at why these methods are good and bad would help us understand how well they work and how they relate to the research goals. This would also show us where better methods need to be used in the future (Fleming & Harley, 2023; Geetha et al., 2024; Ghimire & Karki, 2022; Hasan et al., 2024; Kaggwa et al., 2024; Mahohoma, 2024; Novirani et al., 2024; Prajapati et al., 2024; Pan et al., 2024; Siamionava et al., 2024).
Understanding the characteristics of PMS is the main focus of the research agenda. It becomes necessary to use a specific set of search keys to assist an efficient evaluation. According to Keong Choong’s (2013) technique, the chosen search keywords cover the fundamental idea of data.
Literature Search Criteria
The study employs a methodical approach to literature search, utilizing electronic database searches, backward and forward reference searches, ensuring inclusivity of all relevant papers (Eduardsen & Marinova, 2020). The study uses the dimensions of the bibliometric database, a well-known scholarly resource by Digital Science known for its comprehensive academic coverage and robust impact statistics (Thelwall, 2018). Dimensions, distinguished for its extensive journal coverage compared to Web of Science and Scopus, emerges as the optimal choice for bibliometric analysis (Thelwall, 2018). The study ensures thorough coverage (1965–2024) of relevant research by identifying essential business performance keywords and employing advanced search queries with VOSviewer, establishing the groundwork for insightful analysis and meaningful conclusions. The extended period (1965–2024) captures pivotal transitions: early financial-centric systems (1960s–1980s), the rise of multidimensional frameworks like the BSC (1990s–2000s), and recent integrations of sustainability and technology (2010s–present). This longitudinal approach enables a nuanced comprehension of PMS evolution. Furthermore, database choice (dimensions) was selected for its broader coverage of interdisciplinary sources, including gray literature, conference proceedings, and recent publications, compared to Web of Science or Scopus, which are more limited in scope. This ensures inclusivity of emerging trends and non-traditional research outputs.
Data Analysis
Data Extraction and Coding Process
The data extraction and coding process involved a meticulous screening and categorization approach to ensure relevance, accuracy, and comprehensiveness. First, articles were identified through a systematic search of academic databases, using keywords related to the study’s focus areas, such as “performance metrics,”“organizational behavior,”“business analytics,”“thematic analysis,” and “corporate sustainability.” After initial identification, titles and abstracts were screened to ensure that articles met the inclusion criteria, which included relevance to organizational performance, use of analytics, and focus on contemporary business environments. Articles that did not meet these criteria or were deemed too narrow or unrelated to the study’s main themes were excluded.
For articles that passed the preliminary screening, a full-text review was conducted. During this review, relevant data were extracted and coded based on a pre-defined coding framework. The coding framework was developed to capture both quantitative and qualitative aspects, such as the methodologies used, theoretical foundations, types of performance metrics analyzed, and major findings or implications. Each selected article was assigned a unique identifier, and information was extracted into a database under thematic categories like theoretical perspectives, innovation in metrics, and sustainability measures. The coding process was iterative; as new insights emerged, the coding framework was adjusted to capture additional themes, ensuring that all relevant aspects of the research question were covered.
Thematic Analysis Procedure
The thematic analysis followed a structured, multi-step approach to systematically identify, code, and categorize themes. The first step involved familiarization with the data, where researchers read and re-read articles to gain a comprehensive understanding of each study’s content and context. This process allowed for an initial identification of potential themes that frequently recurred, such as strategic alignment, resource-based perspectives, sustainability, and the role of technology in performance evaluation.
In the coding phase, researchers applied both inductive and deductive coding methods. Deductive codes were developed from the initial research objectives and theoretical frameworks (e.g., Balanced Scorecard, Resource-Based View), while inductive codes were created as new insights emerged. Each article was carefully examined, and relevant portions were coded according to these themes. Data were then organized into a coding matrix to facilitate comparison and highlight thematic overlaps or distinctions across studies.
Theme Development and Validation
Following coding, related codes were grouped together to form more comprehensive, overarching themes during the theme creation process. For example, the “Resource-Based View” theme was used to aggregate codes pertaining to “competitive advantage,”“internal resources,” and “employee performance.” This procedure assisted in condensing the substantial number of codes into categories that were manageable and consistent with the research goals. Multiple researchers independently evaluated and cross-checked the themes to confirm their validity and dependability. To address inter-rater reliability, statistical measures were implemented, and a systematic process for resolving disagreements was employed for consensus-building. To reach an agreement, disagreements over interpretation were aired and, if needed, corrected. Lastly, a peer debriefing procedure was used to further validate the themes’ validity. In order to improve the thematic analysis’s robustness, this phase included sharing the themes that were found with other scholars for their opinions on coherence and consistency.
Figure 1 shows this. First, a thorough literature search was done using specific terms such as “organizational performance,”“Balanced Scorecard,” and “sustainability in business.” Titles and summaries of relevant papers were read, with a focus on themes of corporate success, statistics, and sustainability. The full-text study was used to pull out data on methods, theoretical underpinnings, and results for theme analysis. The process of coding used both logical and deductive methods, with codes like “Sustainability,”“Employee Performance,” and “Resource-Based View.” Then, these codes were put together into bigger themes, like “Strategic Alignment,”“Innovation Metrics,” and “Environmental Practices,” which show the main ideas of the study. Lastly, independent reviews and peer feedback were used to make sure that all the themes were consistent and reliable. This strengthened the thematic framework and backed up the study’s results on business success measures.
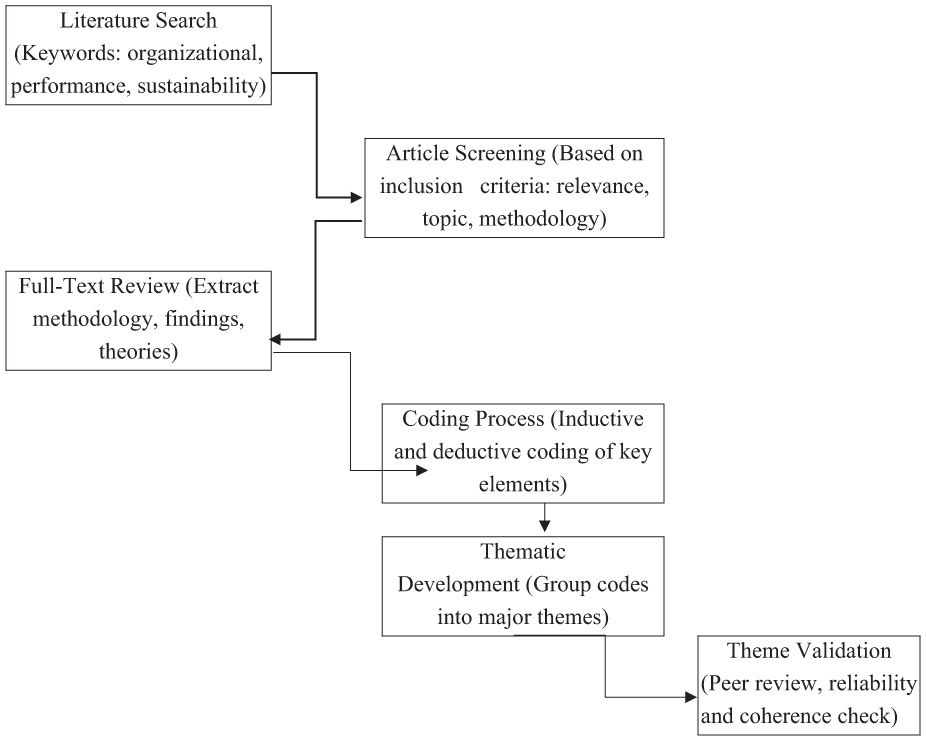
Thematic illustration.
Keywords for Article Search
To cover the whole range of relevant literature, a combination of general and particular keywords was utilized in the article search process. Keywords that have been used include “organizational performance,”“Balanced Scorecard,”“sustainability in business,”“performance evaluation,”“business analytics,”“strategic management,”“corporate sustainability,”“environmental, social, and governance (ESG),” and cultural “innovation metrics.” Researchers increased the scope and depth of the analysis by ensuring thorough coverage of relevant studies by applying these keywords across several databases. Using data taken from the Dimensions database spanning the years 1965 to 2024, the VosViewer tool was used to analyze the data on company performance parameters. This method gave insights into how firm performance assessment procedures have changed over almost 60 years by enabling a thorough analysis of research trends, partnerships, and seminal publications in the area.
Co-Authorship Analysis
This analysis explores the collaboration patterns among researchers studying business performance metrics. It helps us see which experts often work together and how their collective efforts contribute to our understanding of measuring and improving business performance. By mapping the network of co-authorships, we can identify influential groups and individuals driving the research forward on how firms can effectively track and enhance their operations.
Co-Authorship—Authors
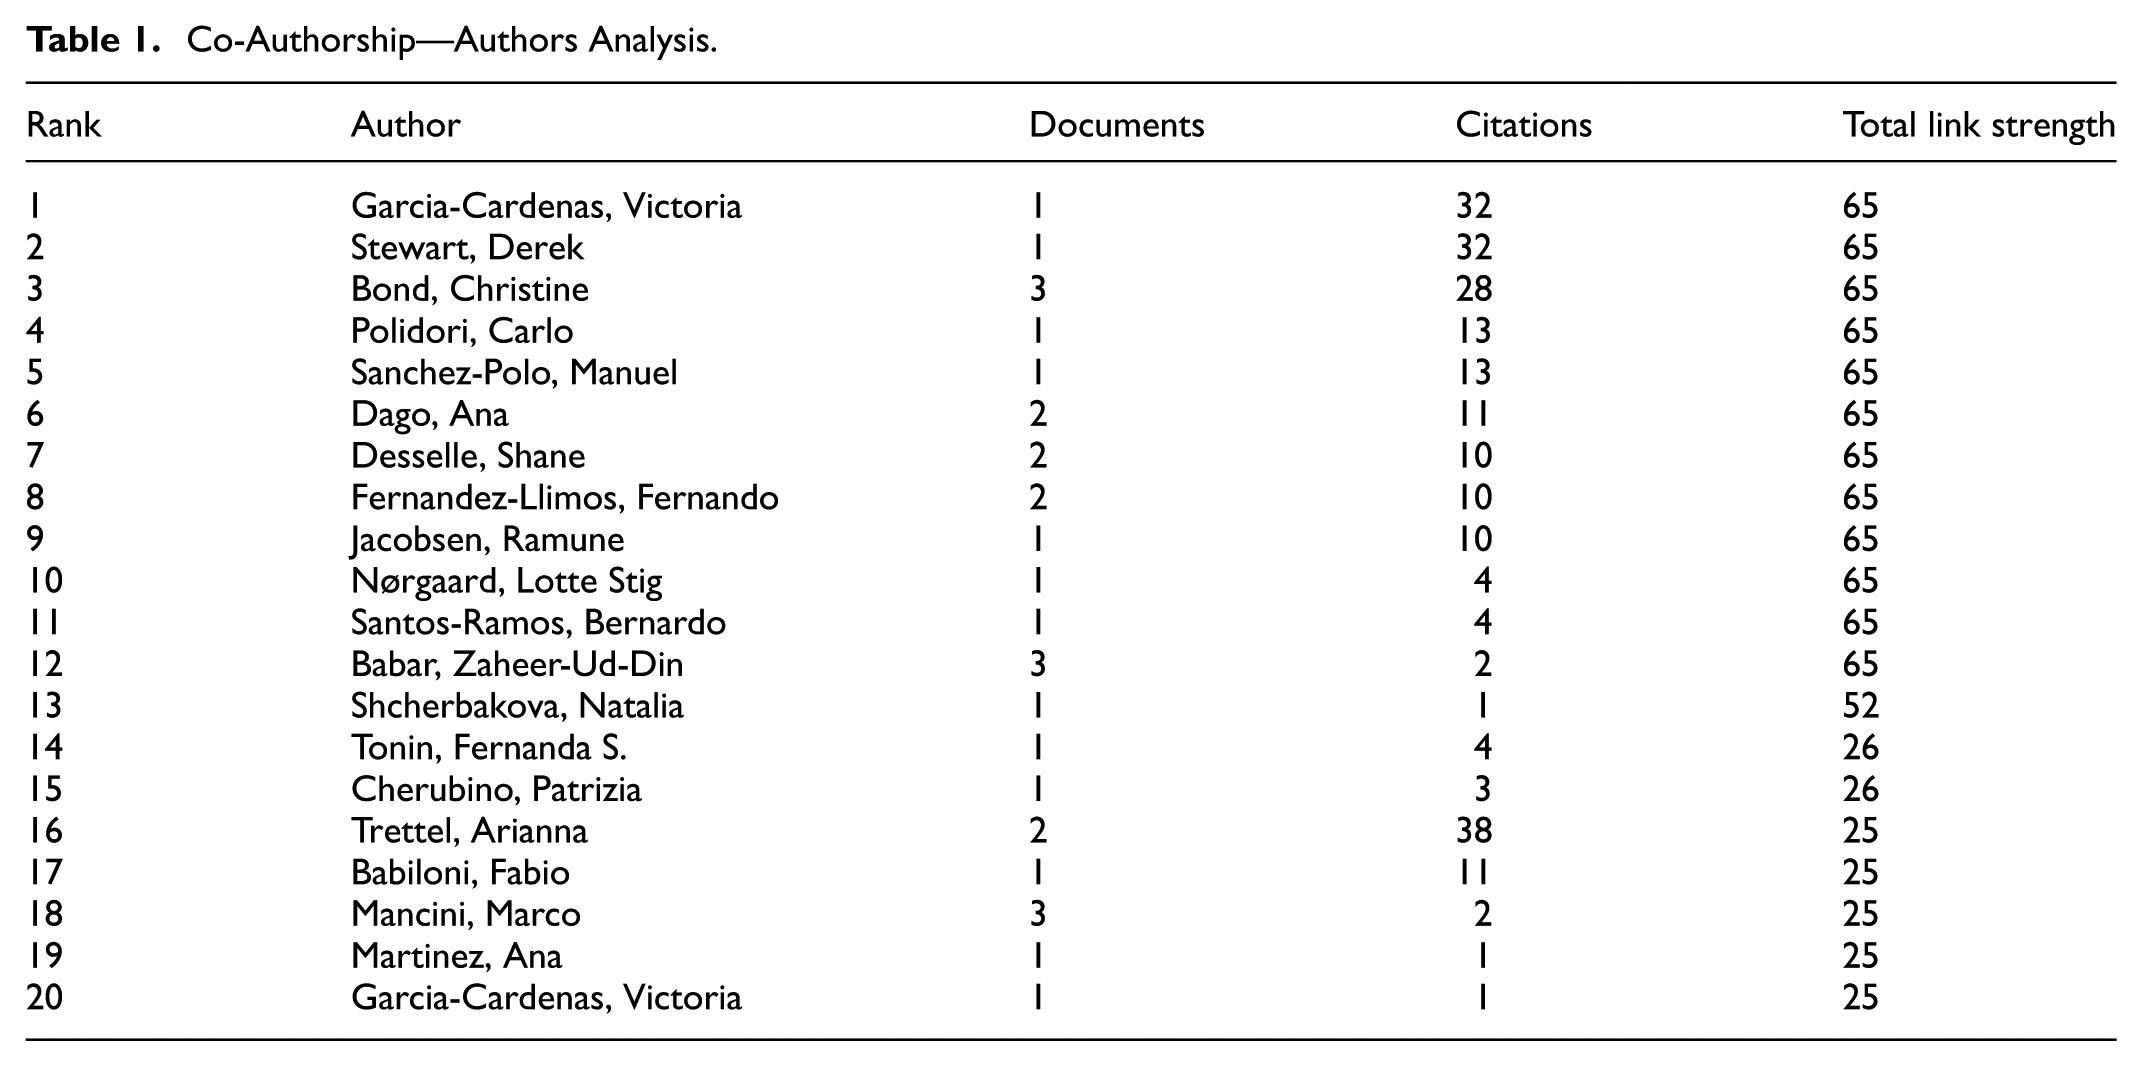
Co-authorship Authors’ analysis examines how often authors worked together on research papers from 1965 to 2024. We chose authors who have written with up to 25 different co-authors, have at least one paper published, and have their work cited at least once. Out of these, we picked 1,000 authors and then narrowed it down to the top 20 (for tabulation) with the highest total link strength, citations, and papers. Table 1 and Figure 2 illustrate the main contributors in this field, highlighting the researchers whose work has been most recognized and who have collaborated extensively with others over nearly 60 years.
Co-Authorship—Authors Analysis.

Bibliometric map of co-authorship authors from VosViewer using author names.
Co-Authorship—Organizations
This co-authorship analysis focuses on organizations involved in research from 1965 to 2024. The criteria include choosing organizations mentioned in documents with up to 25 different organizations, having at least one document published, and receiving at least one citation. From a pool, we selected 1,000 organizations based on these criteria. We then illustrated the top 20 organizations with the highest total link strength, publications, and citations (Table 2 and Figure 3). This approach helps highlight the leading institutions that contribute significantly to research output and have their work widely recognized and cited in the academic community. It showcases the organizations that play crucial roles in advancing knowledge and collaboration in their respective fields over nearly six decades.
Co-Authorship—Organizations Analysis.


Bibliometric map of co-authorship organizations using organizations names.
Co-Authorship—Countries
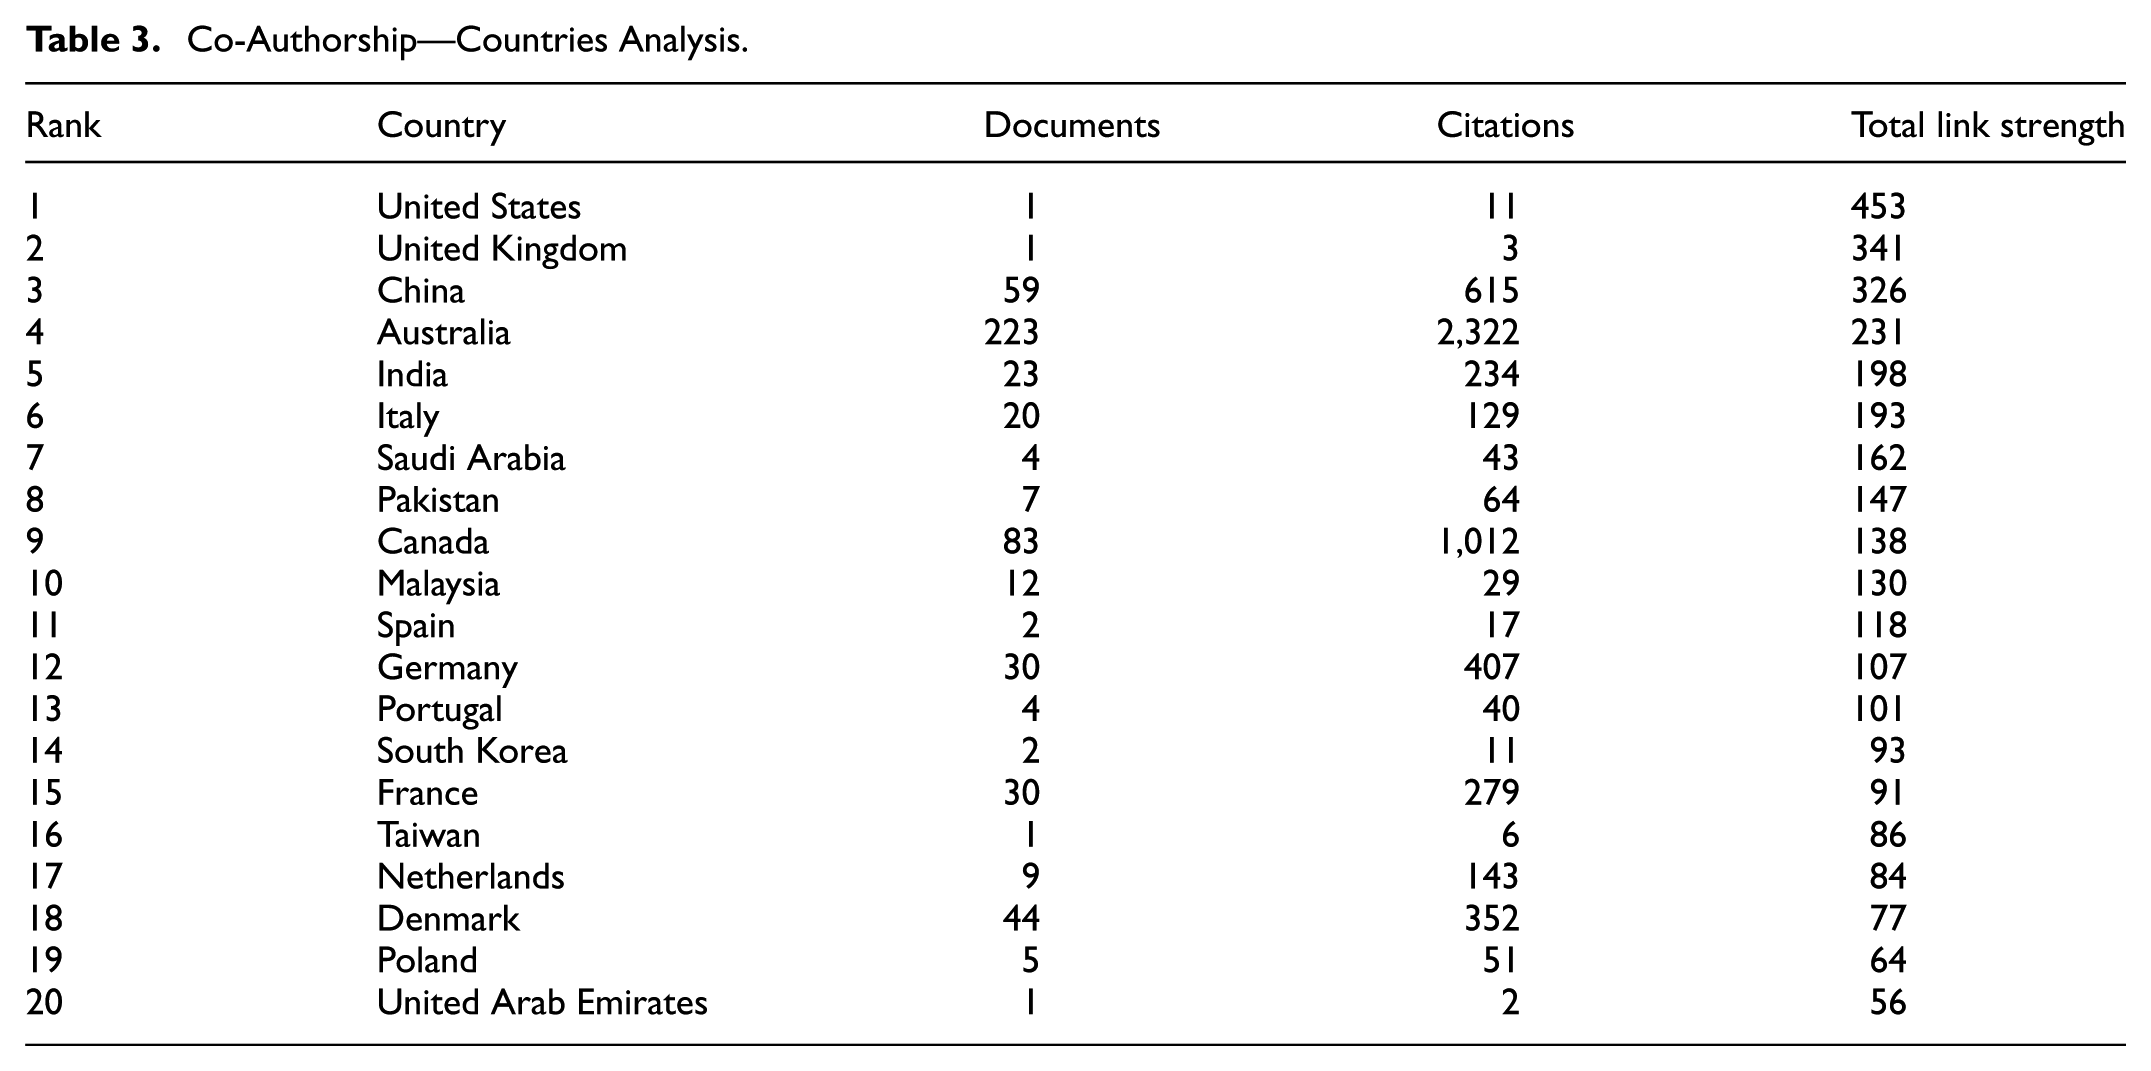
This co-authorship analysis examines the collaboration between countries in research from 1965 to 2024. We looked for research documents that included up to 25 different countries, ensuring that each country had contributed to at least one published document and received at least one citation. From the data, 96 countries were selected based on these criteria. Among these, the top 20 countries with the highest total link strength, number of publications, and citations were identified (Table 3 and Figure 4). This method highlights the countries that are leading in research contributions and influence, showing which nations have had the most significant impact and collaboration in the global academic community over the last nearly six decades. It provides insight into the global network of scholarly work and the key players within it.
Co-Authorship—Countries Analysis.
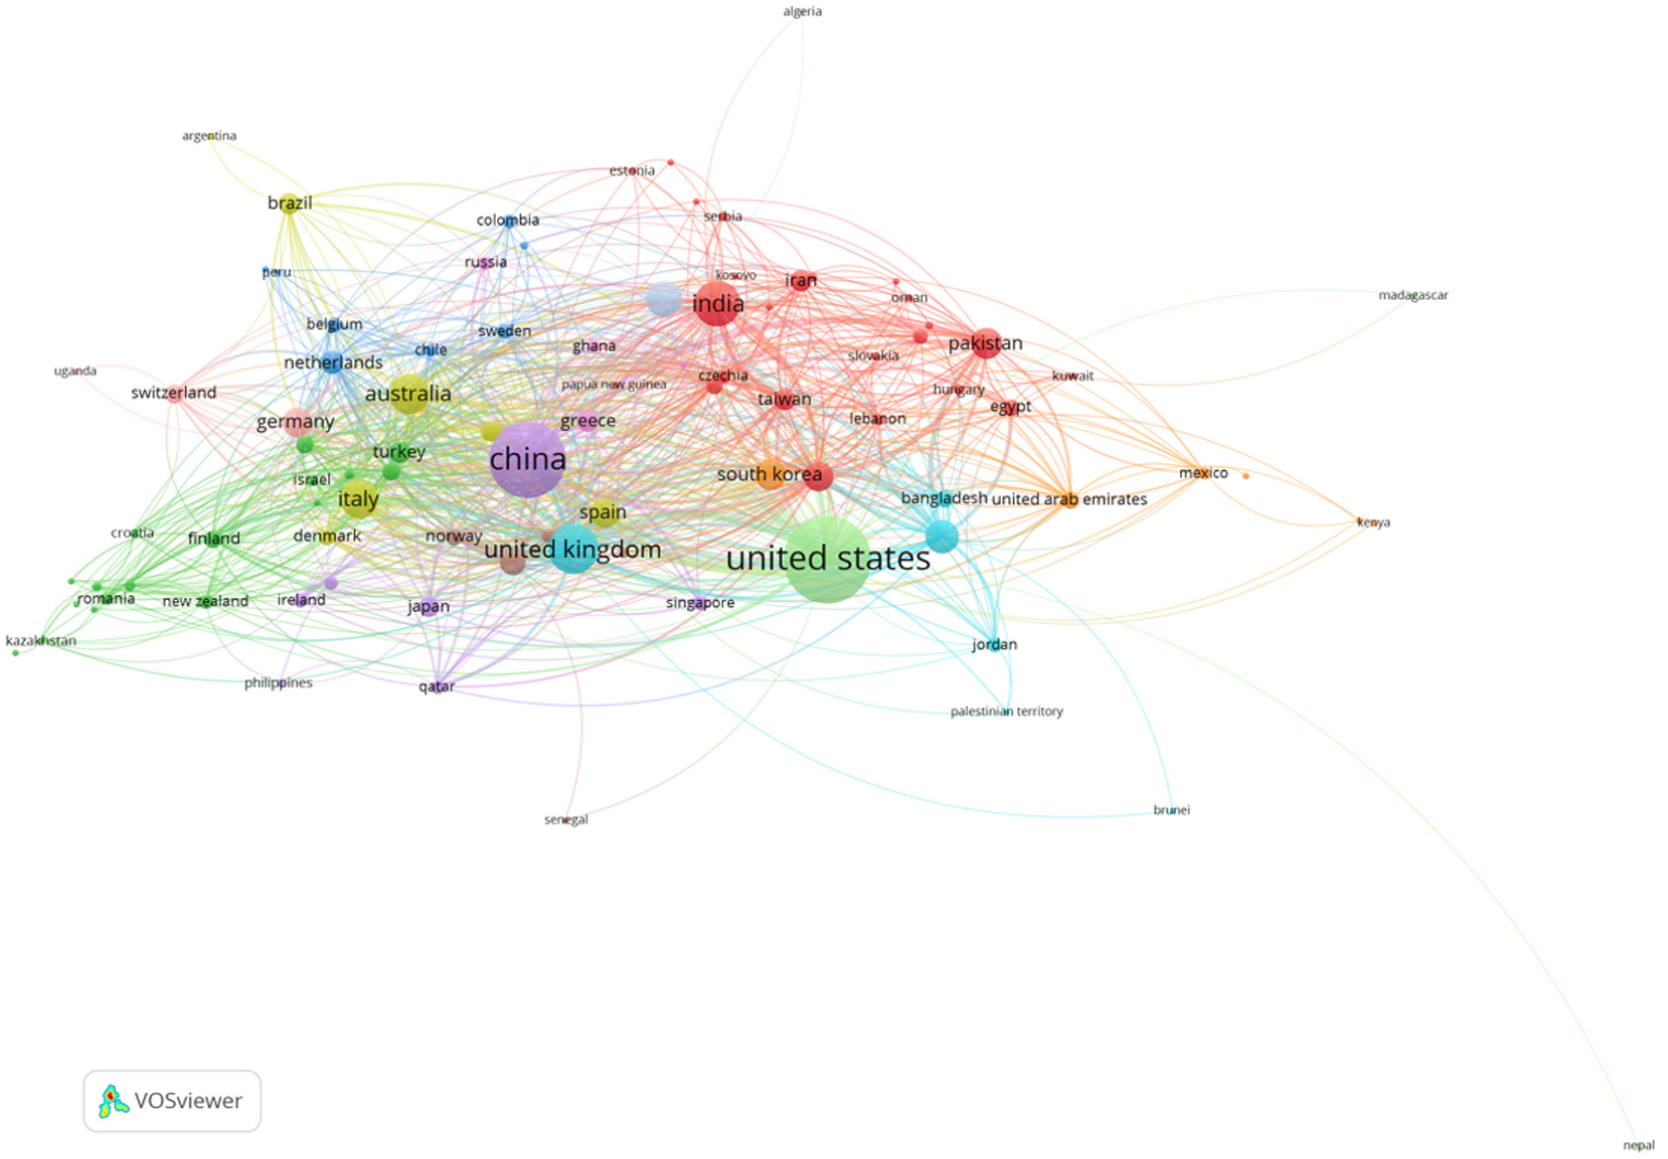
Bibliometric map of co-authorship countries using country names.
Citation Analysis
Citation analysis in the context of business performance metrics allows us to identify the most influential studies and authors in the field. By counting how often others cite research, we get a clear picture of which concepts, tools, and methodologies shape how businesses evaluate their success. This analysis highlights the key contributors whose work has significantly impacted how organizations measure and interpret their performance.
Citation Analysis—Authors
This citation analysis delves into the impact of the authors’ work from 1965 to 2024. It focuses on authors who have contributed to documents with up to 25 co-authors, ensuring that each author has at least one published document and has received at least one citation. A total of 1,000 authors were initially selected based on these criteria. This group identified the top 20 authors with the highest citations and publications (Table 4 and Figure 5). This analysis aims to recognize those authors whose contributions have been most influential and widely acknowledged in their field. It sheds light on the individuals who have not only been productive in their output but whose work has gained significant attention and respect within the academic and research communities over nearly sixty years.
Citation Analysis—Authors.


Bibliometric map of citation analysis (authors) using author’ names.
Citation Analysis—Organizations
This citation analysis described the impact of organizations in academic research from 1965 to 2024. It focuses on papers that include contributions from up to 25 different organizations, with each organization involved in at least one published document and receiving at least one citation. From a broad selection, 1,000 organizations were chosen based on these criteria. The analysis then identifies the top 20 organizations with the highest total link strength and given citations and publications (Table 5 and Figure 6). This method highlights the organizations leading in research output and influence, showing which institutions have made significant contributions to their fields and have had their work widely recognized and referenced in the academic community over the past nearly six decades.
Citation Analysis—Organizations.

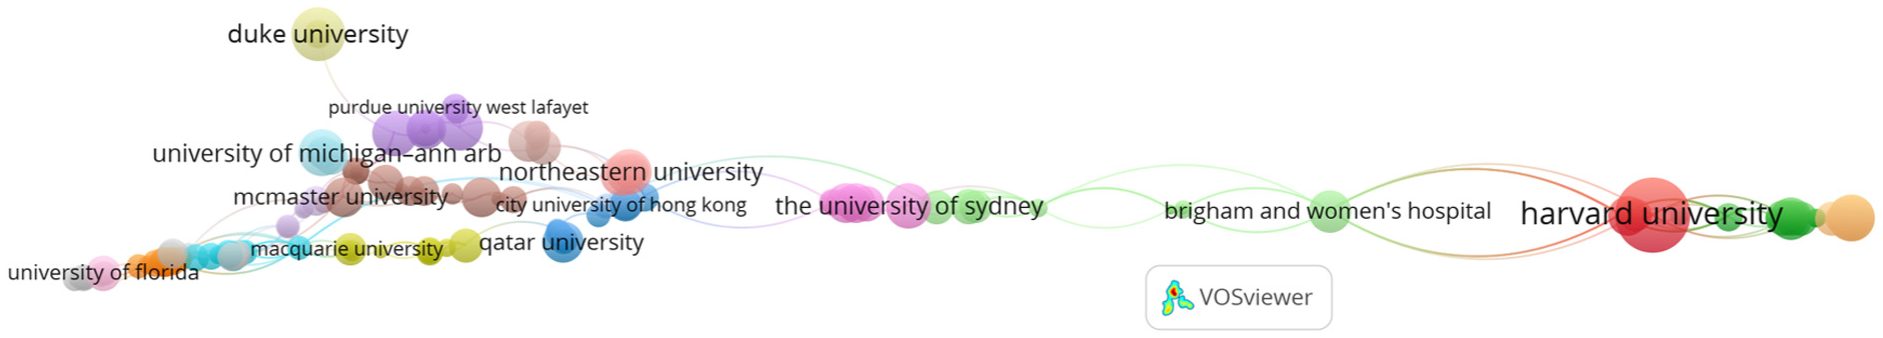
Bibliometric map of citation analysis (organizations) using organization’ names.
Citation Analysis—Countries
This citation analysis looked at research from 1965 to 2024 to see which countries are most influential in academic studies. It checked papers that involved up to 25 countries, making sure each country had at least one paper published and one citation. Although the map reflects data from 96 countries, we focused on finding the top 20 countries with the highest total link strength, papers and citations (Table 6 and Figure 7). This shows us which countries are leading in research, having their work recognized and used by others around the world. It highlights the big players in global academic research over nearly 60 years.
Citation Analysis—Countries.
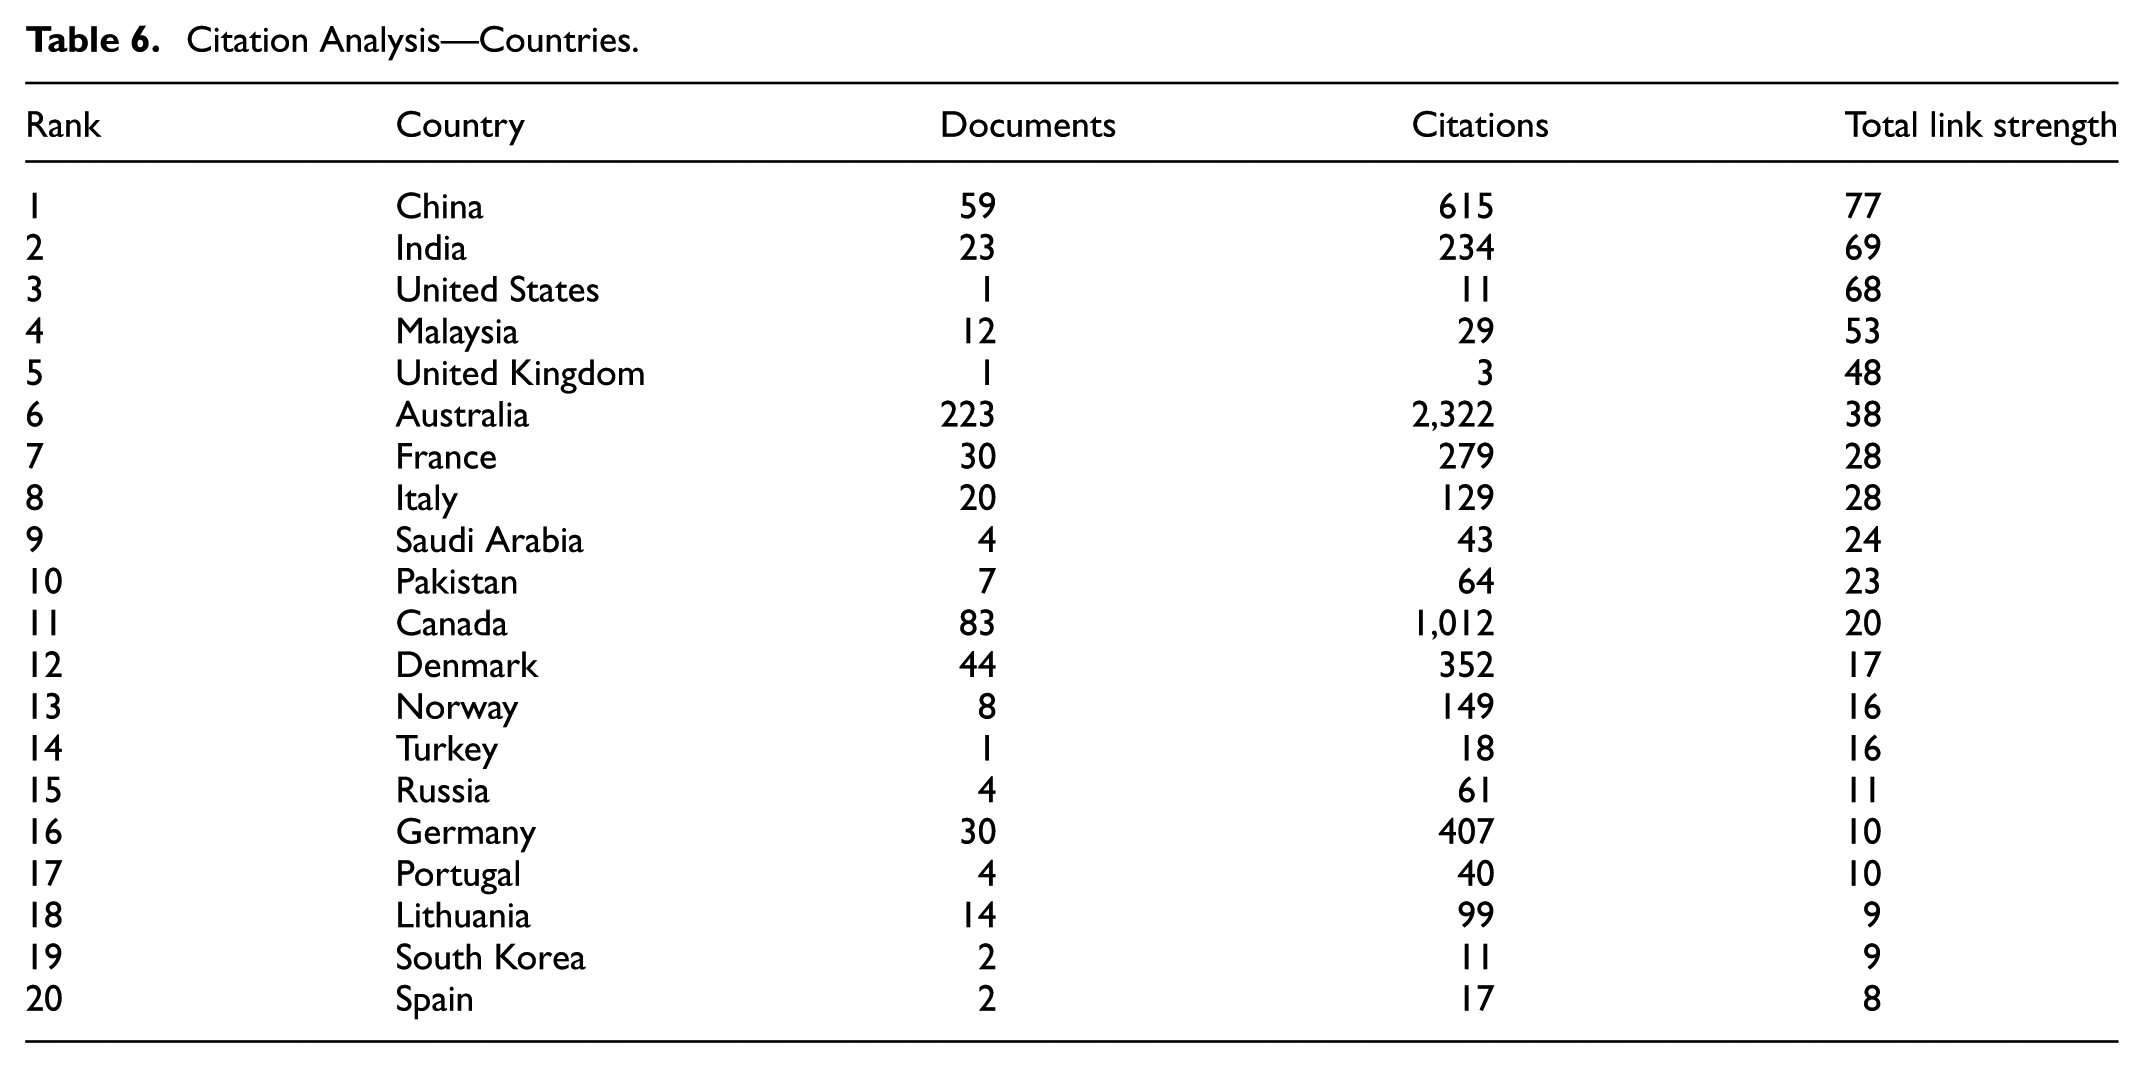

Bibliometric map of citation analysis—countries from VosViewer using country’ names.
Bibliographic Coupling
Bibliographic coupling within business performance metrics reveals how different studies are related through their references to common foundational work. This analysis uncovers the thematic connections between research papers, even if the authors have not directly collaborated. It helps us understand the evolving landscape of business performance measurement by showing which topics are frequently explored together and how new insights build on established knowledge.
Bibliographic Coupling—Authors
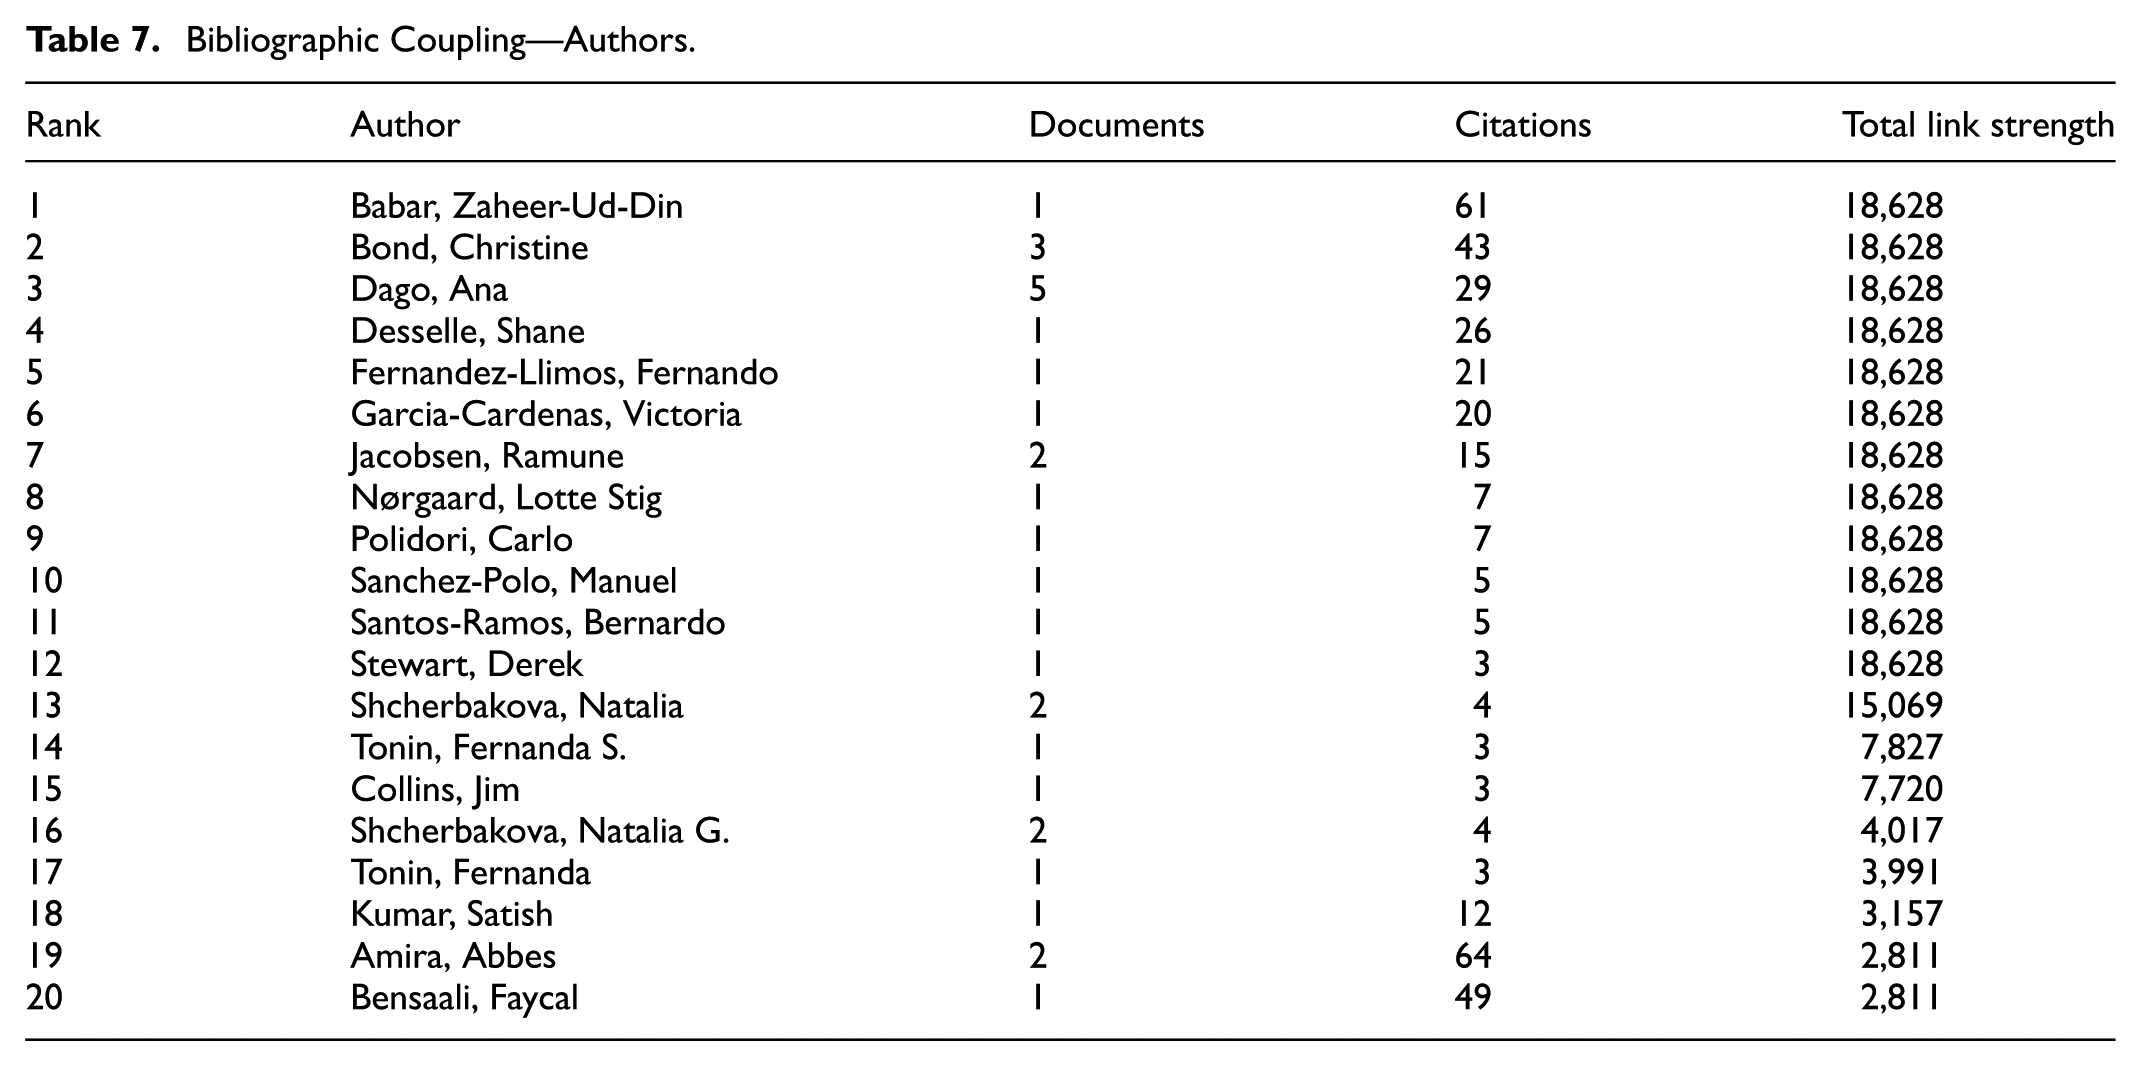
This bibliographic coupling analysis examines the relationships between authors in academic research from 1965 to 2024. It looks at papers with up to 25 authors, selecting those with at least one published document and receiving at least one citation. From this, 1,000 authors were initially chosen based on these criteria. The focus shifted to identifying the top 20 authors with the highest total link strength, publications, and citations (Table 7 and Figure 8).
Bibliographic Coupling—Authors.
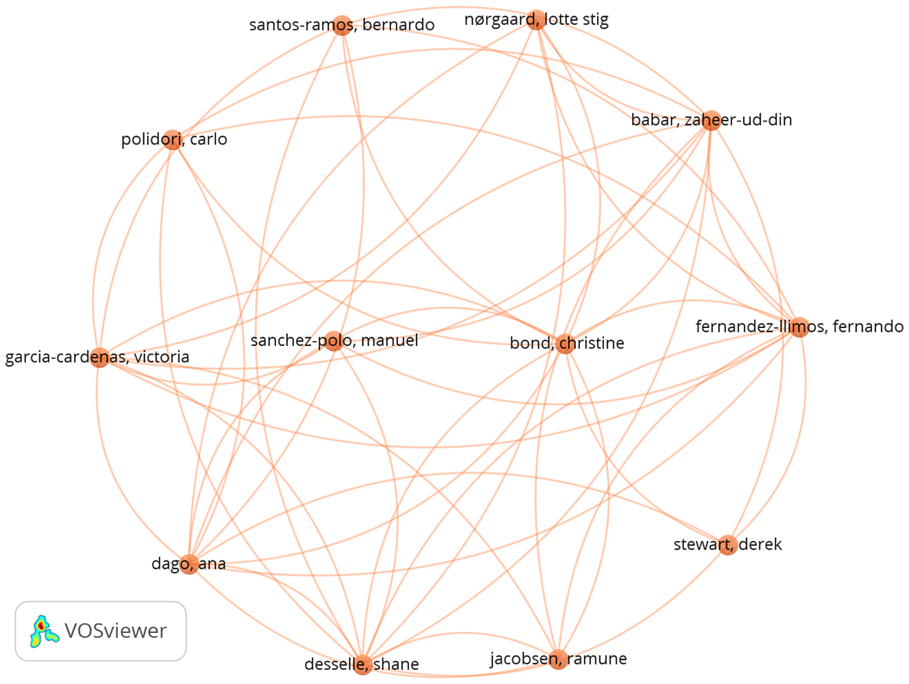
Bibliometric map of bibliographic coupling (authors) using author’ names.
Bibliographic Coupling—Organizations
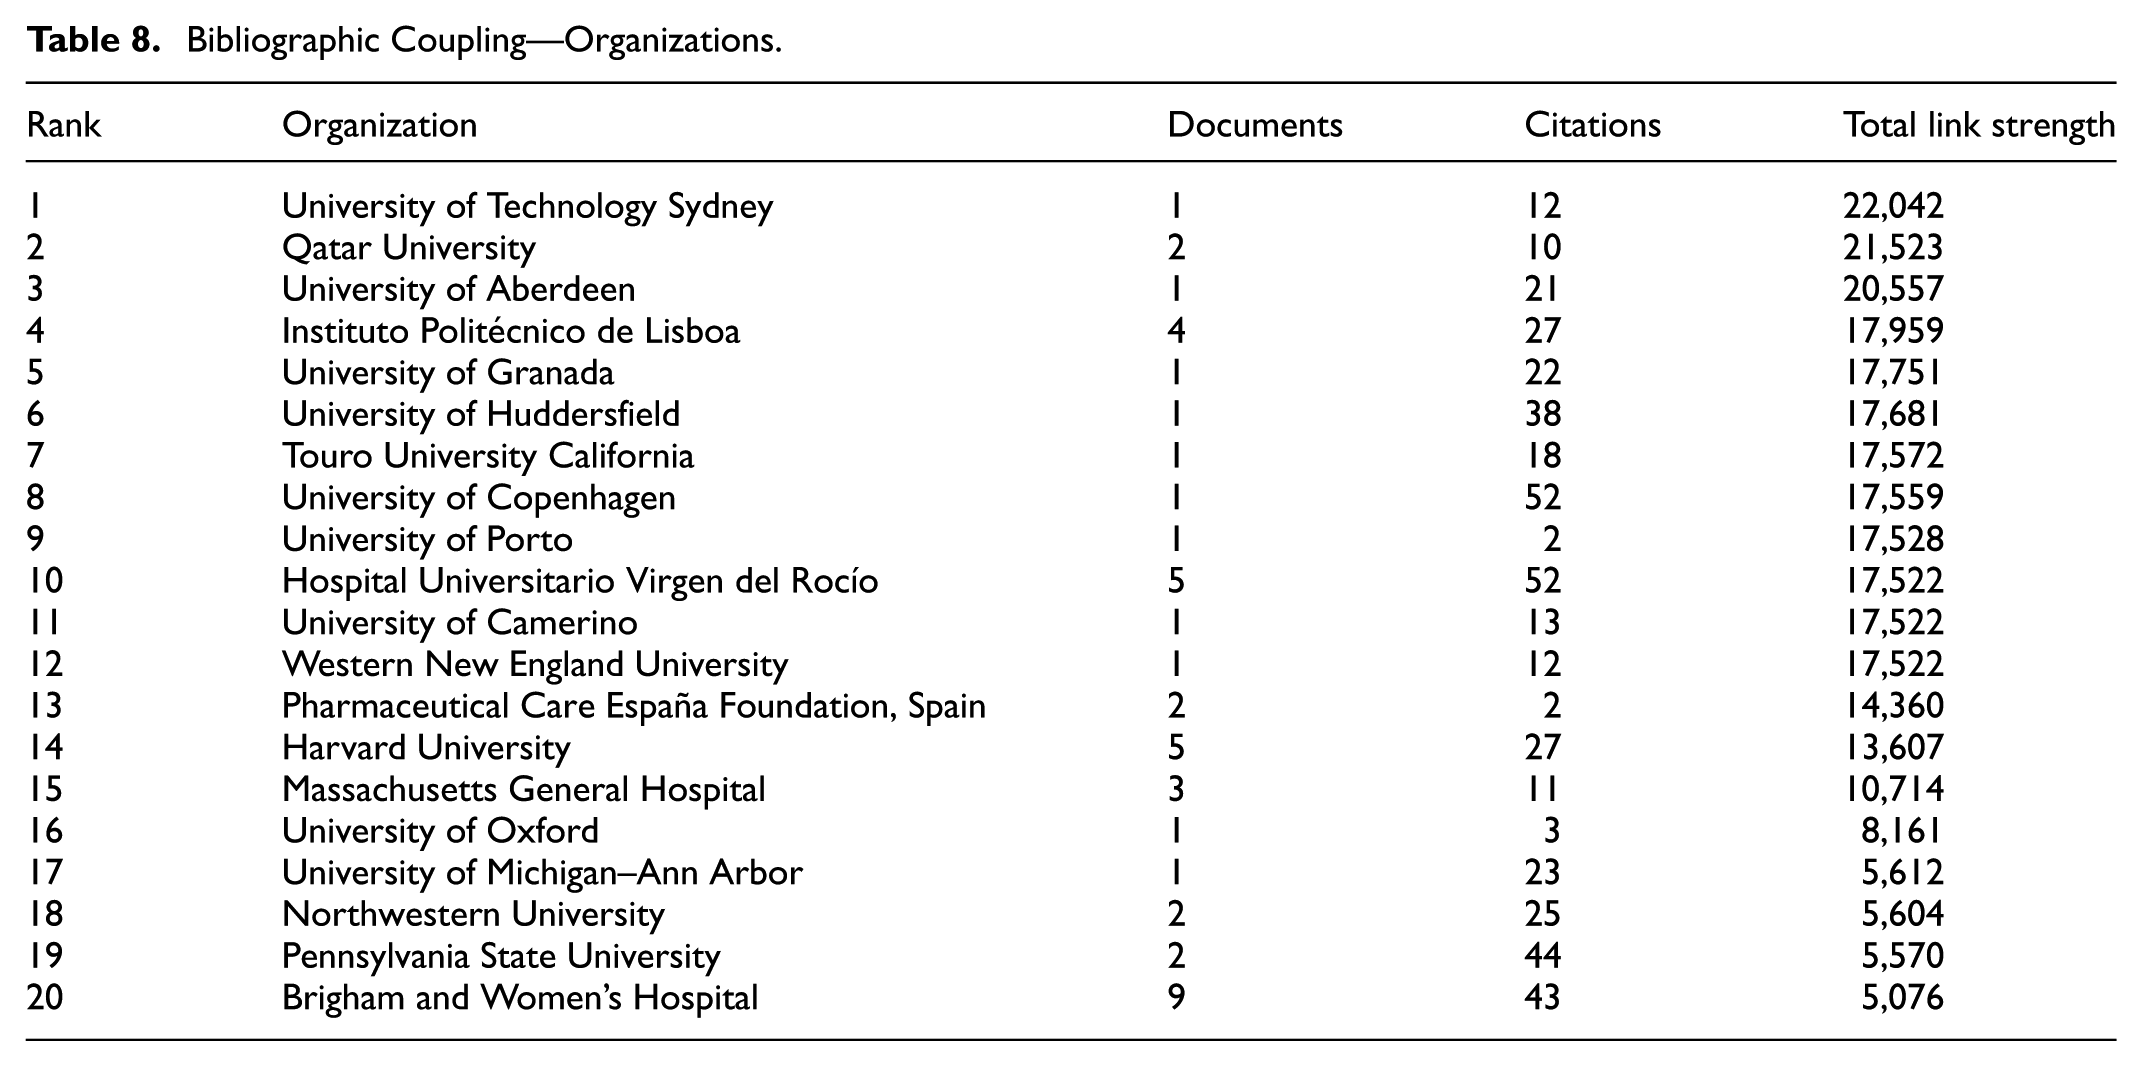
This analysis examined how research groups from different organizations are connected through their studies from 1965 to 2024. Checking up to 25 organizations in each paper made sure each one had at least one paper and one citation. Out of 1,000 organizations, it found the top 20 with the highest total link strength, papers, and citations (Table 8 and Figure 9). This method shows which organizations often work on similar topics or use similar studies in their research, pointing out the big players in research who frequently share knowledge and ideas across their fields.
Bibliographic Coupling—Organizations.

Bibliometric map of bibliographic coupling (organizations) using organization’ names.
Bibliographic Coupling—Countries
This analysis examines how countries are linked in their research efforts from 1965 to 2024. It looks at papers with up to 25 countries mentioned, ensuring each country has contributed to at least one paper and received at least one citation. The top 20 countries with the most papers and citations were chosen from a large initial selection (Table 9 and Figure 10). This approach helps identify which countries often collaborate or focus on similar research areas, highlighting the leading nations in global research networks. It shows us the key players in the academic world who are most connected through shared studies and contributions over nearly six decades.
Bibliographic Coupling—Countries.


Bibliometric map of bibliographic coupling (countries) using country’ names.
Results and Findings
Analyzing business performance metrics using co-authorship, citation, and bibliographic coupling reveals a rich web of research collaboration and influence. Co-authorship shows us the critical partnerships in the field, highlighting how experts work together to advance our understanding of measuring business success. Citation analysis points out the most influential studies, telling us which ideas have shaped the field the most. Bibliographic coupling uncovers connections between studies, showing us how various research topics are related. Together, these analyses paint a picture of a vibrant research community focused on developing and refining ways to assess and improve business performance, with a growing interest in sustainability and technology. The following section presents results and analysis of findings concerning the features of PMS.
Clarification of Measurement and Performance Measurement
According to the results, measuring and performance measurement emerged as critical instruments that directly contribute to identifying areas for improvement and directing strategic decision-making. Participants in this research saw measurement as a tool for evaluating performance and an essential step in verifying strategy alignment throughout the company. This finding supports Echtner & Ritchie’s (1991) and Mari et al.’s (2021) views of measurement as critical for trustworthy decision-making, expanding Gunasekaran and Kobu’s (2007) claim that giving numerical values improves communication and comparability. This research demonstrates that workers and management value qualitative evaluations for capturing features not represented in pure statistics, contradicting the conventional dependence on quantitative measurements alone. This shows that combining subjective assessments with quantitative metrics might give a more comprehensive organizational effectiveness perspective, in line with Singh et al. (2016).
Unlike conventional viewpoints, participants noted that performance assessment often failed to capture dynamic, real-time changes in organizational performance, especially in quickly changing market situations. This shows that, although traditional measuring frameworks are helpful, they may need modification to stay relevant in dynamic situations. These results underscore the need for adaptive measuring systems that mix quantitative and qualitative data to suit shifting organizational goals. Organizations may benefit from training programs that teach personnel to balance objective and subjective metrics to guarantee a thorough review.
Performance Measurement Systems (PMSs)
This research supports the important role of PMSs in modern management, echoing Asiaei and Bontis (2020) and Keong Choong (2013) by emphasizing the need for systematic monitoring and improvement of performance metrics. Many participants said that PMSs helped them understand their role in attaining corporate goals, highlighting the systems’ significance in linking individual performance with strategic objectives.
One major takeaway was that, although systems such as the KPI Tree and Balanced Scorecard were valued, workers often saw these tools too focused on financial success. There was a request for additional non-financial measurements, implying that current PMSs may need to be modified to successfully balance economic and non-financial performance indicators.
Interestingly, the findings show that, although workers recognize the benefits of PMSs, they prefer to depend mainly on previous performance measurements rather than forward-looking indications. This shows a disconnect between PMSs’ theoretical capacity for strategic alignment and their emphasis on historical data. Organizations may want to improve their PMSs by including more forward-looking indicators and a mix of financial and non-financial measures. Enhanced training on the strategic use of PMSs might enable staff to utilize these systems to make more proactive decisions.
BSC
The results of the analysis show that the BSC efficiently connects financial and non-financial performance, validating Kaplan and Norton’s (2006) approach. Employees said BSC increased strategic visibility by integrating everyday activities with more significant corporate objectives, demonstrating its value as a strategic management tool. One important finding was the BSC’s efficacy in fostering goal congruence across departments. However, participants reported a lack of flexibility in adjusting to quick changes, which aligns with Chytas et al. (2011)’s need for proactive modifications within performance frameworks.
Participants discovered that, although BSC is useful in stable conditions, it is less successful in situations needing quick adjustment. This gap shows that a more adaptable, responsive version of the BSC is required to assist the transition to Proactive Balanced Scorecard (PBSC) models that can accept real-time strategy alterations. To promote flexibility, businesses may employ a PBSC strategy that includes scenario planning and forward-looking risk assessments to preserve strategic alignment in changing settings. Employees who get adaptive BSC training may be better equipped to use it as a more flexible strategic tool. Therefore, the BSC’s evolution from a static strategic tool to a dynamic framework reflects the growing emphasis on adaptability in performance measurement. Early applications focused on financial-customer-process-learning linkages, while contemporary adaptations emphasized external shocks and predictive analytics. This shift reflects broader theoretical transitions from contingency theory (Otley, 2016) to dynamic capabilities (Teece, 2018), where adaptability is central to performance measurement.
Consistent Performance Management System (CPMS)
This research supports CPMS as a key method for employee performance development, in line with Cokins (2004) and Suša Vugec et al. (2019). Participants identified clear expectations and constant feedback as essential components of their CPMS experience, which aligns with Aguinis’ (2019) emphasis on continual communication for performance management. While CPMS is intended to produce a uniform performance review process, workers believe it may benefit from more personalized measurements for various jobs, implying that “one-size-fits-all” metrics may be constraining. Our results contradict theoretical models that promote a uniform approach, indicating that workers prefer flexibility within a CPMS. This difference suggests that businesses may need to alter CPMS to accommodate varied responsibilities while remaining consistent with overall performance goals. To improve CPMS, companies may consider using customized performance indicators that reflect the specific needs of certain positions. Training managers to adjust performance targets while maintaining consistency might result in more effective performance reviews.
Integrated Dynamic Performance Measurement System (IDPMS)
The findings we obtained show the IDPMS as a flexible and comprehensive approach to organizational performance, as proposed by Rouse and Putterill (2003). Employees praised IDPMS’s responsiveness to changing organizational demands, agreeing with Bulsara et al. (2014) about its function in accommodating varied performance characteristics. Participants highlighted that IDPMS’s integration of numerous indicators provided a wider perspective of organizational health and enabled real-time modifications. This validates its applicability in dynamic contexts and supports Kurien and Qureshi’s (2011) stance on the advantages of an integrated strategy. While IDPMS theoretically allows for dynamic evaluation, participants found that real-time data interpretation was problematic. This shows a possible gap in actual implementation, which might be caused by technological limits or data analysis skill shortages. Organizations might improve IDPMS by investing in real-time data analytics technologies and educating personnel on how to read dynamic measurements correctly. This might allow for a more dynamic approach to performance management, resulting in better alignment with business goals.
Dynamic Performance Measurement System (DPMS)
This research supports DPMS as an adaptive tool, consistent with De Lacerda Arpini and Dutra’s (2021) focus on real-time monitoring and rapid decision-making. Employees valued DPMS’s flexibility and real-time information, allowing swift reactions to developing opportunities and problems. While DPMS enabled speedy adaptability, not all staff felt prepared to comprehend dynamic data. This is consistent with S. Nudurupati et al. (2018), who emphasize the relevance of training in dynamic performance systems. In contrast to established models that rely on steady measures, DPMS was recognized for its agility. Employees did, however, underline the need for additional user-friendly tools to assist real-time data interpretation. Organizations may benefit from more intuitive DPMS interfaces and continual training to guarantee that staff can use real-time data for strategic insights. This might increase the practical use of DPMS in agile decision-making scenarios.
European Foundation for Quality Management (EFQM) Excellence Model
These results support the EFQM model as a complete framework for attaining organizational excellence, as defined by Nabitz et al. (2020). Employees said that EFQM’s organized method of analyzing enablers and outcomes encouraged continual improvement, consistent with Uygur and Sümerli (2013).
While EFQM’s emphasis on “enablers” and “results” brought clarity, workers believed the framework’s rigidity might inhibit innovation, calling its applicability in fast-paced contexts into question. Unlike conventional systems prioritizing stable processes, our results indicate that EFQM might benefit from more adaptable deployment tactics. This demonstrates a mismatch between the model’s organized approach and the need for adaptation in dynamic environments. Organizations may explore adopting EFQM to include flexibility, allowing for continual improvement while accommodating fast change. Encouraging feedback and experimentation within EFQM can enhance innovation and excellence by transforming rigid excellence criteria into flexible, innovation-friendly frameworks.
Holistic Performance Management Framework (HPFM)
These data suggest that HPFM is a balanced performance approach, consistent with Fareghzadeh et al. (2019). Employees enjoyed HPFM’s focus on financial and non-financial performance, which supports Folan and Browne’s (2005) assessment of its comprehensiveness.
One observation was that HPFM’s emphasis on employee well-being increased engagement, demonstrating its potential to improve organizational culture. However, several participants reported difficulties in combining social and environmental data, indicating possible limitations in actual implementation. Unlike standard frameworks, HPFM focuses on sustainability and stakeholder satisfaction. This study result corroborates this advantage and highlights the need for tools that can successfully combine several variables into a unified assessment system. To improve HPFM, firms should invest in solutions that smoothly combine financial, social, and environmental measurements. Stakeholder involvement and sustainability within HPFM might enhance its benefits and build a healthy workplace culture.
The detailed discussion of various Performance Measurement System (PMS) models in the study highlights the importance of a multi-faceted and evolving approach to organizational performance management. Each model contributes uniquely to understanding and addressing the complexities of performance measurement, emphasizing different aspects of organizational needs.
Discussions and Key Learnings
Upon examining several performance management frameworks and models, many significant insights and themes surface that provide valuable approaches to enhancing organizational performance. The need to adopt a comprehensive strategy, integrate technology, take stakeholders into account, and be flexible are all covered in the conversation.
The necessity of a thorough and well-rounded approach to performance management is shown by investigating frameworks like the Holistic Performance Management Framework (HPFM) and the Excellence Model of the European Foundation for Quality Management (EFQM). Organizations may get a more comprehensive picture of their performance by combining financial and non-financial data from various angles. A comprehensive approach guarantees that strategic goals align with employee growth, internal procedures, consumer expectations, and social effects. Technology integration is a common feature of many models, such as the Proactive Balanced Scorecard (PBSC). Organizations may efficiently gather, process and present performance data using integrated software platforms, business intelligence tools, and data analytics. Technology improves measurement precision and makes it easier to monitor and adjust in real-time, which is essential for being competitive in ever-changing circumstances. Performance management encompasses the interests of several stakeholders and is not only an internal matter. Models such as the Holistic Performance Management Framework (HPFM) and the Integrated Performance Measurement Framework (IPMF) strongly focus on stakeholder concerns, emphasizing how critical it is to fulfill the requirements and expectations of investors, consumers, workers, and the larger society.
Organizations may improve transparency and foster trust by coordinating performance measures with stakeholder interests. The necessity for organizations to be flexible and dedicated to ongoing development keeps coming up. Models like the Proactive Balanced Scorecard (PBSC) and the Dynamic Multidimensional Performance Framework (DMPF) highlight the necessity of flexibility in altering strategies, goals, and measures. Organizations may successfully adapt to changing conditions and capitalize on emerging possibilities by fostering a culture of continual learning and innovation. The whole character of organizational success cannot be fully captured by traditional financial measurements, notwithstanding their importance. The necessity of a balanced strategy that considers both financial and non-financial aspects is emphasized by models like the EFQM Excellence Model and BSC. Organizations may get a more realistic picture of their total performance and well-being by expanding the scope to encompass employee development, internal procedures, customer satisfaction, and social impact. Flexibility, as highlighted by PBSC and DMPF, emerges not just as a strategic need but as a cultural imperative. Organizations that cultivate a culture of innovation and adaptability are better positioned to thrive in volatile environments. However, embedding such flexibility requires iterative feedback loops, open communication channels, and a willingness to challenge entrenched practices.
The results highlight that PMSs like the BSC effectively align individual and organizational goals but rely heavily on historical data, emphasizing the need for forward-looking measures to enhance adaptability. Findings on CPMS reveal the balance required between standardization and personalization, with flexibility driving higher employee satisfaction. Integrated frameworks like IDPMS and HPFM provide holistic organizational insights but face challenges in real-time data interpretation and metric integration, underscoring the importance of technology and skill development. Additionally, the rigidity of the EFQM model emphasizes the need for cultural adaptability and continuous learning. These insights contribute to both theory and practice, offering practical strategies to refine PMSs for dynamic organizational environments.
This study extends the Resource-Based View (RBV) by signifying how internal resources (e.g., data analytics infrastructure) enable adaptive PMS in the volatile environment (Madhani, 2010). It also refines stakeholder theory by showing how ESG metrics bridge shareholders and societal value (Freeman, 1984). Furthermore, the bibliometric evidence supports the dynamic capabilities paradigm, where continuous PMS innovation drives competitive advantage (Teece, 2018).
Conclusion
This work reflects the intellectual and historical growth of the topic of business performance metrics by offering a thorough bibliometric examination of its patterns and developments. The research uncovers important thematic connections and collaborative patterns that have influenced academic discourse by using VOSviewer to visually map co-authorship, citation, and bibliographic coupling and by accessing data from the Dimensions database. In response to wider economic and cultural developments, the results highlight a clear movement toward the incorporation of sustainability and technology improvements in performance measuring methods. Technology’s revolutionary influence is shown by frameworks such as the PBSC and the IPMF, which use business intelligence tools, real-time monitoring, and sophisticated analytics to improve organizational agility and flexibility. This research also highlights the value of international cooperation and the important impact of foundational studies, showing how these contributions have influenced industry best practices. Business performance indicators today promote more openness, increase stakeholder confidence, and support strategic goals by combining numerous viewpoints, including financial, internal processes, social impact, and consumer pleasure. Thus, this study offers crucial direction for future research by providing a framework for coordinating performance evaluation with organizational objectives in intricate and quickly changing contexts. The study’s relevance to both present practice and future research is emphasized in this rewrite, which also improves the language and keeps the important results and implications summarized. As organizations continue to explore complex and rapidly changing environments, the insights from this study offer valuable guidance for enhancing strategic decision-making and operational effectiveness.
Implications and Future Scope
The most recognized research lines in business performance metrics shows major movements toward sustainability, technological integration, and multidimensional performance evaluation. Practically, these study lines show that firms may use advanced performance measures not just to assess operational efficiency, but also to fulfill environmental and social governance norms, adhere to sustainable business practices, and preserve competitive agility. Integrated models, such as the PBSC and Integrated IPMF, allow firms to combine real-time analytics with long-term strategic insights, increasing flexibility in a quickly changing global market. These frameworks offer managers with actionable knowledge that supports informed decision-making and encourages transparency, both of which are critical for building stakeholder confidence and reacting successfully to changing market demands.
Theoretically, these study lines reflect the shift in performance measurements from merely financial indicators to more holistic and integrative frameworks. The extension into topics like as sustainability and social impact represents a paradigm change towards assessing firms via a larger lens, in line with developing conceptions of corporate social responsibility and stakeholder involvement. This trend shows that performance measurements need more theoretical refinement to account for non-traditional characteristics of success, such as environmental effect, innovation, and technical capability.
Future study might described approaches to improve sustainability and corporate success, research should focus on developing frameworks that measure an organization’s environmental and social contributions in addition to its financial performance. This involves looking at particular ESG criteria and the influence of green technology on long-term business results. With AI and machine learning becoming more prevalent in predictive analytics, research might concentrate on integrating these technologies into performance measurement frameworks. Future research might look at how AI-driven insights influence decision-making and resource allocation, especially in dynamic and high-risk contexts.
Future study should describe how corporate success measurements intersect with findings from psychology, sociology, and environmental science. This multidisciplinary approach might improve our knowledge of how business activities align with consumer values and society expectations, therefore strengthening models for addressing complex global concerns. Because business practices vary by area, comparative study across diverse geographic and cultural settings might assist assess the universality or adaptability of important performance frameworks. This may help multinational organizations tailor performance indicators to better line with regional values and regulatory requirements. To summarize, firms face both possibilities and problems as performance measurements evolve to include sustainability, technology, and stakeholder-oriented approaches. Future study on these developing issues will improve theoretical frameworks while also providing practical insights that might help firms navigate complicated and fast changing settings.
Footnotes
Acknowledgements
The authors express their sincere gratitude to the individuals and institutions whose support facilitated the completion of this research.
Ethical Considerations
Not applicable to this study.
Author contribution

| Term | Author/s | Definition |
|---|---|---|
| Conceptualization | R.K.D., D.K., & R.G. | Ideas: formulation or evolution of overarching research goals and aims. |
| Methodology | R.K.D, D.K., & R.G. | Development or design of methodology; creation of models. |
| Software | R.K.D, D.K., & B.G. | Programming, software development, designing computer programs, implementation of the computer code and supporting algorithms, testing of existing code components. |
| Validation | R.K.D, & S.P.J. | Verification, whether as a part of the activity or separate, of the overall replication/ reproducibility of results/experiments and other research outputs. |
| Formal Analysis | R.K.D, & B.G. |
Application of statistical, mathematical, computational, or other formal techniques to analyze or synthesize study data |
| Investigation | R.K.D, & DK. |
Conducting a research and investigation process, specifically performing the experiments or data/evidence collection. |
| Resources | R.K.D, S.P.J., & R.G. | Provision of study materials, reagents, materials, patients, laboratory samples, animals, instrumentation, computing resources, or other analysis tools. |
| Data Curation | R.G., B.G., & S.P.J. | Management activities include annotating (producing metadata), scrubbing data, and maintaining research data (including software code, where it is necessary to interpret the data itself) for initial use and later reuse. |
| Writing – Original Draft |
D.K., & R.K.D | Preparation, creation and/or presentation of the published work, specifically writing the initial draft (including substantive translation). |
| Writing – Review & Editing |
D.K., R.K.D, B.G., & S.P.J. | Preparation, creation and/or presentation of the published work by those from the original research group, specifically critical review, commentary, or revision, including pre- or post-publication stages. |
| Visualization | R.K.D, & S.P.J. | Preparation, creation and/or presentation of the published work, specifically visualization/ data presentation. |
| Supervision | R.K.D, B.G., & D.K. | Oversight and leadership responsibility for the research activity planning and execution, including mentorship external to the core team. |
| Project Administration | D.K. | Management and coordination responsibility for the research activity planning and execution. |
| Where, R.K.D. (Rewan Kumar Dahal), D.K. (Dipendra Karki), R.G. (Rajesh Gurung), B.G. (Binod Ghimire), and S.P.J. (Surendra Prasad Joshi) | ||
All authors have approved the final manuscript.
Funding
The authors received no financial support for the research, authorship, and/or publication of this article.
Declaration of Conflicting Interests
The authors declared no potential conflicts of interest with respect to the research, authorship, and/or publication of this article.
Data Availability Statement
The data that support the findings of this study are available upon reasonable request.