
Abstract
The accelerated pace of global urbanization has exacerbated the tension between anthropogenic activities and land resource allocation, rendering systematic evaluation of urban expansion’s spatial impacts on regional land-use patterns imperative for informing sustainable land-use planning strategies and facilitating coordinated socioeconomic development. Nanchang was selected as the study area to investigate urban land-use dynamics. Multitemporal Landsat imagery spanning 2005 to 2020 was subjected to spatial pattern analysis, followed by CA-Markov modeling projections of land-use evolution. This integrated methodology enabled systematic evaluation of land resource allocation efficacy in Nanchang, providing empirical evidence for optimizing spatial planning decisions. The results show that: From 2005 to 2020, woodland areas exhibited a continuous decline, with a cumulative reduction of 300.27 km2 over the 15-year period. Concurrently, unused land underwent conversion to construction and agricultural land uses, resulting in a proportional decrease. While both grassland and construction land demonstrated proportional increases, the expansion rate of construction land showed a marked acceleration during the study period. Agricultural land, woodland, grassland and water areas are greatly affected by elevation slope. Construction land is greatly affected by the convenience of transportation, and old construction land, as the initial boundary of expansion, has driven the transformation of surrounding land use. In 2035, agricultural land will remain largely stable; woodland will slightly decrease; both grassland and water areas will show a decreasing trend; and construction land will increase by 306.31 km2. A comprehensive understanding of land use dynamics in Nanchang provides critical insights for sustainable urban planning. The integration of developmental initiatives with ecological conservation constitutes a fundamental requirement for achieving sustainable land resource management and regional sustainable development.
Plain language summary
Nanchang was selected to study in the research, land use change images of Landsat from 2005 to 2020 was analyzed, spatical-temporal distribution of land use of Nanchang predicted by CA-Markov model, to analyze and evaluate the scientific and effective use of land resources in Nanchang. The results show that from 2005 to 2020, woodland continued to decrease, with a total decrease of 300.27 km2 in 15 years; unused land was developed into construction land and agricultural land, the proportion of unused land became less and less; the proportion of grassland and construction land increased, and the expansion rate of construction land increased. Agricultural land, woodland, grassland and water area are greatly affected by elevation slope; The construction land is greatly affected by the convenience of transportation, and the old construction land as the initial boundary of expansion has driven the transformation of surrounding land use. In 2035, agricultural land will remain largely stable; wood land will slightly decrease; both grassland and water area show a decreasing trend; the construction land increase by 306.31km2. Understanding the characteristics and laws of land use change in Nanchang is conducive to urban sustainable development planning. Simultaneous development and protection are conducive to the sustainable use of land resources and sustainable regional development.
Introduction
Accelerated urbanization has precipitated profound transformations in land use configuration (Cai et al., 2020; He et al., 2022; L. Wang et al., 2021). The rapid conversion of substantial ecological lands—including forested areas, grasslands, and wetland—into economically prioritized land uses (e.g., cash crop cultivation zones and industrial complexes) has been particularly evident within central urban districts. China’s early developmental phase predominantly adopted an extensive growth model, which precipitated disproportionate appropriation of ecological land areas. This developmental approach intensified structural contradictions between regional economic expansion and ecological preservation, exacerbating human-environment conflicts through diminished land system resilience (Y. Zhou et al., 2020). When the contradiction between people and land gradually emerges, it inevitably leads to certain ecological threats, such as frequent geological disasters, global warming, serious industrial pollution, soil desertification, and other problems (Jin et al., 2021; Yang et al., 2019). Eco-friendly land use policies should be formulated according to the law of urban development (Su et al., 2024). Systematic investigation of spatiotemporal dynamics in urban land use patterns and their driving mechanisms enables the establishment of optimized land development strategies, while the development of scientifically informed spatial configurations facilitates the formulation of sustainable land management frameworks at regional scales.
Remote sensing data and models enrich the methods used to study urban land use change (Han et al., 2022; S. Liu et al., 2022; Qiao et al., 2023; J. Wang et al., 2022). Z. Li et al. (2024) comparatively evaluates PLUS, FLUS, and CLUES models integrated with CA-Markov for land use and fine wetland prediction in wetland cities. Khodaei et al. (2025) developed a machine learning framework to derive land cover classifications in Iran’s flood-vulnerable regions through multisource satellite data integration, thereby enabling predictive assessments of future flood susceptibility via advanced geospatial analytics. Xichao et al. (2020) categorized land use changes into three spatial types (unchanged, transferred, and newly added), refined quantitative and dynamic assessment models to improve measurement precision of land use change rates, and proposed a spatial analysis framework for evaluating urbanization impacts on marginal areas. Contemporary research within land use modeling and projection has predominantly concentrated on advancing simulation frameworks, with numerous studies demonstrating robust predictive efficacy through systematic model development (Couclelis, 1985). Among them, CA-Markov model has been more widely used for its advantages in spatial simulation, accuracy and scalability (Chen et al., 2018; Zhao et al., 2019). Fu et al. (2024) developed an enhanced Markov model to analyze microscale land use dynamics surrounding railway stations, with findings offering critical insights for optimizing transportation infrastructure planning in adjacent areas. Liu et al. (2002) proposed a framework for delineating urban development boundaries by integrating the MCR and CA-Markov models, balancing actual supply and ideal demand under supply-demand equilibrium principles, effectively reconciling urban-agricultural land conflicts and offering methodological insights for spatial planning. Degang et al. (2021) used the CA-Markov model to predict the spatial pattern of land use/cover under an ecological conservation scenario (EVC) and a natural change scenario (NVC) and used the modified carbon density InVEST model to evaluate carbon storage in the Yellow River Basin from 2005 to 2030 for six periods, which provides scientific significance for the implementation of ecological protection. The literature review demonstrates that integrated application of remote sensing (RS) and geographic information system (GIS) technologies enables systematic analysis of regional land use patterns and spatiotemporal evolution characteristics. Furthermore, incorporating key driving factors into CA-Markov modeling facilitates scientifically robust projections of future land use scenarios, establishing a valuable decision-making framework for regional sustainable development planning (Gashaw et al., 2018; Mitsova et al., 2011; Youqi, 2011; L. Zhou et al., 2020).
As the provincial capital of Jiangxi Province and the core urban center of the Poyang Lake Ecological Economic Zone, Nanchang has undergone significant land use transformations since the implementation of reform and opening-up policies. The region’s rapid economic growth has been accompanied by notable land use transitions, including historical phases of lake reclamation for agriculture and subsequent ecological restoration initiatives involving forest and wetland rehabilitation. Particularly following its 2009 integration into the Poyang Lake Ecological Economic Zone and designation as a national low-carbon pilot city in 2010, Nanchang’s land use configuration has evolved through the dual drivers of policy interventions and ecological imperatives, resulting in fundamental restructuring of its spatial patterns and utilization modes. Current research efforts have investigated land use structure, driving mechanisms, and urban development strategies in Nanchang, yet predominantly focus on isolated temporal or spatial dimensions, limiting analytical comprehensiveness. While existing studies address discrete aspects of land use dynamics, systematic examinations of spatio-temporal differentiation patterns and future evolutionary trajectories through longitudinal time-series analysis remain notably absent in scholarly investigations of this regional system. This study systematically analyzes spatiotemporal land use dynamics in Nanchang City through multi-temporal remote sensing data interpretation, integrating CA-Markov modeling techniques to delineate inherent spatial differentiation patterns. Furthermore, we develop prospective land use projections by incorporating regional socioeconomic and biophysical drivers, thereby elucidating evolving spatial configurations. The findings establish an empirical foundation for optimizing land resource allocation and advancing ecological sustainability in urban development planning.
Material and Method
Study Area
Nanchang city is located in the north-central part of Jiangxi Province, in the lower reaches of the Gan River, the lower reaches of the Fu River, and the shore of Poyang Lake, located at 115°27′ to 116°35′ east longitude and 28°11′ to 29°11′ north latitude (Figure 1; Y. Li et al., 2021). It borders Shangrao in the east, Fuzhou in the south, Yichun in the west, and Jiujiang in the north, with a land area of 7432.21 km2. Nanchang is dominated by plains, the southeast area is flat, the northwest area is more hilly, the terrain difference is large, and the forest coverage accounts for approximately 30% of the total area of the city. The soil of Nanchang is mainly composed of red soil, purple soil, stony soil, aquic soil, and paddy soil.

Location map of Nanchang city.
Data Collection and Processing
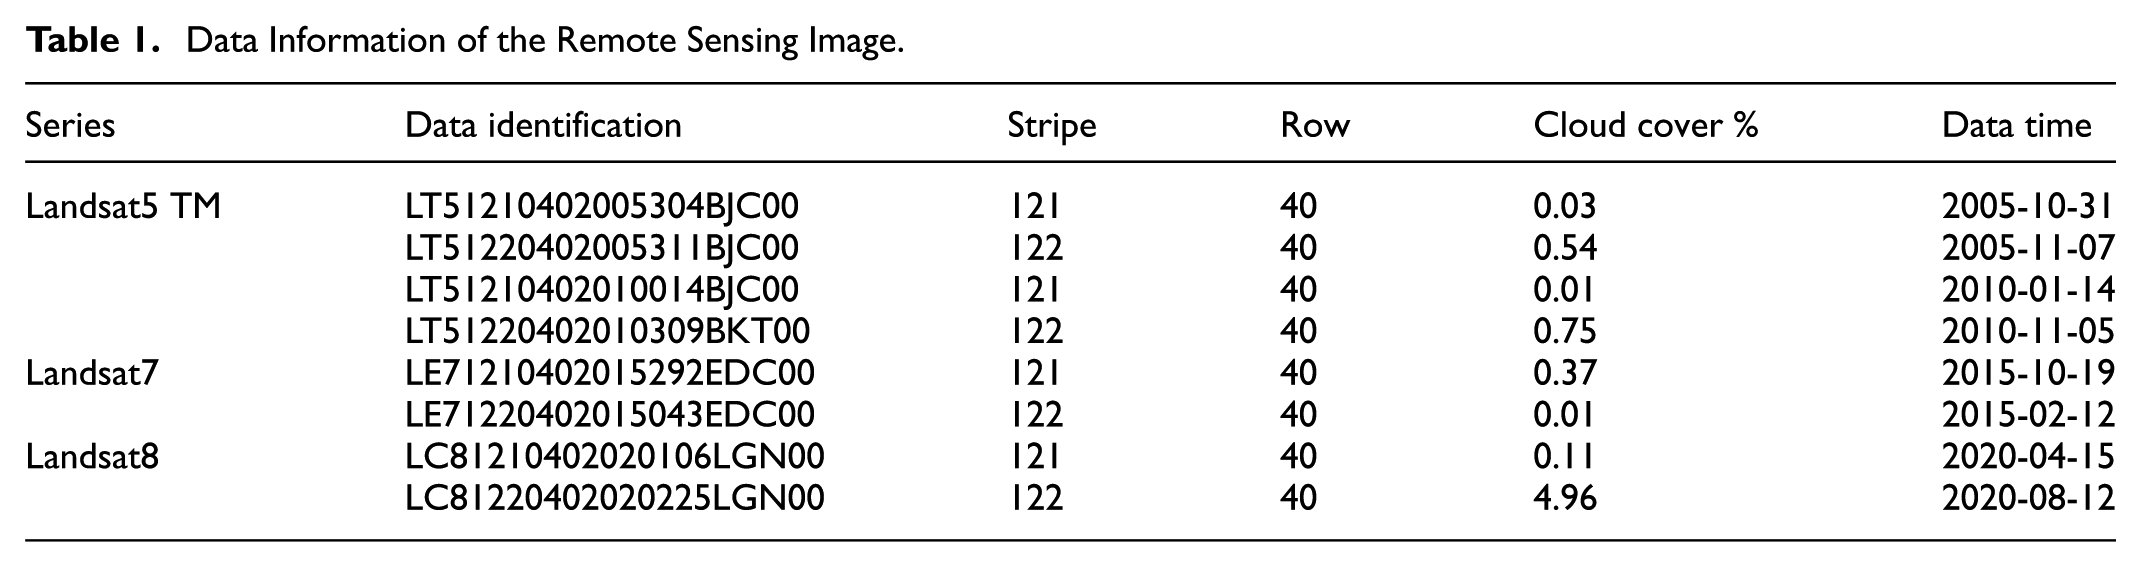
The basic data of this study were obtained from the Landsat TM/ETM+ image through the US Geological Survey (https://www.usgs.gov/), and the data of two periods in 2005, the data of Landsat 7 in 2015, and the data of Landsat 8 in 2020 were selected. Each phase contains two scenes, the orbital numbers are 122/40 and 121/40, and the cloud cover is below 5%. The specific impact information is shown in Table 1. The land use classification process employed a Random Forest classification algorithm, with subsequent accuracy enhancement through comparative validation against high-resolution historical imagery from the Google Earth platform. Manual corrections were systematically applied to misclassified parcels following rigorous visual interpretation, ultimately generating a spatially explicit land use classification dataset for the entire study area.
Data Information of the Remote Sensing Image.
To complete the simulation of land use change, combined with the existing classification basis, and improve on this basis so that the classification can provide the basis and guarantee for the research of land use change, it is divided into six categories with reference to the land use/land cover monitoring data classification system of the Chinese Academy of Sciences, including agricultural land, woodland, grassland, water area, construction land, and unused land. See Table 2 for specific explanations. Other economic, land and forestry data are from the Jiangxi Provincial Statistical Yearbook, Jiangxi Provincial Water Resources Bulletin and Jiangxi Provincial Ecological and Environmental Status Bulletin (Table 3).
Land Use Definition.

Dynamic Table of Land Use Classification in Nanchang City, 2005 to 2020.

Method
CA-Markov is the combined technique of Markov Chain and Cellular Automata. Markov Chain model handles lattice-based GIS data or satellite images, and reflects the changed tendency of present land use. The transition probability is fixed for a given time interval, but is difficult to trace the actual land use change. Cellular Automata is a nonlinear dynamic model which applies the distance direction to the cell and the change state of regional contiguity cell continuously. CA-Markov of Spatial-Statistical model is the combined technique of Markov Chain and Cellular Automata.
The category of land use in a certain period can be compared with the possible situation in the Markov process, which is only relevant to the type of land use of the previous period. Specifically, the transition probability matrix for LUCC from period 1 to period 2 as the basis for predicting subsequent changes (Alves et al., 2022) is achieved with the following equation in the Markov Chain model:

where St+1, St. are the land use state at t and t + 1 period; Pij is the land use type transfer probability matrix, which can be expressed by the following formula (Alves et al., 2022):

Given that
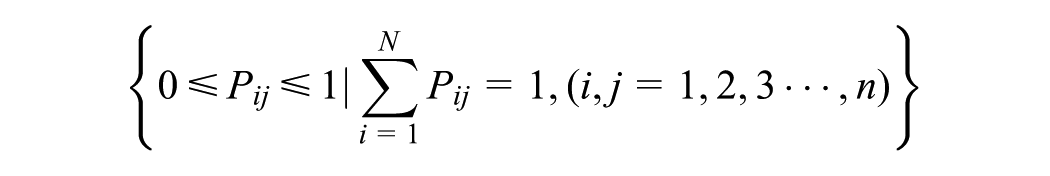
However, spatial parameters are inadequately accounted for in Markov Chain processes, and the variability of spatial LUCC cannot be identified (Wickramasuriya et al., 2009). The CA model has a capacity for simulating spatial-temporal evolution of various natural processes including LUCC (Zhao et al., 2019). The CA is a grid dynamics theory in which the interaction and temporal connections of space are local, and the space-time relationships and morphological conditions are scattered (Zheng et al., 2012). The formula is as follows:

Where S is the finite discrete set state of the cell; t and t + 1 are different moments; N is the domain of the cell; and f is the cell transformation rule of local space. The Markov model has the ability to deduce time series, while the CA model has the advantage of predicting the dynamic evolution of complex systems in time and space. Since land use change also has the nature of a Markov process, the synthesis of the two models can scientifically and reasonably deduce the dynamic change in land use.
The kappa coefficient is used to detect the prediction accuracy of land pattern evolution, and the calculation formula is:

Where p0 is the sum of the sample sizes for each class correctly classified divided by the total number of samples, which is the overall classification accuracy (Wagner et al., 2019). Suppose the true number of samples of each class is a1, a2…ac, the number of samples predicted for each class is b1, b2…bc, and the total number of samples is n:

Usually, kappa falls between 0 and 1, which can be divided into five groups to represent different levels of consistency: 0.0 to 0.20 very low consistency (slight), 0.21 to 0.40 general consistency (fair), 0.41 to 0.60 medium consistency (moderate), 0.61 to 0.80 high consistency (substantial), and 0.81 to 1 almost perfect (almost perfect).
Land use dynamics refers to the change in a certain land use quantity in a certain period of time in a certain area:

Where U1 is the value of land uses of a type in the U1 period; U2 is the value of land uses of a certain type in the U2 period; T is the study period; and K is land use dynamics (Y. Li et al., 2017).
Remote sensing image extraction application Envi, version 5.1, image processing and geostatistical analysis application Arcgis version 10.3. All statistical analyses were performed using SPSS software, version 24.0 (SPSS Inc., USA).
Results and Analysis
Spatial and Temporal Characteristics of Land Use Change in Nanchang from 2005 to 2020
Through remote sensing image extraction and land use dynamics formula calculation, the various land use areas of Nanchang city in 2005, 2010, 2015, and 2020 were classified and counted, the land use status map of the four phases was obtained, and the land use situation is shown in Figure 2. Agricultural land is the most widely distributed land type, dominating land use in various periods, and agricultural land has always accounted for more than 50%, followed by woodland and water areas, both accounting for approximately 16%. The proportion of unused land is decreasing, the proportion of grassland and construction land is increasing, and the expansion rate of construction land is increasing. From 2010 to 2020, agricultural land continued to decrease, and the expansion rate of construction land further increased, while in the process of construction land expansion, the conversion of agricultural land and construction land was frequent, and the quality and quantity of cultivated land were greatly affected. From 2005 to 2020, the woodland area continued to decrease, with a total decrease of 300.27 km2 in 15 years, which changed greatly from a quantitative point of view, and Nanchang’s urban economic development should pay more attention to the coordinated development of ecology and agriculture. Unused land continued to decrease between 2005 and 2020, and unused land was developed for construction or converted into agricultural land.

Land use classification map of Nanchang from 2005 to 2020.
In the land transfer situation from 2005 to 2010, the changes in agricultural land and construction land were more obvious. The area of agricultural land transferred from 2005 to 2010 was 72.05 km2, the largest of which was converted into construction land, approximately 37.91 km2, which shows that the expansion of construction land occupied serious agricultural land. In terms of transfers, agricultural land was the most transferred part, with 40.675 km2, which was due to the conversion of woodland into agricultural land. For construction land, construction land increased by 20.825 km2 from 2005 to 2010, with agricultural land occupying the most. From the perspective of the total area of land types, the transferred area of agricultural land was greater than that of transferred land, and the total amount of agricultural land increased. The transfer out of construction land is less than that of transfer in, the transfer out part is mainly converted into agricultural land by a value of 21.894 km2, and the total amount increases. Agricultural land is frequently transferred in and out, and the expansion speed of construction land is relatively fast. Both woodland and grassland have decreased, and unused land has increased, possibly because some water areas have increased due to water level change, resulting in an increase in unused land.
From 2010 to 2015, the more obvious land use transfer was still construction land and agricultural land. A total of 6.158 km2 of construction land was transferred out, the value of which converted into agricultural land was 5.045 and 69.711 km2 was transferred into construction land, of which mainly agricultural land and woodland were transferred. For woodland grasslands, woodlands and grasslands continued their decreasing trend. Unused land remained unchanged, and from the perspective of the land use transfer matrix, the transformation of unused land and water area was still relatively frequent.
In the land use transfer from 2015 to 2020, the largest type of land transferred from agricultural land was construction, with a value of 273.334 km2, and the largest transfer was woodland, with a value of 287.720 km2 because woodland was used as farmland after land reclamation. For construction land, the largest transfer is agricultural land by 125.222 km2 because part of the construction land is returned to farmland, the most transferred is also agricultural land, and construction land occupies part of the agricultural land. From 2015 to 2020, agricultural land continued to decrease, woodland continued to decrease, and grassland and water areas increased, which may have been caused by the abandonment of agricultural land.
According to the calculation results, the annual average change is mainly to construction land, and the dynamic change of single land use is more obvious, which is 4.03% in 2005 to 2010, 11.08% in 2010 to 2015, and 38.13% in 2015 to 2020. For agricultural land, due to the large base, the change is not obvious. The dynamics of single land use of woodland showed a decreasing trend year by year, which was −1.18% in 2005 to 2010, −1.08% in 2010 to 2015, and −23.18% in 2015 to 2020. The change in the single land use dynamics of grassland is more obvious, at 311.46% from 2015 to 2020, which may be due to the reduction in unused land. Tidal flats were classified as unused land in this study. The dynamic conversion between coastal tidal flats and grassland exhibited pronounced sensitivity to water level fluctuations, particularly evident in lacustrine environments. Given the inherently limited baseline extent of grassland cover, even moderate land use conversions generated significant proportional changes. Concurrently, urban expansion-driven landscape modifications—including park development and community greening initiatives—precipitated rapid grassland proliferation. The analysis revealed progressive declines in woodland and agricultural areas, contrasted with expanding water bodies and grassland coverage. Construction land demonstrated the most accelerated expansion pattern, reflecting intensified anthropogenic pressures from urban development. These patterns reflect how urban spatial restructuring simultaneously degrades natural land covers while creating compensatory green infrastructure through planned ecological landscapes.
Predictive Analysis of Land Use Change in Nanchang City
A land use transition probability matrix and spatial suitability atlas were developed using 2010 as the baseline period and 2015 as the validation interval. Subsequently, employing 2015 as the modeling baseline, we projected the 2020 land use configuration and conducted model validation through Kappa coefficient analysis comparing simulated outcomes with empirical 2020 land use data. According to the simulation results, the Kappa value is 0.94, which proves that the simulation effect of the study area is good, the land use of Nanchang in 2035 is simulated and predicted, and the error classification of the simulation results in 2020 is shown in Table 4. The CA-Markov model was implemented to conduct land use simulations, with model validity confirmed through rigorous accuracy assessments. Based on validation outcomes, the 2020 land use configuration was established as the baseline for predictive modeling. By integrating the land use transition probability matrix and spatial suitability atlas under a 15-year projection horizon, the study generated statistically validated simulations of Nanchang’s 2035 land use patterns. Quantitative analysis of the projected outcomes is systematically presented in Tables 5 and 6.
Nanchang Land Simulation Error Table.

Land Use Simulation Structure Table of Nanchang City.

Land Use Transfer Matrix from 2020 to 2035 (unit: km2).

From the perspective of land use structure changes (Figures 2 and 3), agricultural land will not change much in 2035 and 2020 and will remain basically stable. Woodland decreased slightly, from 12.48% to 11.12%, which also requires attention to environmental protection in social and economic development. The grassland and water area showed a decreasing trend, and the overall change was not obvious. For construction land, Nanchang accounted for 11.48% in 2020 and 15.83% in 2035, an increase of 306.31 km2, which is also an inevitable trend of Nanchang’s social and economic development; the overall change in unused land is not obvious, accounting for 0.79% in 2035 and 0.94% in 2020.

2035 Nanchang land use classification map.
From the perspective of land use simulation dynamics in Nanchang, agricultural land changed the least, the annual land use dynamics were −0.09% and showed a decreasing trend, and the dynamic degree of single land use was −0.77%. The increase in grassland may be caused by changes in topography, water and soil, and the single land use dynamic is 0.88%. The water are influenced by multiple factors and are projected to exhibit a decreasing trend by 2035, with a single land use dynamic degree of −1.21%. Construction land demonstrated the most pronounced transformation, with urban-rural built-up areas expanding at an accelerated rate. This spatial proliferation primarily manifested through edge-expansion patterns at the interfaces between existing developed zones and adjacent land use types, registering a single land use dynamic degree of 2.46%. Conversely, unused land exhibited minimal variation overall, showing a negative dynamic degree of −1.14% attributable to incremental utilization of marginal parcels.
The land use transition matrix reveals dynamic bidirectional transitions in agricultural land utilization. Conversion from agricultural land predominantly occurred to grassland and construction land, with the latter accounting for 251.53 km2 of transformed area. These patterns suggest substantial cultivated land encroachment by urban expansion, mandating rigorous implementation of land occupation-compensation equilibrium principles and arable land protection strategies in Nanchang’s spatial planning. Conversely, agricultural land gains principally originated from woodland (72.10 km2) and water bodies (164.64 km2), a spatial redistribution likely associated with climatic fluctuations and hydrological regime alterations. Woodland demonstrated partial transitions to construction and agricultural land uses, with conversion magnitudes remaining constrained. Grassland exhibited major conversion pathways to agricultural and silvicultural lands, reflecting utilization of suitable areas for agronomic and forestry purposes. In terms of construction land, outflow transitions proved minimal, whereas inflow sources predominantly originated from agricultural land (251.53 km2), woodland (48.58 km2), and aquatic systems (51.11 km2). These conversion patterns demonstrate substantial spatial expansion of constructed areas relative to 2020 baselines. For unused land, from 2020 to 2035, the area will change from 67.79 to 56.39 km2, showing an overall decreasing trend, but the change is not large, urban development has taken away part of the unused land, but most of the unused land has been preserved, in relation to the ease of utilization of that part of the unused land.
Spatiotemporal distribution patterns of land use characteristics exhibit significant categorical differentiation. Analysis reveals that by 2035, agricultural land, woodland, grassland, and water bodies in Nanchang will demonstrate strong geomorphic dependencies, primarily concentrated in low-elevation zones (<200 m) with gentle slopes (<15°). Conversely, construction land distribution shows predominant correlation with transportation infrastructure accessibility, particularly along major urban arterial networks. This spatial configuration stems from dual mechanisms: existing built-up areas serve as expansion nuclei through edge-spread development, while natural drivers including hydrothermal conditions, slope limitations, and elevation constraints collectively regulate land conversion processes. The synergistic effects of these factors have precipitated accelerated construction land expansion, fundamentally reshaping the regional landscape configuration.
Discussion
Impacts and Causal Factors of Land Use Change in Urban Areas
Regional development inherently necessitates dedicated economic development zones for industrial and urban infrastructure, precipitating conversion processes of forest and grassland ecosystems into built environments (M. Liu et al., 2025). This transformation proved particularly pronounced during initial industrialization phases under extensive growth models (Alkhawaga et al., 2025). The analysis of Nanchang’s 2005 to 2020 land transitions revealed substantial transitional dynamics, predominantly concentrated between construction and agricultural land categories—the former primarily driven by urban expansion requirements versus multifactorial agricultural land transformations. Sustained population growth necessitated urban built-up area expansion through appropriation of alternative land categories (primarily agricultural land, as evidenced in 3.1 Section), resulting in agricultural land’s progressive contraction. Conversely, demographic pressures amplify food security demands, compelling stringent regulatory measures over agricultural land preservation in Jiangxi Province—a critical grain production base in southern China (Y. Li et al., 2025). Consequently, the aggregate acreage of agricultural land maintained relative stability notwithstanding substantial conversion to construction uses, demonstrating effective equilibrium between developmental pressures and strategic farmland protection policies. However, the consequent destruction and occupation of various types of ecological land has disturbed the structure, function and process of the regional ecosystem to varying degrees, and the quality of the ecological environment has deteriorated (Zhang et al., 2024).
Within this developmental paradigm, governmental authorities must establish strategic regulatory frameworks to safeguard the structural integrity of regional ecosystems and prevent large-scale ecological degradation. The heightened national prioritization of ecological conservation in contemporary policy agendas has intensified the urgency for implementing protective measures. Consequently, municipal administrations have implemented regulatory interventions to curb unregulated proliferation of economic-oriented land utilization, instituting spatial zoning controls and ecological redline policies that enforce strict limitations on non-essential conversions of ecologically sensitive areas. In Nanchang, the implementation of policies such as returning farmland to forests and lakes has eased the drastic reduction of forest land, grassland and waters, and the strict control of industrial enterprises has brought pollutant emissions under control (Ma et al., 2022), resulting in a gradual improvement of the regional ecological environment. In addition, in the simulation of future land use, similar to Cao et al.’s (2024) study, they all show a more obvious trend of expansion of construction land, while the reduction of forest land and water area is not obvious, which corresponds to what was mentioned before.
Land Use Improvement Proposals
(1) Integration of Development and Protection. First, during land development and utilization, governments should conduct thorough investigations into the actual conditions of land parcels to implement location-specific development measures, while simultaneously protecting the ecological environment surrounding the development areas. Second, vigorous promotion of land use protection policies should be undertaken to mobilize public participation in land use supervision, thereby ensuring effective policy implementation. (2) Strengthening and Refining Land Protection Systems. The land protection zone regulations should be progressively improved to enhance land administration. Development objectives must be clarified and aligned with actual conditions, while holistically considering demands to standardize the development and planning of land resources. By holistically evaluating factors such as land utilization potential and land supply rates, the transformation of land use patterns should be facilitated to achieve intensive and economical land utilization.
Limitations of this Research
This investigation utilized remote sensing data as the foundational dataset, classified through Random Forest algorithms to derive a multi-temporal land use classification series for the study area. Subsequent predictive simulations of land use evolution were conducted using these analytical products, thereby generating policy-relevant insights for regional land management. While these findings provide a valuable reference for regional planning strategies, there are still some limitations as well as shortcomings. Firstly, the land use data in this study derived from remote sensing image interpretation using the Random Forest method inherently contains methodological constraints. First, the training sample selection process relied on empirical visual interpretation, introducing unavoidable subjective judgment errors. Furthermore, cloud contamination in partial image subsets compromised classification accuracy, potentially creating systematic biases in derived land use products. Second, model construction faced data accessibility limitations, as critical constraint variables fell under confidentiality protocols, restricting comprehensive driving factor integration. This data paucity likely generated prediction uncertainties in simulation outcomes (Partani et al., 2024). Future investigations should establish standardized indicator systems with rigorously validated weighting mechanisms, while incorporating multidimensional socioeconomic datasets to enhance model robustness and prediction reliability.
Conclusion
The rapid development of cities has intensified the contradiction between people and land. Agricultural land in Nanchang is the most widely distributed land type, with more than 50% in all periods, followed by woodland and water, both with more than 16%. The proportion of unused land is decreasing, the proportion of grassland and construction land is increasing, and the expansion rate of construction land is increasing. Construction land will increase from 830.52 km2 in 2020 to 1136.83 km2 in 2035, an increase of 36.88%. Agricultural land continued to decrease, the expansion rate of construction land further increased, the conversion of agricultural land and construction land was frequent, and the quality and quantity of cultivated land were greatly affected. The continuous reduction in forestland also shows to a certain extent that Nanchang’s urban economic development should pay more attention to the coordinated development of ecology and agriculture. Unused land is also decreasing, and it is being developed as construction land or converted into agricultural land. In land use, full attention should be given to the balance of cultivated land for construction and cultivated land to promote the healthy and sustainable development of cities. The conversion of agricultural land is the most active, and the rate of renewal is faster. From the perspective of natural factors, agricultural land, forestland, grassland, and water area are greatly affected by the elevation slope. Construction land is greatly affected by the convenience of transportation, and old construction land, as the starting boundary of expansion, has driven the transformation of surrounding land use. Simultaneous development and protection and improving land protection systems and land resource monitoring systems are conducive to the sustainable use of land resources and regional sustainable development in urban development and promote the construction of ecological civilizations.
Footnotes
Ethical Considerations
All authors have read, understood, and complied as applicable with the statement on “Ethical responsibilities of Authors” as found in the Instructions for Authors.
Funding
The authors disclosed receipt of the following financial support for the research, authorship, and/or publication of this article: The research results were supported by the National Science Foundation (Grant No. 42361003,42261045); the Opening Foundation of Xinjiang Key Laboratory of Water Cycle and Utilization in Arid Zone, Xinjiang Institute of Ecology and Geography, Chinese Academy of Sciences (Grant No. XJYS0907-2023-22); Jiangxi University of Finance and Economics: Research team of International price analysis and prediction of bulk commodities; Science Foundation of Jiangxi Education Department (Grant Nos. GJJ190269, JG2022050).
Declaration of Conflicting Interests
The authors declared no potential conflicts of interest with respect to the research, authorship, and/or publication of this article.
Data Availability Statement
The data that support the findings of this study are available from the corresponding author upon reasonable request.