
Abstract
Intelligence tests often play a vital role in selection processes across various domains, including those for basic military training. However, intelligence tests have also been criticized for being unfair and biased. The Swedish Enlistment Battery (SEB) serves as a tool for evaluating cognitive aptitude and is currently undergoing updates to ensure robust measurement properties and equity in selection for conscription. This article introduces a new addition to the SEB, termed the Paper Fold and Cut (PFC) test. The PFC test initially comprised 14 items intended to assess logical reasoning with visuospatial elements by presenting participants with images of folded and cut paper, requiring them to discern the correct outcome upon unfolding. Data was gathered from individuals (N = 1,262) undergoing testing for conscription (71% men, 91% aged 17–19 years, 15% voluntary and 12% with immigrant background). Employing Rasch analysis, when two misfitting items were removed the PFC test demonstrated sound measurement properties; acceptable fit statistics, support for unidimensional trait, absence of differential item functioning (DIF) and local dependence (LD), as well as adequate targeting and person separation index (PSI). Consequently, the PFC test emerges as a robust and unbiased tool for assessing logical ability among conscripts.
Plain language summary
Intelligence tests are important tools in selection processes, such as recruiting for basic military training. However, these tests are sometimes criticized for being unfair or biased. To address this, the Swedish Enlistment Battery (SEB), used for evaluating cognitive abilities in conscription, is being updated. This study introduces a new test for the SEB, called the Paper Fold and Cut (PFC) test, which measures logical reasoning using visual and spatial tasks. The test shows participants images of folded and cut paper and asks them to judge how the paper will look when unfolded. The PFC test was tested on over 1,200 individuals applying for conscription. Most were aged 17-19 years and a majority were men (70%) with a Swedish background (88%). Initially the test included 14 items. After adjusting the test by removing two poorly fitting items, the test was found to be working well. It functions similarly for different gropus maning that it is reliable and fair to assess logical abilities. The PFC test is now considered a strong and unbiased tool to assess logical skills in military selection processes.
Keywords
Introduction
In recent years, the topic of fair and unbiased tests has been a recurring discussion within psychometrics (Berry et al., 2014; Holden & Tanenbaum, 2023; Phillips, 2006; Sternberg & Grigorenko, 2004; Thomas et al., 2023; Warne et al., 2014). Within education, there has been an emphasis on tests being fair and impartial, regardless of the test takers’ socioeconomic and cultural backgrounds (Phillips, 2006; Warne et al., 2014). Within the field of intelligence, studies have shown that cognitive tests may exhibit bias toward different subgroups, systematically misrepresenting the ability of others. Bias occurs when test scores are influenced by irrelevant test taker characteristics such as gender, ethnicity, and social background (Abad et al., 2004; Holden & Tanenbaum, 2023; Immekus & Maller, 2009; Phillips, 2006; Sternberg & Grigorenko, 2004; Thomas et al., 2023), which leads to test scores not reflecting the true abilities of the subgroups. Historically, cognitive tests have often been designed with data from white male students (Holden & Tanenbaum, 2023), which may lead to biased testing that favors this group. Since cognitive abilities are related to one’s experiences—encompassing concepts, ideas, implicit lessons, and associations drawn from everyday life (Phillips, 2006; Sternberg & Grigorenko, 2004)—it is possible that test items vary in difficulty for test takers with different backgrounds, due to factors other than cognitive abilities. For example, if the test relies heavily on language proficiency, non-native speakers might be disadvantaged, despite the test not being designed to assess language skills. Concerns have been raised about potential bias within cognitive testing (Thomas et al., 2023), subsequently raising questions about whether the tests are a true reflection of the abilities of other subgroups.
One aspect related to unbiased testing is invariance—that is, ensuring that the test, and individual items, function in a similar manner for different subgroups (Immekus & Maller, 2009). Thus, given a certain level of ability of a test taker, each item and test should function in a similar manner irrespective of the test taker’s background. Another aspect of unbiased testing is ensuring the content validity of a test. This involves, as far as possible, excluding content irrelevant factors, such as differences in testing environment (Sternberg & Grigorenko, 2004) and taking context and culture into consideration in test development (Thomas et al., 2023), for example through variation in item contents.
Fair testing is especially important in high stakes situations, such as selection for the military. In Sweden, one of the largest tests for cognitive abilities, the so-called Swedish Enlistment Battery (SEB), is used by the Swedish Defence Conscription and Assessment Agency. The SEB is used to select individuals for conscription during the mustering process and has been in use since the 1940s (Husén, 1948). For most of the 20th century, the vast majority of Swedish males underwent these musters (Nordlund, 2022) and subsequently took the SEB. Since the 1990s the Swedish Armed Forces have been downsized and fewer people have mustered. In 2010, an all-voluntary defense was initiated, but was retracted in 2017 because the Swedish Armed Forces’ personnel requirements increased and were not met through voluntary applications. During the same period, the composition of test takers has changed, with an increasing number of women taking the test (Jonsson et al., 2024). Additionally, as the proportion of people with foreign backgrounds has increased in Sweden in recent decades (SCB, 2024), it can be assumed that this proportion has also increased among musters. With the potential criticism of test bias in mind, it is important to ensure that the SEB is truly a fair test for all test takers, irrespective of background such as gender or immigration background.
The current SEB, SEB-2000, has been used since 2000 and comprises 10 subtests designed to measure test takers’ ability in fluid intelligence (assumed to be equivalent to general cognitive ability), crystallized intelligence and general visualization (Carlstedt, 2000; Mårdberg & Carlstedt, 1998). Efforts are currently underway to enhance the SEB-2000 by incorporating new assessment tools and methodologies to improve its measurement properties and align it with contemporary standards of testing fairness and equity.
Cognitive abilities are inherently latent traits, which cannot be directly observed or measured (Hambleton & Cook, 1977), but are inferred through indicators such as logical reasoning, memory abilities, verbal fluency, and visuospatial aptitude (Jensen, 1998). Rasch analysis (Rasch, 1960) is a key methodology based on latent trait theory and offers a useful approach for analyzing categorical data, such as multiple-choice data from intelligence tests (Andrich et al., 2023). Unlike classical test theory, which does not explicitly take varying item difficulties into account, the Rasch model recognizes and incorporates these differences when assessing latent traits. The Rasch model also operates on the principle of specific objectivity, meaning that it provides separate assessments of item difficulty and test-taker ability.
The Rasch model is a probabilistic model, where a person with higher ability is more likely to pass an item than a person with lower ability, and conversely, a difficult item will generate fewer passes than an easy item. In a Rasch analysis, one compares the fit of observed responses to the expectations of the Rasch model (cf., Boone, 2020; Hobart & Cano, 2009; Tennant & Conaghan, 2007). If the observed responses fit the expectations, both individuals and items can be referenced to the same scale—the logit scale—providing true interval-level measurement (Andrich & Marais, 2019; Boone, 2020; Boone et al., 2014; Khine, 2020). This allows more precise measurement of individuals’ abilities and better discrimination between different levels of the latent trait. It also facilitates comparisons of differential item functioning (DIF) and differential test functioning (DTF). This means that it is possible to ensure that each item and each test functions similarly for people with different backgrounds.
This article concerns a new addition to the SEB, the Paper Fold and Cut (PFC) test. The PFC test is primarily designed to evaluate logical reasoning with visuospatial elements. Logical reasoning involves the ability to recognize relationships, identify patterns, and apply rules of inference to solve problems or evaluate arguments (Johnson-Laird, 1983; Sternberg, 2009). Thus, this refers to a cognitive process of drawing valid conclusions from a set of premises or information using principles of logic. Logical reasoning tests frequently incorporate elements from other cognitive domains, such as mathematical or visuospatial components (Carroll, 1993; Embretson, 1998). Visuospatial skills, for instance, are engaged when individuals must mentally manipulate spatial patterns to identify the underlying logical structure of a task (Carpenter et al., 1990; Logie, 1995). In a PFC test, the test taker is presented with a picture of a piece of paper, which is folded two or three times and subsequently cut with scissors. The cuts are in different positions and shapes and range from one to four cuts per item. The task is to decide which of four alternatives shows the correct piece of paper when unfolded. Thus, the PFC test is a multiple-choice test, utilizing four response categories. Multiple-choice tests are widely used to assess abilities and knowledge in different areas (cf., Gierl et al., 2017; Lau et al., 2011), especially in large scale testing situations. They are commonly used, appropriate for and effective in measuring cognitive abilities (Downing & Haladyna, 2006).
In this article, we seek to evaluate the measurement properties of the PFC test by applying Rasch analysis. By conducting this analysis, we aim to contribute to the ongoing refinement and improvement of the SEB, ultimately ensuring that the Swedish Armed Forces have a robust and equitable system for personnel selection.
Methods
This work is a part of the X’s work to update the existing SEB. The new SEB is intended to measure cognitive abilities, including logical ability, visuospatial ability, and verbal ability. The project was approved by the Swedish Ethical Review Authority, ref. 2019-03576. Within the framework of the project, information about the test takers’ immigration background was collected, which is not normally done during the admissions tests for basic military training.
Setting
The admission test for basic military training is administered by the Swedish Defence Conscription and Assessment Agency. The admission tests are usually completed by both males and females, around 18 years old, who are obligated (by law) or who apply voluntarily. These days, roughly 25% to 30% of each cohort undergo the admission tests (Jonsson et al., 2024; Plikt-och Prövningsverket, 2024). The on-site testing includes cognitive testing with the SEB, assessment of psychological suitability by a psychologist, an assessment of medical suitability by a physician, and measurement and tests of hearing, vision, height, weight, blood pressure, resting heart rate, strength, and exercise capacity (Ludvigsson et al., 2022).
Test takers have a maximum of 80 min for the regular SEB (excluding instructions and practice items). After that, they were asked to complete additional items under development for the updated SEB. However, it was not made clear to test takers which were the regular items and which were the test items. As such, there was no time restriction for the items in this study, since they were administered after the SEB. During the testing period, all individuals called to the admission test received written information telling them that they would be included in a research study with the aim of developing a new test for measuring cognitive ability.
Sample and Data Collection
The study included test takers for admission tests for basic military training in Sweden. In Sweden, nearly all individuals of conscription age are required to complete an at-home screening survey administered by the Swedish Defence Conscription and Assessment Agency to assess eligibility for military service. The survey includes questions regarding health, education, and physical fitness. All test takers in this study had successfully completed the initial screening survey before testing, confirming their basic eligibility for conscription. They were either called to muster or applied voluntarily.
A total of 1,262 test takers were included, comprising 902 men and 360 women. The predominant ages of participants were 17 to 19 years old, accounting for 1,146 individuals, while 116 were older. The majority of the test takers, totaling 1,079, were conscripted, with the remaining 183 applying voluntarily. Moreover, most participants, 1,110, were native Swedes, whereas 162 had foreign backgrounds. Most participants, 937, had parents born in Sweden, but 152 had 1 parent who was born in another country, and 173 had 2 parents born in another country.
Paper Fold and Cut (PFC) test
The PFC test is a multiple-choice test developed for the Swedish Defence Conscription and Assessment Agency to assess the test taker’s logical ability. Similar tests have been employed elsewhere to assess logical ability. Versions of paper-folding tests are usually said to tap primarily into visualization skills (French et al., 1963; Garcia-Segarra et al., 2024), but both Kyllonen et al. (1984) and Burte et al. (2019) have demonstrated that analytical strategies are also used to solve items with paperfolding and punched holes. The use of analytical strategies over visualization skills seems to be especially important with more difficult items (Kyllonen et al., 1984). Test takers use heuristics and strategies such as counting the number of folds and punches, and eliminate options through reasoning (Burte et al., 2019); these are all examples of logical ability. Since the PFC test includes cuts with different shapes and not merely holes of the same shape, as is the case in tests with paper folding and punched holes, it is anticipated that it will indicate logical reasoning more than visuospatial abilities.
The PFC test presents test takers with a primary image featuring a piece of white paper, which is folded several times and subsequently cut. The test taker is then tasked with identifying the correct unfolded configuration from four alternatives. Figure 1 shows an example of a task.
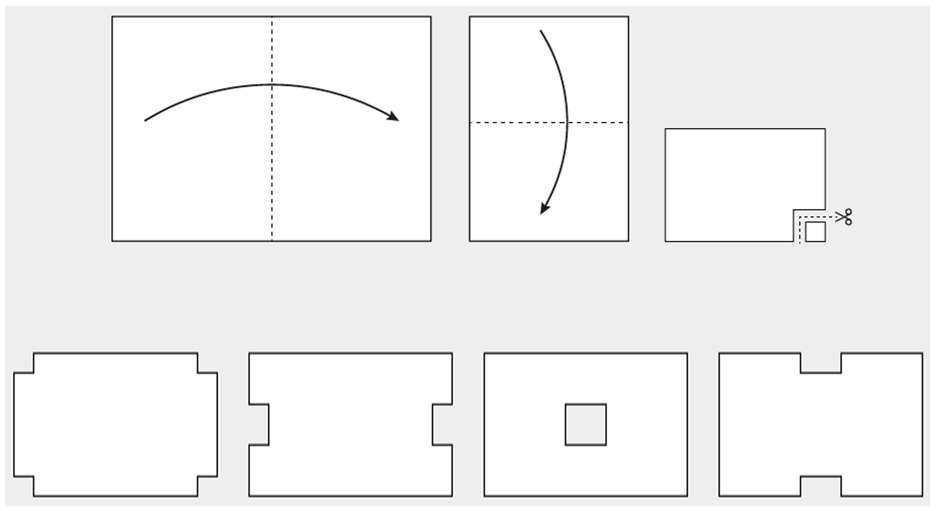
The figure depicts a simplified version of a PFC-item for illustrative purposes. The upper portion of the figure is the main picture, and below are the four response alternatives.
The PFC test utilized in this study comprises 14 items. The PFC items were expected to form a hierarchy based on their anticipated difficulty. The expected hierarchy was as follows: Each item was assessed for number of operations (the combined number of folds and cuts in the main picture, ranging from four to seven operations). The more operations, the more difficult the item was expected to be. There are six items with four operations, four items with five operations, two items with six operations, and two items with seven operations. Within each of these groupings, items with more folds than cuts were expected to be harder. If two or more items were in the same grouping, cuts to the interior of the paper were expected to make an item more difficult, whereas cuts to an exterior corner were expected to make an item easier.
However, it should be noted that this hierarchy was not the actual order that items were presented to test takers. The reasoning behind the item sequencing presented to test takers, and the number of items with varying folds and cuts, is unknown to the authors. Similarly, the authors are unaware how distractors were designed and placed.
Data Analysis
Rasch analyses were performed in Rasch Unidimensional Measurement Model 2030+ (RUMM) software (version 5.8.1). The Rasch model (Rasch, 1960) for dichotomous items is a simple logistic function:

where P is the probability that test taker i, with latent trait
Rasch analyses examines whether the data fits the model well enough to be considered a satisfactory measurement. These analyses include tests for item-model fit using fit residuals and chi-squared statistics, and visual inspections of ICC curves. They also include residual correlation to assess local dependency (LD) and differential item functioning (DIF) to assess whether items work similarly for different subgroups. Furthermore, they include principal component analysis with t-tests to ascertain whether there is one unidimensional trait, person separation index (PSI) to assess reliability, and evaluations of targeting of items to persons and the expected item hierarchy. In addition, as this study deals with a multiple-choice test, the effects of guessing were also evaluated.
Item-Model Fit
Item-model fit was statistically evaluated using item-fit residuals and Chi-square statistics and complemented with visual inspections of the ICC curves. Fit residuals were transformed to approximate z-scores, with a mean close to zero and a standard deviation of approximately one. Residuals exceeding plus or minus 2.5 suggest potential misfit to the model, with high negative residuals indicating over-discrimination, and high positive residuals indicating under-discrimination (and a sign of guessing in multiple choice items, see below), the latter being considered more problematic. The Chi-square test of fit evaluates whether items function consistently across the latent trait continuum, aiming for non-significance, which would indicate that the items fit the Rasch model and discriminate between test takers in a predictable manner along the continuum (Andrich & Marais, 2019). The evaluation of item fit should not be axiomatic, but interpreted in relation to other aspects of the item (Tesio et al., 2023).
With large sample sizes, the fit statistics may be inflated. When the sample size is very large, the power to detect misfit is so great that even minor deviations from the Rasch model may indicate misfit (Bergh, 2015). One way to work around this, and estimate the true fit to the Rasch model, is to use a post-hoc adjustment of the sample size, either by using the RUMM adjustment function or a random sample approach (Bergh, 2015). With smaller sample sizes, using a random sample approach is advisable. A commonly inferred rule of thumb about the sample size for fit statistics is N = 500 (Hagell & Westergren, 2016). Thus, in post hoc iterations a random sample of 500 was applied, using an average of 10 iterations.
Distractor Analysis
Distractor plots were utilized to assess the quality of the individual distractors, and subsequently the quality of the item. In traditional test theory, one would simply compare the frequency with which each answer has been selected. With latent trait theory, as in Rasch analyses, it is possible to plot the relationship between the test takers’ ability, and their propensity to select a specific answer, in a distractor plot (Gierl et al., 2017). This trace line may be useful in discerning functioning and nonfunctioning distractors along the ability continuum. Furthermore, analyses of distractors are crucial in the development to understand why test takers make errors, by supporting diagnostic inferences about test performance (Gierl et al., 2017).
Local Dependency (LD)
In any test, items are expected to be as independent of each other as possible because each item should contribute to the underlying trait. To evaluate local dependency, residual correlations were compared against a relative cut off, using .20 the average correlations. Anything above the cut off would be considered local dependence (Christensen et al., 2017), indicating that after accounting for the Rasch model, there is no further pattern among the residuals (Andrich & Marais, 2019).
Differential Item Functioning (DIF)
DIF implies that, given the same value of the latent trait (in this case logical ability), the responses expected from test takers from different subgroups are different (Andrich & Hagquist, 2012). This would be a violation of invariance because items work differently for test takers with different backgrounds (Andrich & Marais, 2019).
In the analysis, DIF was tested statistically using ANOVA of residuals, which tests the fit of an item across the full range of the latent trait simultaneously in one analysis to allow for the detection of both uniform and non-uniform DIF effects (Andrich & Hagquist, 2015). Bonferroni correction was applied due to multiple testing, with a significance level of 0.01. Interpretations were complemented by visual inspection of the ICC. DIF was tested for gender (male or female), age group (17–19 years or over 20 years), type of test taker group (conscript or volunteer) and background (born in Sweden or abroad, and birthplace of parents—both parents born in Sweden, one foreign parent, or two foreign parents).
The sizes of different subgroups varied greatly; for example, there were 360 women and 902 men. To ensure these differences did not affect the DIF analyses, an additional DIF analysis was run, applying a random sample, to even out the sizes of subgroups. This was done by utilizing the number of test takers in the smallest group, and drawing a random sample of the same size from the largest group, in line with the approach of Hadžibajramović et al. (2024), Thus, in the case of gender, all 360 women were compared to 360 randomly selected men.
Unidimensionality
The Rasch model assumes that the test measures only one single underlying trait (Andrich & Marais, 2019), that is, that the test is unidimensional. Unidimensionality was evaluated by a Principal Component Analysis (PCA) of item fit residuals; the first principal component was used to order items into positively and negatively loaded items, forming two subsets (Smith, 2002). This was followed by a comparison of the person abilities from each subset by using an independent t-test. Excluding extremes, the percentage of tests outside the range −1.96 to +1.96 should not exceed five percent. This means that we do not want to find any patterns in the residuals other than that of the single underlying logical ability (Andrich & Marais, 2019).
Reliability
Person separation index (PSI) was used to assess the internal consistency. The PSI is an indication of how reliably the persons are separated by the test (Andrich, 1982). The interpretation of the PSI is similar to that of Cronbach’s alpha, commonly used in Classical Test Theory, both are values between 0 and 1, but the PSI is based on person location rather than sum score which is used for Cronbach’s alpha (Andrich & Marais, 2019; Tennant & Conaghan, 2007). Generally, .70 is the minimum acceptable level of reliability for group measurements and .90 for person measurements (Nunnally, 1978).
Targeting of Persons and Items
Targeting was assessed visually by looking at the relative distribution of persons and items on the logit scale, ensuring that the scale items appropriately match the person sample within the dataset.
Expected Item Hierarchy
Another way of checking the construct validity of the scale is to compare the expected ordering of items to the actual difficulties of the items (Boone, 2020). If the expected order of item difficulty matches the actual order of item difficulties, this could be seen as an indication that the theoretical basis is valid.
Guessing
The guessing analyses for the PFC test followed Andrich et al. (2016) guidelines. Test takers of lower ability may guess the correct response in about 25% of cases with four response categories. Therefore, guessing affects the whole scale defining the trait because it makes more difficult items appear easier than they are. As a result, the estimation of item difficulty is a bit skewed from the start when guessed answers are included in the initial Rasch analysis. For this reason, a tailored analysis was performed, to assess each test taker’s probability of answering an item correctly, and to remove responses that were likely to have been guessed. Since item difficulty is slightly underestimated and person ability slightly overestimated when guessing is included in the initial analysis, the cut off was set at .30 instead of .25, in line with Andrich et al. (2016) recommendations. Subsequently, an origin-equated analysis was performed. All Rasch analysis is set at an origin, usually zero, from which all item difficulties are calculated. Each dataset thus has its own origin. To compare two datasets, they both need a similar point of origin. This is facilitated in the origin-equated analysis by utilizing the easiest items in the tailored analysis, which are expected to have minimal guessing influence, making comparison to the initial analysis fairer. Then, the initial data is reanalyzed using the new origin, obtained from the tailored analysis. The final step was to apply an all-anchored analysis, where all item difficulties are anchored to their estimates in the tailored analysis, again including the guessing responses.
Results
In the initial analysis with all 14 items, item 6 and 14 showed significant misfit to the Rasch model. Results are presented with and without these two items in Table 1. A full summary of the analysis, with all 14 items and iterations when removing items 6 and 14, can be found in Supplemental Material 1. In the subsequent section of the paper only the remaining 12 items are reported.
Average of Random Sample with N = 500, 10 Iterations.

Fit residuals outside the range of ±2.5 are marked in bold.
With Bonferroni correction, the p-values were .000714 for 14 items, .000769 for 13 items, and .000833 for 12 items. None of the Chi-square tests were significant.
Item-Model Fit
Items were assessed visually by examining the ICC curves, that is, the distribution of the observed proportions in relation to the expected curve. Special attention was given to items that showed statistical misfit. All items, except items 6 and 14, had satisfactory ICC curves. An example of a satisfactory ICC curve is shown in Figure 2a for item 7, while Figure 2b and c show the ICC curves for overfitting item 6 and underfitting item 14.

Item characteristic curves (ICC) plots illustrating model fit in selected items. The y-axis shows the probability of a correct response (ranging from 0 to 1), while the x-axis represents person ability measured in logits. The solid line represents the expected response curve, while the dots represent the empirical distribution across the ability continuum. (a) Item 7: Example of a good model fit: the empirical distribution closely follows the expected curve. (b) Item 6: Over discriminating item: the empirical distribution is steeper than the theoretical curve. (c) Item 14: Under discriminating item: the empirical distribution is flatter than the theoretical curve. (d) Item 10: An item showing moderate deviations from the theoretical distribution but with a non-significant ChiSq test and fit residuals within the range of +2.5.
Items were statistically evaluated for fit to the Rasch model by utilizing item fit residuals and chi-square goodness of fit tests, presented in Table 1. A post hoc random sample was applied because the misfit of items might be inflated due to large sample size, which could make even small or insignificant deviations from the model flag up as misfits. With a random sample of N = 500 applied ten times, the average deviations from the Rasch model were summed.
The first iteration, utilizing all 14 items, showed that 2 items departed significantly from the Rasch model, with item 6 having a negative fit residual of −3.03 and item 14 having a positive fit residual of +4.31. In the second iteration, item 14 was removed, causing the overall fit to improve slightly. In a third iteration, item 6 was removed, all other item fits being about the same as before. In a fourth and final iteration, both item 14 and 6 was removed with the result that one item still slightly exceeded the limit of ±2.50 for fit residuals (item 11 had a fit residual of +2.98). As there were no significant deviations in Chi-square, and the shape of the datapoints in the ICC curve was satisfactory, the item was kept. A comparison was also made to item 10, which did not show significant misfit, but had a worse shape in the ICC curve (Figure 2d).
No significant deviations were identified with the Chi-square test in any of the iterations utilizing an average of 10 iterations with a random sample where N = 500.
Distractor Plots
Distractor plots were assessed visually. We generally wanted the correct answer to follow the theoretical curve to some extent, and for the correct answer to increase in use along the ability continuum. This would mean that the more able the test taker, the less inclined they would be to choose one of the distractors. All items met these criteria for distractors. One example is provided in Figure 3, showing that the correct alternative becomes a more probable choice the more able the test taker. Distractors 3 and 4 seem to be good distractors—attracting more than 30% of test takers at some point along the continuum. Distractor 2 is a bit weaker, never getting above 30% (which could be argued to be below the chance of guessing).
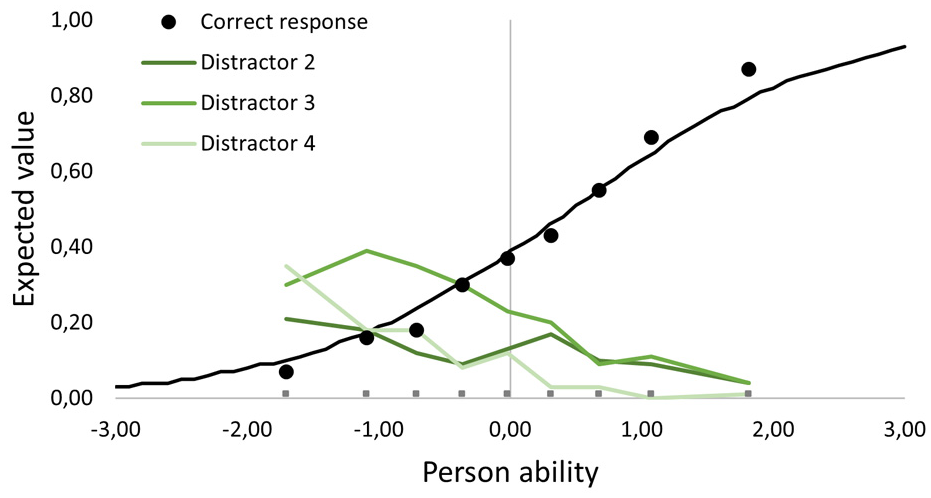
Distractor plot for a PFC item. Black dots indicate correct response, and the three green lines indicate distractor curves, across the ability continuum.
Local Dependency
No local dependency was detected using a relative cut off, based on .20 above the average residual correlation. This indicates that all items in the PFC test were independent of each other.
Differential Item Functioning
There was no DIF identified for gender (male or female), age group (17–19 or older), selection group (conscript or volunteer), nor background (Swedish or foreign background of test taker or parents). Nor was any DIF identified in the additional analyses, utilizing a random sample, making the subgroups equal in size (subsamples of 360, 116, 183, and 152 test takers respectively). This indicates that all items work in the same manner along the ability continuum for all test takers, irrespective of these background variables.
Unidimensionality
The independent t-test of the residuals of the first principal component showed that only .86% of tests were outside the range −1.96 to +1.96, excluding extremes. This proportion does not exceed the limit of 5%, which would indicate a violation of unidimensionality. Thus, it can be assumed that the PFC test measures a unidimensional trait.
Reliability
The PSI of all twelve items was .67 including extremes (and .59 excluding extremes). This implies that the recommended minimum acceptable level of reliability (.70) was not reached.
Targeting
The targeting of items to persons was satisfactory. Mean person measure was .06 (SD 1.31), indicating that the difficulty of the items centered on the test takers’ abilities. However, the item range was quite narrow, ranging from −1.0 logit to +0.93 logit. This means that there are test takers with abilities outside this range, whose abilities cannot be accurately assessed. Figure 4 presents items visually in relation to their difficulty.

Person and item distribution on the logit scale with twelve PFC items.
Item Hierarchy
The expected item hierarchy was compared to the difficulty of the items expressed on the logit scale and is shown in Figure 5. The vertical lines in Figure 4 indicate each grouping of operations, where items 1 to 6 have 4 operations, items 7 through 10 have 5 operations, items 11 and 12 have 6 operations, and items 13 and 14 have 7 operations. Items 6 and 14 are marked in red as they were removed from the analyses due to misfit. The average difficulty among items with 4 operations was −.30; for items with 5 operations the average difficulty was +.14, and for items with 6 operations it was +.20. For 7 operations there was only one remaining item with a difficulty of +.93. Thus, grouping items by number of operations seems to be a preliminary way of predicting item difficulty. Item difficulty increases with the number of operations.

Items are presented in the expected order of our formulated hierarchy. Each clustering of operations is indicated by vertical lines.
However, within each grouping of operations (see Table 2), we were unable to predict the difficulty of items with the applied theory of item hierarchy. For example, item 2 is substantially easier than item 1, even though item 1 has cuts to the exterior sides of the paper, which we anticipated would make the item easier. Item 2 has cuts to the interior of the paper, which we anticipated would make the item more difficult. Another example is items 9 and 10, which have the same number of folds and cuts. The placements of the cuts differ. Item 10 has two cuts to the interior of the paper and item 9 has one cut to the interior and one cut to the exterior of the paper. We anticipated that this would make it easier than item 10. However, on closer inspection it is reasonable to assume that the shape of the cuts also plays a part in determining the difficulty of the items.
Number of Operations, Folds, and Cuts for Each of the 12 PFC Items (Items 6 and 14 are Excluded).

Guessing
Removing responses due to potential guessing in the tailored analysis, revealed no effects on the estimates of task difficulty (Figure 6a). Subsequently, person abilities were equally estimated with a tailored analysis, origin equated items, and all items anchored; the latter is shown in Figure 6b. The illustrations are shown for the PFC test with 12 items (i.e., with item 6 and 14 removed).
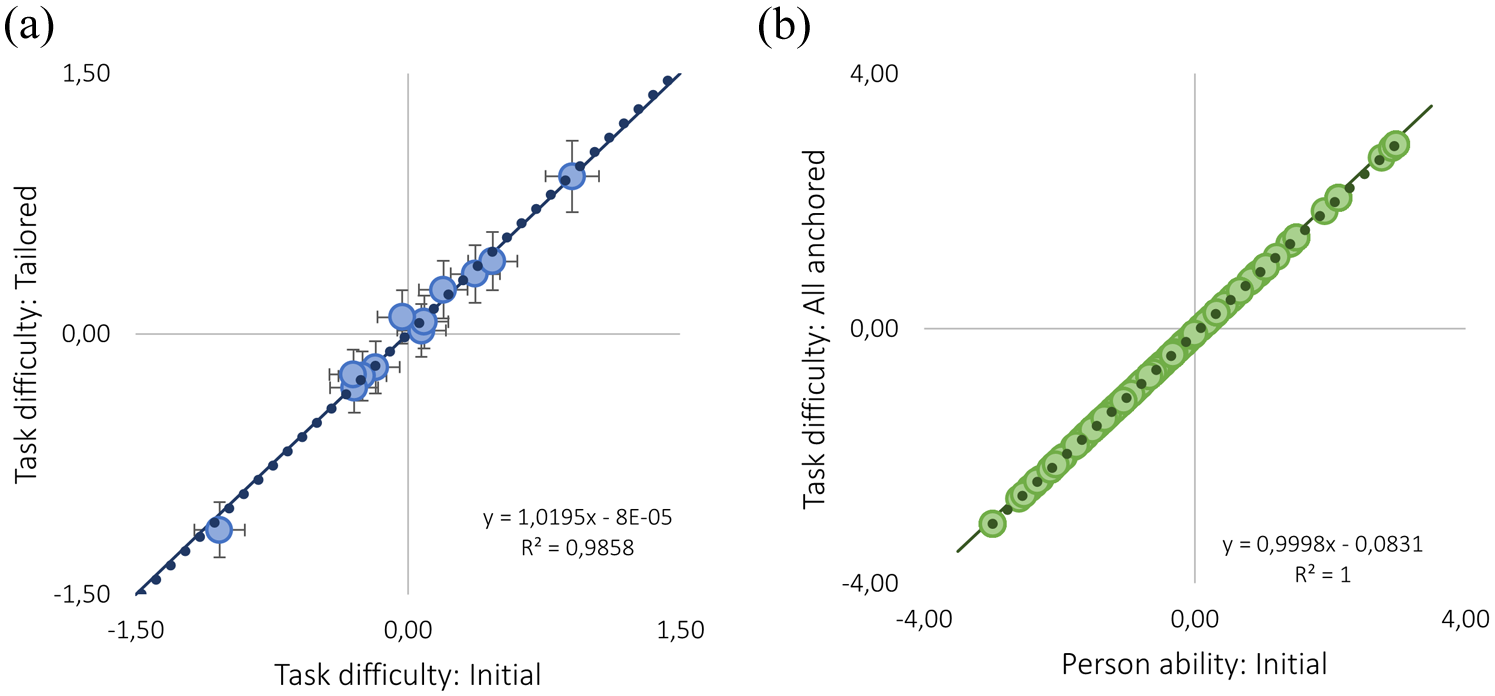
(a) The task difficulties of the initial analysis are plotted against the task difficulties in the tailored analysis. (b) Person ability in the initial analysis is plotted against person abilities in the anchored analysis.
Discussion
Overall, the final PFC test with 12 items showed good measurement properties, meeting the criteria for the Rasch model with only minor item-fit violations for fit residuals (but not for Chi-square), no local dependency, no DIF, and assumed unidimensionality. This means that items were of adequate difficulty (there were both easier and slightly more difficult items) and that items work in the same way for all test takers, irrespective of background. Because the data fits the Rasch model, the scale of the test can also be considered linear rather than ordinal, enabling fair comparisons of test takers’ abilities.
The analysis of item hierarchy revealed that the clustering of items based on the number of operations was successful, while the items within each cluster did not consistently align with our formulated hierarchy. This means that each cluster of items was slightly more difficult than the last, but the difficulty did not consistently increase from item to item. This suggests that item difficulty is influenced by factors other than simply the number of folds and cuts, and the placement of cuts. One such factor that warrants further investigation is the shape of cuts, as indicated by the comparison between items 9 and 10, which otherwise have similar characteristics, apart from the shape of the cuts.
While the authors are unaware how distractors were designed and placed, the literature agrees that distractors affect both the quality and difficulty of an item, for example through the degree of similarity between the distractors and the correct response (cf. Gierl et al., 2017; Thissen et al., 1989), where the most similar distractor might be categorized as a “strong distractor.” The relative placement of such a strong distractor in relation to a correct response has also been shown to influence the difficulty of an item (Bar-Hillel & Attali, 2002; Shin et al., 2020). In the same way that Burte et al. (2019) talk about number of relevant folds in the Paper folding test (rather than the effective number of folds), the shape of the cuts in the PFC test should be investigated further—for example regarding symmetrical or asymmetrical cuts. Could it be that, when unfolding the paper, asymmetrical cuts, such as a right-angled triangle, are more difficult to discern than an equilateral triangle?
It could be argued that one of the apparent drawbacks of the PFC test is the relatively low PSI (.67), which would be deemed insufficient on its own, with the conventional lower limit being .70 for group measurements and .90 for person measurements (Nunnally, 1978). This is a consequence of the test’s relatively narrow item range (ranging from −1.04 to +0.90 logits) not allowing for more separation between test takers. Even though the targeting is well centered on the test takers’ abilities, it does not cover the whole range of abilities, meaning that individuals above or below this span do not have accurate estimates of their abilities. However, the PFC is not intended to be used on its own; it is rather one of several tests intended to assess cognitive abilities used by the Swedish Defence Conscription and Assessment Agency. As such, the PFC test in its current state is intended to be used alongside other logical, visuospatial, and verbal tests to jointly measure the test taker’s cognitive ability. Therefore, the relatively low PSI needs to be evaluated in this light. The PSI is directly related to the number of items in a test, and because time restrictions limit the number of items in each subtest, each subtest in the new SEB cannot be sufficiently reliable on its own. Furthermore, more items are typically more challenging to fit a unidimensional model, as in this case, where item 6 and item 14 lower the validity. However, adding well-constructed items can also improve the scale’s ability to capture a broader range of the intended trait, contributing to a more comprehensive measurement. We argue that validity is paramount, and reliability is contingent upon validity (Johansson et al., 2023).
As for guessing in the PFC test, when responses that could have been guesses were omitted (Andrich et al., 2016), estimates of task difficulty were not affected. Subsequently, estimates of persons’ abilities remained stable when anchoring the task difficulties. Nevertheless, it should be noted that no analysis can identify which responses are guesses and which are not; some test takers will always gain higher estimates of their logical ability due to guessing, not because of their ability alone. This is, of course, a limitation when attempting to ensure fair testing. Importantly, guessing is assumed to increase when the difficulty of the item relative to the test taker’s ability is higher (Andrich & Marais, 2014; Andrich et al., 2016). This means that for any item, the number of guesses will be higher among test takers of lower ability, and more difficult items will generally have a higher proportion of guesses than easy items. It has been proposed that guessing is an interaction between the propensity of an item to provoke guessing, and a person’s proclivity to guess (Smith, 1993). While it is unknown which responses are guesses and which are not, items with more misfit and flatter dots than expected in the ICC can be a sign of guessing (Andrich et al., 2012). Consequently, omitting item 14 is also an attempt to minimize unfairness due to potentially provoking more guessing.
Referring to the beginning of the paper and the criticism that intelligence tests are potentially biased and or unfair, the PFC test is shown to be an invariant test in that it lacks any DIF issues and is not biased towards any subgroup of test takers for conscription. Another indication of invariance is the demonstrated unidimensionality of the PFC test; there are no other patterns in the data after accounting for the Rasch model. This indicates that the PFC test functions similarly for test takers with different backgrounds (covering age, gender, immigration background, and whether they were volunteers or conscripts)—making it a fair and unbiased test for conscription.
Methodological Considerations
This study has some methodological considerations. A first limitation is the unknown factors in the design process. For example, there was no systematic ordering of items when they were tested. Furthermore, items were not systematically varied in terms of placement and shape of distractors during the design phase. A second limitation is the unbalanced subgroups. For example, there were 902 men and only 360 women; there were 1,110 native Swedish test takers and only 152 test takers with a foreign background. This has implications when evaluating DIF, for example. We tried to amend this by adjusting the sample sizes to the size of the minority subgroups. However, neither approach (using all test takers or the adjusted subgroup sizes) indicated any significant DIF. Thirdly, there are no official statistics of the number of people with an immigrant background who undergo these musters, because this information is not routinely collected during the process. This information has been gathered by ethical consent within the scope of this project. Thus, we do not know whether these statistics reflect the usual number of those with an immigrant background undergoing these musters. Furthermore, as the statistic is self-reported, individuals may interpret the question of background differently, even though efforts were made to ensure consistent interpretation across participants. Bearing in mind the criticism related to unfair testing, we stress that this is an important variable to monitor, to ensure unbiased testing in the future.
Lastly, an additional consideration is the choice of the Rasch model, which belongs to the Item Response Theory (IRT) methods family. The Rasch model shares structural similarities with other IRT models in its mathematical formulation. However, a key distinction lies in the philosophical and methodological foundations of the Rasch model, which aligns with measurement science by evaluating the extent to which observed data conform to the model, rather than fitting the model to the data (c.f., Andrich & Marais, 2019; Hobart & Cano, 2009). This includes a stricter view of invariance, which is a testable property emerging from the model’s use of sufficient statistics—where person ability and item difficulty are estimated independently. Nevertheless, guessing is a well-known concern in multiple-choice formats, and the Rasch model—being a one-parameter model—does not account for a guessing parameter (c.f., Andrich & Marais, 2014; Andrich et al., 2016; Smith 1993). To address this, we conducted a tailored analysis to evaluate the potential impact of guessing in the PFC test. The results from the final set of 12 PFC items indicated no negative effects attributable to guessing, thereby supporting the suitability of the Rasch model for this study.
Further Research
This study represents an initial step towards ensuring that the PFC is a fair and reliable assessment tool for conscription. The next phase of research will focus on evaluating its practical effectiveness in conscription selection processes, specifically how it works in conjunction with the other SEB tests regarding interpretability, practicality, and the reliability and validity of the overall testing process. Future research will examine the predictive validity of the SEB and with larger samples, subgroups such as test takers with an immigration background will be better represented, allowing for more reliable DIF analyses.
Further research is also recommended to deepen the understanding of factors influencing the difficulty of PFC items, thereby enabling more efficient and theory-informed test development. In particular, gaining greater insight into the underlying cognitive structures and principles that govern item ordering may help explain variation across tasks attributed to this ability (Embretson, 1998; Wilson, 2023). To achieve this, a larger item pool is needed, with systematically controlled variations in folding, cuts, and geometric features. Moreover, test-takers may adopt different problem-solving strategies depending on how they process the PFC tasks. For instance, more logical driven strategies such as rule identification, relational logic, and symbolic manipulation (Embretson, 1998, 1999) or more visually based strategies, such as comparing the figure holistically or focusing on specific components (Cooper, 1976). These distinct cognitive approaches warrant further investigation to better understand their influence on item difficulty.
Conclusions
In conclusion, our analysis shows that the PFC test is a fair and robust assessment tool for conscription, which demonstrates good targeting, absence of DIF and offers valid measurements of logical abilities. Consequently, the PFC test is expected to be a valuable addition to the forthcoming SEB 2025. Future work will have to assess how the SEB 2025 tests will work together by evaluating the measurement properties and qualitative composition of the overall test.
This article highlights several important methodological questions relating to multiple-choice items in general, and the PFC test in particular. Although guessing had no significant impact on the results in this test, it remains an inherent risk in tests with multiple choice items, and the effects of guessing need to be acknowledged and managed in such tests. The research initiated in this study into understanding the factors that influence the difficulty of PFC items suggests that the hierarchy of operations provides a preliminary categorization. However, further work is required to gain a more comprehensive understanding of what makes PFC items more or less difficult. Additionally, this study indicates the importance of distractors in multiple-choice items, with some comparisons between item design and distractor effectiveness. Future research should delve more deeply into this topic, emphasizing factors in distractor design, such as their similarity or dissimilarity to the correct response, and potentially examining the sequencing of distractors.
Supplemental Material
sj-docx-1-sgo-10.1177_21582440251372266 – Supplemental material for Fair Assessment of Logical Ability in Military Selection: A Rasch Analysis of a Paper Fold and Cut Test
Supplemental material, sj-docx-1-sgo-10.1177_21582440251372266 for Fair Assessment of Logical Ability in Military Selection: A Rasch Analysis of a Paper Fold and Cut Test by Emelie Wahlkrantz and Jeanette Melin in SAGE Open
Footnotes
Acknowledgements
The authors would like to express their appreciation to the whole research team working to update the existing Swedish Enlistment Battery: Emma Oskarsson, Dr. Maria Fors Brandebo, Dr. Stefan Annell, Dr. Eva Johansson, Prof. Gerry Larsson (Swedish Defence University), and Dr. Daniel Bergh (University of Gothenburg), for valuable feedback during the study.
Ethical Considerations
The project was approved by the Swedish Ethical Review Authority, ref. 2019-03576.
Consent to Participate
The requirement for informed consent to participate was met by informing test takers that the regular testing (SEB 2000) was extended to include a subtest for developmental purposes. However, as test takers were undergoing the musters, which are obligatory under Swedish law, they did not have the formal option to withdraw from the study. This was supported by the ethical consent of the Swedish Ethical Review Authority, ref. 2019-03576.
Consent for Publication
Not applicable.
Author Contributions
The manuscript was designed by EW and JM. EW conducted the analyses and JM validated the analyses. EW drafted the manuscript. JM edited and revised the manuscript. All authors have read and agreed to the published version of the manuscript.
Funding
The authors disclosed receipt of the following financial support for the research, authorship, and/or publication of this article: This work was supported by the Swedish Defence Conscription and Assessment Agency. This study is part of the Swedish Defence Conscription and Assessment Agency’s work to update the existing Swedish Enlistment Battery.
Declaration of Conflicting Interests
The authors declared no potential conflicts of interest with respect to the research, authorship, and/or publication of this article.
Data Availability Statement
Data sharing not applicable to this article as no datasets were generated or analyzed during the current study.
Supplemental Material
Supplemental material for this article is available online.
References
Supplementary Material
Please find the following supplemental material available below.
For Open Access articles published under a Creative Commons License, all supplemental material carries the same license as the article it is associated with.
For non-Open Access articles published, all supplemental material carries a non-exclusive license, and permission requests for re-use of supplemental material or any part of supplemental material shall be sent directly to the copyright owner as specified in the copyright notice associated with the article.