
Abstract
This study employs a natural language processing framework to explore how sentiment and tone change in corporate communication in different market conditions. Using sentiment and tone from the text data of SEC filings (10-Q and 10-K filings), fundamental data, and stock returns, we find that expansionary and recessionary market conditions can cause a change in sentiment and tone in corporate communications. The use of negative sentiment, uncertainty, and strong model tone increases during recessionary periods, while constraining tone decreases. Sentiment and tone can play a crucial role in explaining stock returns. For example, we find that positive sentiment has a positive relationship with stock returns regardless of market conditions. The significance of other sentiments and tones varies depending on the market conditions. In addition, different filing types can result in different relationships between sentiments and tones and stock returns. The study has implications for investors, corporate managers, and regulators. They can use these results as guidelines for their decision-making related to corporate communications.
Keywords
Introduction
Corporate communication that provides clear, transparent, and consistent information about a company’s activities, strategies, and financial results is crucial in helping investors understand an organization’s performance (Dawkins, 2005; Hyland, 1998). Verbal and written communication via annual reports, press releases, and shareholder meetings impacts investor opinion (Guo et al., 2021). The communication between investors and interactive platforms for investors usually takes 2 weeks to answer, which improves stock price formation (Lee & Zhong, 2022). Therefore, effective communication between organizations allows investors to be informed when making investment decisions (Baier et al., 2020; Hoang & Phang, 2021).
CEOs can voice their firms’ profitability for investors through annual reports and CEO’ letters to shareholders (Alshorman & Shanahan, 2022). Investors can use these reports to analyze trends in revenue, expenses, and profits over time, allowing them to gauge a company’s growth trajectory and operational efficiency (Rjiba et al., 2021). Investors can also compare annual reports for firms within the same industry, helping them make informed decisions about where to allocate their resources (Palepu et al., 2020). In addition, Rahman (2023) finds that a negative tone in U.K. annual reports has a significant negative impact on earnings persistence in both profit and loss firms. Conversely, a positive tone is unrelated to earnings persistence in profit firms but is negatively associated with earnings persistence in loss firms. These financial reports help investors assess a company’s profitability and liquidity, which can affect investor confidence and credibility (Cade, 2018).
Moreover, companies publish annual reports as part of their investor relations (IR; Hoffmann, 2018). IR professionals regularly contribute to company activities, strategic initiatives, and financial results (Brown et al., 2019). While IR communications drive financial stakeholders to invest with trust and understanding (Brennan & Merkl-Davies, 2018), analyzing financial reports can be time-consuming and costly for shareholders. Employing natural language processing (NLP) can reduce the time shareholders take to analyze company reports and enhance the understanding of the company.
Given recent advancements in machine learning and artificial intelligence, there has been a rise in NLP research advancement. Pengnate et al. (2020) use an NLP approach to identify managers’ sentiments during the 2008 to 2009 financial crisis. Cao et al. (2021) explore the interaction between firms’ disclosures and their competitors’ actions. Jiang, Yang and Zhang (2023) study how corporate communication changes when firms know that machines read their disclosures. Cao, Jiang, Wang & Baozhong (2023) combine sentiment—determined via text analysis from Loughran and McDonald (2011)—with fundamental and industry data to predict stock prices. Given recent advancements in machine learning and artificial intelligence, there has been a rise in NLP research advancement. This study fills the gap in existing NLP studies in finance and corporate communication by examining how corporate communication evolves during periods of economic expansion and recession over extended periods. This study also examines the relationship between corporate communication tones and sentiments and stock returns under various economic conditions. Additionally, it analyzes the relationship based on different types of reports.
The theoretical foundation of this study is the Upper Echelons Theory from Hambrick and Mason (1984). The theory suggests that top managers’ characteristics and discretion can shape a company’s strategies and performance. The theory also suggests that top managers’ characteristics and discretion within the company can affect the relationship between the interpretation of top managers’ communication and the company’s performance outcomes (Crossland & Hambrick, 2011; Pengnate et al., 2020). In addition, theoretical models explore the interaction between textual financial information and asset prices, which can reflect the company’s financial outcome. For example, investors may underreact or overreact to new information from corporate fillings, such as in the theoretical model of Barberis et al. (1998). Investors may underreact to earning announcements, which can be observed from the company’s fillings. They may also overreact to the good and bad news about the company. These underreactions and overreactions may affect stock returns. Hirshleifer and Teoh (2003) discuss how investors have limited attention and constrained time to process financial information disclosers. Instead of thoroughly analyzing the document alone, they can rely on simplified signals such as sentiment from corporate fillings. These activities can affect stock price reactions. As we discussed, we explore how stock prices react to sentiments and tones from corporate communication via corporate fillings in 10-K and 10-Q.
The theoretical foundations can extend to asset prices under different market conditions. Sentiment and tones can be thoughts of factors relating to asset prices in the market. Cochrane (2005) shows that the asset pricing model can differ in market conditions. Therefore, we explore the reaction of stock returns in both expansionary and recessionary periods. Kothari and Shanken (1992) show the interaction between asset prices and risk factors under different market conditions. Empirical studies following from these theoretical models can reveal the structural changes of factors in different market conditions. For example, Daniel and Moskowitz (2016) show that the behavior of momentum factors can change tremendously during market downturns. Nettayanun (2023) shows that structures of factors change in different market conditions. This study takes another angle by using tone and sentiment factors coupled with traditional asset pricing factors to interact with stock prices in different market conditions.
Following the theoretical motivations, this study explores the corporate communication of managers during different market conditions and examines how sentiment and tone relate to stock returns. This study makes three major contributions to the literature. First, it is one of the first studies to analyze corporate communication in different market conditions, extending the research of Pengnate et al. (2020) to cover more recessionary periods. Second, this study explores how sentiment and tone determine to stock returns in different market conditions. Sentiment can help explain with different levels of significance during normal and recessionary periods (Pornpikul & Nettayanun, 2022). Furthermore, financial factors/anomalies behave differently in different market conditions (Nettayanun, 2023). Third, this study is one of the first to use all seven sentiments and tones in the (online) Loughran–McDonald Master Dictionary with Sentiment Word Lists to explore how each interacts with stock prices during periods of expansion and recession. It also explores the response of stock returns to the sentiment and tone in different types of documents (i.e., 10-Q vs. 10-K).
Several interesting results emerge from the study. Negative sentiment, uncertainty, and strong modal tones increase from expansion to recession periods with high levels of significance. The constraining tone is lower in recessionary periods compared to expansionary periods. The behavior of sentiments and tones also changes from expansionary to recessionary periods. For example, negative sentiment is negatively associated with stock returns in recessionary periods but has a positive association with stock returns in overall and expansionary periods. Positive sentiment has a positive relationship with stock returns during different period types. In addition, the type of document (i.e., 10-Q vs. 10-K) can also affect the relationship between sentiments or tones and stock returns.
This study has several implications for investors, corporate managers, and regulators. First, investors can utilize these tones and sentiments as part of their decision-making process when investing in stocks. It can also serve as a warning sign to investors that particular sentiments or tones may have a negative association with stock returns in different economic settings. Second, managers can use these results to demonstrate how stock prices respond to their sentiment and tone under various market conditions. They might use these results as a reference to implement the appropriate sentiments and tones during periods of economic expansion and recession. For example, excessive negative sentiment during a recessionary period can lead to a decline in stock prices. Therefore, it can have a feedback effect on the firm’s capital allocation and decision-making. On the other hand, too much positive sentiment during expansionary periods can also lead investors to become overly optimistic about the firm. Therefore, it can lead to overpricing of the stock, which might not be sustainable for both investors and corporate managers in the long run. Additionally, regulators can utilize this textual analysis to examine the relationship between corporate communication and stock prices under various market conditions to promote long-term market stability.
The remainder of this paper is organized as follows: First, we explore previous studies related to the topic. Then, we explain the data and methodology used in the present study. Next, we report the results, and finally, we conclude the study with a discussion of its implications.
Related Studies
Communication of corporate strategy fosters understanding, alignment, trust, feedback, and motivation among stakeholders, such as in Lock and Schulz-Knappe (2019). Annual or quarterly reports serve as the primary channel through which companies communicate their financial performance, strategy, and prospects to investors. Pengnate et al. (2020) find that companies that provide transparent and comprehensive information in their letters to shareholders or annual reports enhance investor confidence and trust, potentially leading to higher firm performance. Corporate disclosures can serve as important signals to investors (Wichianrak et al., 2022). Managers can signal their commitment to the environment, for example, using environmental disclosures.
The quality and accuracy of information disclosed in annual reports and letters from the CEO can influence investor perceptions and decisions (Caylor et al., 2017; Crossland & Hambrick, 2011). Companies with reliable financial data, insightful analysis, and clear explanations of their performance and strategies may attract more investor interest and support, positively impacting stock returns. According to Hoffmann and Fieseler (2012), company reports serve a strategic function in investor relations, affecting investors’ perception of a firm and contributing to a favorable image. In addition, these reports can also be associated with a company’s stock returns, as in Loughran and McDonald (2011). Financial communications in annual reports often contain news or updates that may affect investor sentiment and market reactions. Positive news such as strong financial results, strategic initiatives, or dividend increases could drive stock prices higher, leading to higher returns. Conversely, negative news or uncertainties disclosed in annual reports may adversely affect stock returns.
In analyzing letters from the chairmen of Fortune 500 firms with both a high return on equity (ROE) and low ROE, Kohut and Segars (1992) identify some common themes including, environmental factors, growth, operating philosophy, product/market mix, unfavorable financial reference, and favorable financial reference. Therefore, financial reports should differ in favorable and unfavorable market conditions that affect financial performance. Laskin and Samoilenko (2014) study narrative strategies for investor communication among newspaper companies. They find that the common strategies emphasize certainty and optimism, which help firms communicate with investors when revenue and readership decline. Laskin (2018) also studies how companies explain underperformance and overperformance in their annual reports. Underperforming companies can provide assurances in their reports, while overperforming companies can highlight their accomplishments.
Computerized content analysis of annual reports offers a powerful and versatile approach for systematically extracting insights, identifying patterns, and making inferences from textual data as in Cao, Jiang, Yang and Zhang (2023) and Cao, Jiang, Wang & Baozhong (2023). By leveraging computational techniques, researchers and analysts can unlock valuable information in quarterly and annual reports and gain a deeper understanding of firm behavior, performance, and communication practices. Quarterly and annual reports provide a concise yet comprehensive overview of a company’s performance, progress, and key developments during the quarter or year. In this study, we use 10-K and 10-Q filings to represent annual and quarterly reports, respectively.
Recent research explores sentiment and tone in the NLP framework. Cao et al. (2021) study negative peer disclosure in the context of firms that post adverse news about their competitors on Twitter, capturing the sentiments of the posts using the financial dictionary from Loughran and McDonald (2011), which we also employ in this study. Jiang, Yang and Zhang (2023) examine how managers change their method of corporate disclosure when they expect their statements to be analyzed by machines. Today, machine downloads comprise more than 85% of the total downloads of corporate disclosure filings. As a result, managers adjust their disclosure formats according to how machines perceive the filings. Cao, Jiang, Wang & Baozhong (2023) also use Loughran and McDonald’s (2011) financial dictionary along with soft information, fundamental data, industry data, including macroeconomic indicators to conduct sentiment analysis and predict stock prices. They find that analyst enhanced by machine learning can increase the stock price prediction capabilities. This suggests that sentiment analysis can serve as a valuable tool alongside fundamental data to explain stock returns.
This study examines two market conditions that may affect managers’ sentiments and tones: expansionary and recessionary periods. Similar to Chung et al. (2012), we define the market conditions according to the National Bureau of Economic Research (NBER) at Federal Reserve Bank of St. Louis (https://fred.stlouisfed.org/series/USREC). The monthly observations are indicated by 0 (1) if the economy is in the expansion (recession) state. Prior studies by Chung et al. (2012), Baker and Wurgler (2006), and Baker and Wurgler (2007) show how investor sentiment can explain stock returns in addition to the fundamental factors examined by Fama and French (2018), Hou et al. (2015), and Charoenwong et al. (2021). Using value and momentum portfolios as dependent variables, Pornpikul and Nettayanun (2022) determine that fundamental and behavioral factors can simultaneously explain portfolio returns. They also find that behavioral factors are more significant when a market panic occurs.
Pengnate et al. (2020) study the relationship between manager sentiments and post-crisis performance in the 2008 to 2009 financial crisis. They find that the manager sentiments have a positive relationship with post-crisis performance. Managers’ positive emotions—decoded from letters to shareholders—influenced firms’ effective performance. According to Sayegh et al. (2004), emotions influence decision-making. Since emotions may be volatile during a crisis, managers may handle situations differently in a crisis than they would during normal periods. Patelli and Pedrini (2014) similarly use letters to shareholders to study the CEO tones during economic crises. They find that in times of economic crisis, sincere communication is used more often than language intended to impress investors. In addition, firms with higher performance have a higher level of optimism in their letters. Patelli and Pedrini also find a relationship between CEO tones and the future performance of companies. They report that optimism and commonality have a significant impact on future returns on assets. Furthermore, while Pengnate et al. (2020) only use the financial crisis of 2008 to 2009 to study corporate communications, we extend their study and examine additional NBER-defined periods of expansion and recession.
Cazier and Pfeiffer (2017) study the repetition of information inside 10-K filings. Managers can use repetition as a strategic means of communication within the document, motivated by litigation concerns or poor performance. However, the repetition of information does not improve price discovery for investors. We extract managers’ sentiments from 10-Q and 10-K documents to examine corporate communication during expansionary and recessionary periods and determine how the different types of documents affect stock returns. Our study enhances the extant research by analyzing the 10-K and 10-Q reports from publicly traded companies in the U.S. market. We also study how the reaction of stock returns varies in different market conditions. Because financial anomalies can behave differently in different market conditions (Daniel & Moskowitz, 2016; Kothari & Shanken, 1992; Nettayanun, 2023), we expect the sentiments and tones of corporate communications to explain stock returns differently depending on the type of document.
Our study has three major research hypotheses. First, managers’ sentiments and tones will differ in different market conditions. Second, the reactions of stock returns to manager tone/sentiment will differ during different market conditions. Third, the interaction between stock returns and sentiment/tone differs according to the document type.
Data and Methodology
Similar to previous studies, we use Loughran and McDonald’s (2011) dictionary for financial sentiment and tone analysis. More specifically, we use the word count from the Loughran–McDonald Master Dictionary Word Lists (https://sraf.nd.edu/loughranmcdonald-master-dictionary/). Company fundamental data and stock-return data are sourced from the Capital Market Research Institute (CMRI) and the S&P Capital IQ. The Loughran and McDonald’s database website provides us with the total number of words and the number of words in each tone/sentiment for each company in different quarters. We measure each sentiment or tone by dividing the number of words associated with a given tone or sentiment that appear in a 10-Q or 10-K report by the total number of words in that report. We take all firm-quarter observations from the Loughran and McDonald database from 1993 to 2021 for tones and sentiments. Then, we match the firm-quarter observations to the fundamental data from the S&P Capital IQ and eliminate observations with missing fundamental data values, yielding 430,234 firm-quarter observations. It is possible that sample selection bias might arise due to the elimination of firms with missing data.
We extend the analysis of Pengnate et al. (2020), who focus solely on the downturn of the 2008 to 2009 global financial crisis, by looking at different recessionary periods. Following Chung et al. (2012), we use the time-series data identifying each month as a recessionary or expansionary period as defined by NBER. The method used to identify market condition is the through method, which captures between a peak and trough of the U.S. Business Cycle Expansions and Contractions data. The expansion and recession data is coded as a dummy variable where 1 represents a recession and 0 indicates expansion.
This study analyzes the data using several econometric models. First, we compare the differences in sentiment and tone in different market conditions. We winsorize the data for returns and the control variables at the 1st and 99th percentiles to eliminate outliers. The control variables include monthly returns, the book-to-market ratio, firm size, the rate of change of assets from previous quarters, and ROE. Sentiment, tone, and monthly returns are expressed as percentages. Size is the log of the book value of assets. Table 1 reports the summary statistics.
Summary Statistics.

Note. This table presents summary statistics of all variables. It includes sample mean (m), sample standard deviation (s), minimum, and maximum. The sentiments are negative sentiment (Negative), and positive sentiment (Positive). The tone variables are Uncertainty, Litigious, Strong modal, Weak modal, and Constraining. The sentiment and tone variables are the total number of that kind of words divided by the total number of words in the documents. Ret1m is the excess returns of one-month returns. BM is the book-to-market value. Size is the log of the total assets. dAsset is the change of total assets in the percentage from the previous year. ROE is the return on equity. MOM is the momentum, which is the past-year returns excluding the most recent month. Recession is the dummy variable, where 0 (1) represents the expansion (recession) state.
Next, we conduct t-tests for each sentiment or tone in different market conditions and report the results in Table 2. These tests can help us determine if managers’ use of tones and sentiments differs during expansionary versus recessionary periods. We then use linear regression with robust standard errors to determine the relationship between different sentiments/tones and returns. However, we do not employ the method of Fama and MacBeth (1973) because the 10-Q and 10-K reports may be released at different times for different companies.

where
The Sentiments and Tones in Different Market Conditions.

Note. This table presents different average sentiments and tones, in each dimension, between expansion and recession periods. It also reports the absolute values of t-statistics whether the means of each sentiment/tone are equal. The sentiments and tones are negative, positive, uncertainty, litigious, strong modal, weak modal, and constraining from the Loughran and McDonald website. The units are in percentages.
Prior studies show that the control variables of firm value, size, investment, and profitability are related to returns (Fama & French, 2018; Hou et al., 2015). Including these variables allows us to compare how different information extracted from financial reports relates to returns. Firm value is measured by the book-to-market ratio, which is the inverse of the price-to-book ratio from the S&P Capital IQ database (i.e., the book value of equity divided by the market value of equity). Size is the log of the market capitalization of each stock. Investment is the total assets of the current quarter less the assets of the last quarter, divided by the assets of the last quarter, or (Assett-Assett-1)/Assett-1 where t specifies the quarter. In other words, investment is the rate of change of assets. Profitability is the ROE, or the net income divided by equity. We also check for possible issues of multicollinearity for our independent variables using the variance inflation factor (VIF). The maximum VIF is 3.69, so multicollinearity is not a major concern for the study. In the next section, we report the results.
Results and Discussions
We first identify differences in sentiments and tones in different market conditions. Then, we determine the relationship between sentiments/tones and stock returns for the overall period, recessionary periods, and expansionary periods. We also conduct a regression analysis to determine whether the relationship varies with document type (i.e., 10-K vs. 10-Q reports).
How Do Sentiments and Tones Differ in Expansionary and Recessionary Periods?
Table 2 shows that negative sentiment and uncertainty, strong modal, and constraining tones differ significantly in the recessionary periods compared to the expansionary periods. Negative sentiment (|t| = 3.012), uncertainty (12.551), strong modal (31.680), and constraining (18.826) are all significant. In contrast, positive sentiment (0.006), litigious (0.724), and weak modal (0.267) are insignificant. The results suggest that corporate communication differs during expansionary and recessionary periods. Managers use a higher proportion of negative sentiment, as well as uncertainty and strong modal tones during recessionary periods.
Managers also use a less constraining tone during times of recession than they do in times of expansion. The result is similar to that of Patelli and Pedrini (2014) who find that CEOs use different tones depending on the revenue/profit growth of their company. Communication becomes more sincere and cautious through difficult economic conditions, which is reflected in our finding that negative sentiment and an uncertain tone are higher during recessionary periods. Recession can lead firms to have lower profits in the next disclosure period. Emotion can play a crucial role in the decision-making of managers during a crisis (Sayegh et al., 2004) and these emotions may take the form of a higher uncertainty tone during recessionary periods.
Laskin and Samoilenko (2014) also show that companies increase the use of certainty during the decline of their business. The result is similar to our study in that managers tend to use a stronger model tone to reassure shareholders. Laskin (2018) finds a greater use of words that correspond with certainty or assurance during periods of underperformance. The reduced use of a constraining tone may help reassure shareholders that the firm will overcome challenges during recessionary periods. Next, we explore how these sentiments and tones determine stock returns in expansionary and recessionary periods.
How Do Sentiments and Tones Determine Stock Returns?
Table 3 reports the results of the multiple regression analysis between stock returns and different sentiment and tone dimensions (i.e., negative, positive, uncertainty, litigious, strong modal, weak modal, and constraining). We also control for variables that may determine returns, including book-to-market ratio (BM), log of market capitalization (Size), investment ([assett−assett−1]/assett−1, dASSET), and ROE (Fama & French, 2018; Hou et al., 2015). We also calculate the VIF for each independent variable to test for multicollinearity. The VIF values for the independent variables—Negative (1.65), Positive (1.42), Uncertainty (3.24), Litigious (1.71), StrongModal (1.32), WeakModal (3.69), Constraining (1.31), BM (1.30), Size (1.43), dASSET (1.02), and ROE (1.15)—do not exceed 10, which indicates there is not a multicollinearity problem. We also calculate the VIF values for the expansionary and recessionary periods. The VIF values are also less than 10 for the two cases. We also use the Breusch-Pagan test to check for heteroskedasticity. There is evidence of heteroskedasticity in the models. Therefore, we implement the linear regression model with robust standard error for the analysis.
Sentiments and Tones with 1-Month Returns.

Note. This table presents the different results from the overall period (first column), expansionary period (second column), and recessionary period (third column). The table reports different sentiments and tones’ coefficients and t-statistics (in the square bracket). The dependent variable is the 1-month returns. The table also includes the number of observations, the R2, and the adjusted R2.
, **, and ***, are for significant levels at .1, .05, and .01, respectively.
Table 3 reveals that for the overall period, both negative and positive sentiments are significant. The uncertainty, litigious, strong modal, weak modal, and constraining tones are also significant. Uncertainty, strong modal, and constraining tones negatively affect 1-month period returns. In contrast, negative sentiment, positive sentiment, litigious tone, and weak modal tone have positive relationships with 1-month period returns. All fundamental variables are also significant.
The results change when we split the study into expansionary and recessionary periods. The expansionary (recessionary) periods consist of 382,621 (47,613) observations. Positive stock returns follow negative and positive sentiments in the expansionary periods. However, during recessionary periods, negative (positive) sentiment is associated with negative (positive) returns. The t-statistic of negative sentiment differs between expansion (5.856) to recession (−7.719). Thus, using words with negative sentiment during a recession has a more significant impact on stock returns than in an expansionary period. Positive sentiment increases stock returns during all periods. Managers using positive words may lift stocks, and this impact is more pronounced in recessionary periods compared to the overall period. The absolute value of the t-statistic is larger in recession periods. These results extend the findings of Pengnate et al. (2020), who previously focused only on the global financial crisis. The difference is that we extend the study time to cover more expansionary and recessionary periods. The results also suggest that behavioral factors influence investment decisions, consistent with Sayegh et al. (2004).
Uncertainty tone is significant and has a negative relationship with stock returns during the overall period; however, it is insignificant during the expansionary and recessionary periods though the sign remains negative. These results indicate that although investors can expect good outcomes during expansionary periods, they may be disappointed by a tone of uncertainty from managers. These results align with Laskin’s (2018) assertion that firms should give assurance to investors instead of using a tone of uncertainty during periods of underperformance. In addition, a more litigious tone during recessionary periods is positively related to stock returns. This result differs from Loughran and McDonald (2011), who found that a litigious tone has no relationship with stock returns. However, they use the 4-day returns and do not specify conditions on economic periods.
A strong modal tone has a negative relationship with stock returns during both expansionary and recessionary periods. In contrast, a weak modal tone is positively associated with stock returns in both periods. These results indicate that investors prefer a weak modal tone over a strong one. In the overall period and expansionary periods, a constraining tone negatively relates to stock returns. Using a constraining tone during expansionary periods might lead investors to doubt a firm’s growth potential, supporting Kohut and Segars (1992). The relationship between a constraining tone and stock returns is insignificant which is different from Kohut and Segars (1992) for recessionary periods. Overall, this section illustrates that the direction and significance of the relationships between sentiments and tones and stock returns differ depending on the market conditions.
Do the Results Change With Different Types of Documents?
Because 10-K reports are generally longer and more comprehensive than 10-Q reports, we next examine the data from these two reports separately. The analysis differs from Pengnate et al. (2020) in that we present the analysis using various types of reports. First, we analyze the effect of sentiment and tone from 10-Q filings and report the results in Table 4.
Sentiments and Tones with 1-Month Returns for 10-Q.
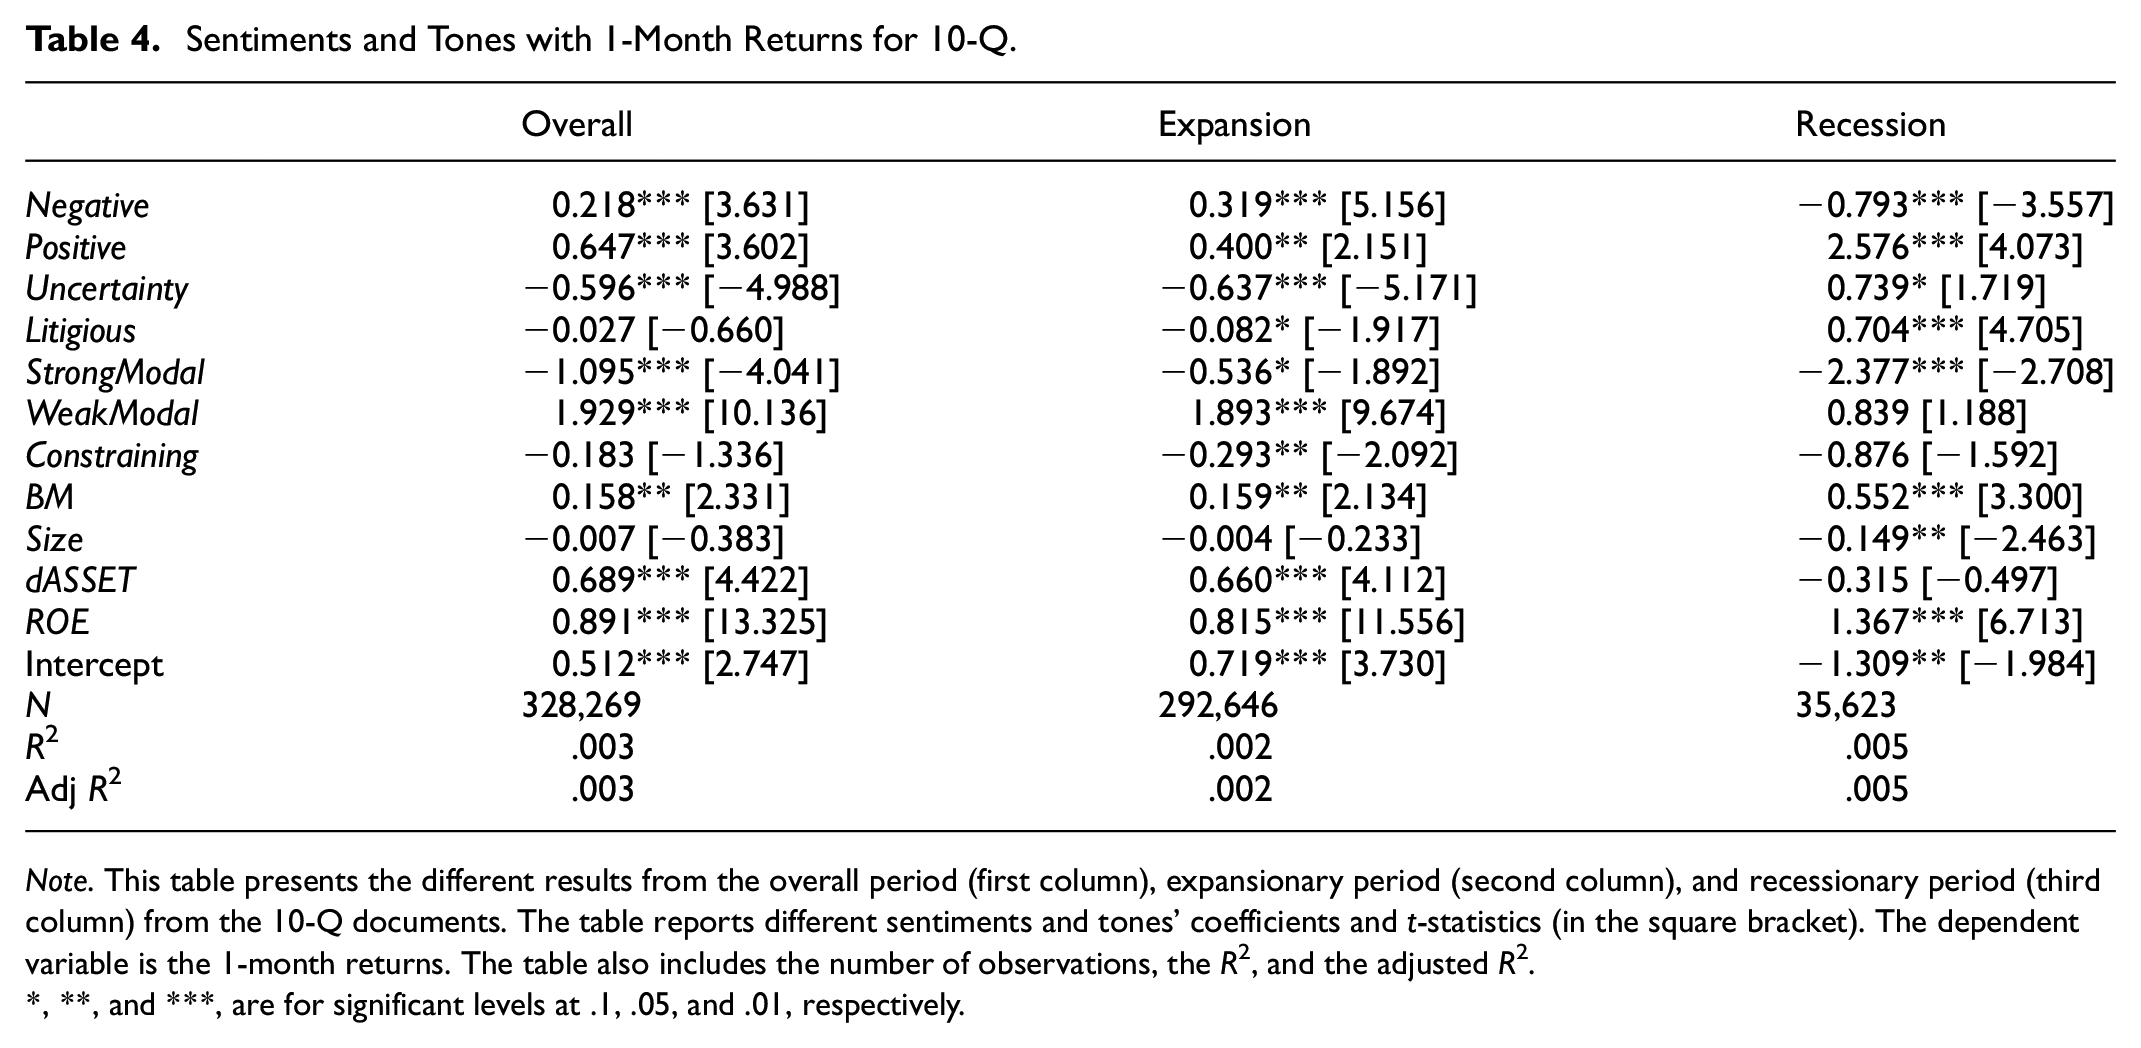
Note. This table presents the different results from the overall period (first column), expansionary period (second column), and recessionary period (third column) from the 10-Q documents. The table reports different sentiments and tones’ coefficients and t-statistics (in the square bracket). The dependent variable is the 1-month returns. The table also includes the number of observations, the R2, and the adjusted R2.
, **, and ***, are for significant levels at .1, .05, and .01, respectively.
Sentiments and Tones From 10-Q Reports
Five out of the seven sentiments and tones are significant for the overall period. Uncertainty and strong modal tone have a negative relationship with stock returns. Negative and positive sentiments and weak modal tone have a positive relationship with returns. All of the control variables are significant except Size. All sentiments and tones are significant during expansionary periods. Negative and positive sentiments and the weak modal tone continue to have positive relationships with returns. In contrast, uncertainty, litigious, strong modal, and constraining tones have negative relationships with returns. The significance of the control variables does not change compared to the overall periods. During recessionary periods, all sentiments and tones are significant except for the weak modal and constraining tones. Negative sentiment and the strong modal tone have negative relationships with returns, while uncertainty and litigious tones and positive sentiment positively correlate with returns. All control variables are significant except dASSET.
Next, we compare the sentiments and tones across the overall, recessionary, and expansionary periods. Negative sentiment has a positive relationship with returns in the overall period and expansionary periods but a negative relationship during recessionary periods. Positive sentiment has a positive relationship with returns regardless of period type. Uncertainty has a negative relationship with returns during the overall and expansionary periods and a positive relationship during recessionary periods. The relationship between litigious tone and returns is insignificant overall, but is significantly negative (positive) during expansionary (recessionary) periods. Strong modal tone has a negative relationship with returns during all period types. Weak modal tone has a positive relationship with returns during the overall and expansionary periods, however, the relationship is not significant during recessionary periods. The constraining tone has a negative relationship with returns during expansionary periods. A comparison of period types shows that, similar to the previous results, the economic condition (i.e., period type) affects the relationships between sentiment/tone and stock returns. For example, the relationship between negative sentiment and returns changes from positive to negative when transitioning from an expansionary period to a recession. Uncertainty and litigious tones change from being negatively related to returns in expansionary periods to positively related in recessionary periods. However, the sign of the relationship between positive sentiment and returns remains consistent regardless of period type.
We compare the results from the full sample (10-Q and 10-K reports) to those from the 10-Q reports. Negative and positive sentiments and strong modal tone have similar results between the full sample and 10-Q reports. Negative sentiment has a positive relationship with returns in the overall and expansionary periods and a negative relationship during recessionary periods in both cases. Positive sentiment has a positive relationship with stock returns in all period types for both the full sample and the 10-Q subsample. During all economic periods, the strong modal tone has a negative relationship with returns for both 10-Q/10-K reports and 10-Q reports alone. However, other sentiments and tones show different relationships with returns depending on the type of document. Uncertainty, for example, has a negative relationship with returns in the overall and expansionary periods and a positive relationship during recessionary periods for the 10-Q subsample. However, for the full sample, it only has a negative relationship with returns in the overall period.
Sentiments and Tones From 10-K Reports
Table 5 shows the relationship between sentiments, tones, and stock returns for the overall, expansionary, and recessionary periods for 10-K reports. For the overall period, negative and positive sentiments, uncertainty, litigious, strong modal, and weak modal tones have a significant relationship with returns. The constraining tone is not significant during the overall period. Positive sentiment, uncertainty, and litigious tones have positive relationships with stock returns. Conversely, negative sentiment, strong modal, and weak modal tones have a negative relationship with returns.
Sentiments and Tones with 1-Month Returns for 10-K.

Note. This table presents the different results from the overall period (first column), expansion period (second column), and recession period (third column) from the 10-K documents. The table reports different sentiments and tones’ coefficients and t-statistics (in the square bracket). The dependent variable is the 1-month returns. The table also includes the number of observations, the R2, and the adjusted R2.
, **, and ***, are for significant levels at .1, .05, and .01, respectively.
Uncertainty, litigious, strong modal, and weak modal tones are significant during the expansionary periods. Uncertainty and litigious tones are positively correlated to stock returns. In contrast, strong modal and weak modal tones have a negative relationship with returns. The results differ in recessionary periods, during which only negative and positive sentiments and litigious tone are significant. Negative sentiment has a negative relationship with stock returns while positive sentiment and litigious tone have positive relationships with returns.
For 10-K documents, the direction of the relationship between litigious tone and returns is consistent (positive) throughout all periods. The relationship between constraining tone and returns is not significant during any economic period. However, the signs are negative during the overall and recessionary periods and positive during expansionary periods. For most of the other sentiments and tones, the relationship with returns changes between overall, expansionary, and recessionary periods. Uncertainty and weak modal tones are highly significant during the overall and expansionary periods. In other words, when a 10-K has a higher tone of uncertainty, stocks perform better the following month. In contrast, investors react negatively to a weak modal tone in 10-K filings, resulting in lower stock returns. These tones are not significant during recessionary periods.
A comparison across the full sample and 10-Q and 10-K subsamples reveals key findings. First, positive sentiment has a positive relationship with returns in all three cases, regardless of period type, though the relationship is insignificant during expansionary periods for 10-K reports. These results support Pengnate et al. (2020) who suggest that positive sentiments should give confidence to investors, especially during crises. Litigious tone has a positive relationship with returns overall, mostly influenced by 10-K reports. The relationship between litigious tone and returns in the 10-K subsample differs substantially from that in the 10-Q subsample. A litigious tone may assure investors that managers are conducting proper legal risk management during expansionary periods. Strong modal tone has a mostly negative relationship with stock returns regardless of document type. The relationship is only insignificant for 10-K reports during recessionary periods. The results align with Patelli and Pedrini (2014) who assert that a strong modal tone can represent manager overconfidence, which can sometimes be perceived negatively by investors. However, this can be different during a recession, as shown in the 10-K reports. A strong modal tone can have no relationship with stock returns.
In summary, the relationship between sentiments and tones in financial reports and stock returns varies depending on market conditions. The impact of these sentiments and tones on returns also differs depending on the type of report. Overall, positive sentiment has a positive relationship with stock returns in the month following the report. In contrast, a strong modal tone can have a negative relationship with stock returns.
Conclusions
This study has three main objectives. First, it studies how sentiments and tones in corporate communications differ according to market conditions, including expansionary and recessionary periods. Second, it explores how stocks react to these sentiments and tones controlled by the fundamental factors from financial statements. Third, it studies how different document types affect the relationship between sentiment/tone and stock returns.
The use of each sentiment and tone in corporate communications changes depending on whether the economy is in a period of expansion or recession. Negative sentiment, uncertainty, and strong modal tones all increase during recessions while constraining tone decreases. The relationships between sentiments and tones and stock returns also change depending on the market conditions. Positive sentiment generally has a positive relationship with stock returns regardless of period type, while strong modal tone generally has a negative relationship with stock returns. The significance of these relationships also varies depending on the document used for sentiment and tone analysis. Behavioral factors may be more influential on stock returns than fundamental factors during expansionary and recessionary periods. However, the importance of these factors can change depending on the period type.
This study has some limitations which may lead to additional avenues of exploration. First, the methodology used to identify different sentiments and tones is from the dictionary of Loughran and McDonald. The results might change if we apply other dictionaries to define sentiments and tones. In addition, it might be possible to apply a large language model or generative AI to analyze corporate filing documents. Second, our data only includes those firms listed on U.S. stock exchanges. Future studies can extend to other areas and add other dimensions, such as different regulations, cultures, and languages. Third, since our study focuses on the company’s annual and quarterly filings, future studies might extend to other communication tools from management such as earnings calls, earnings presentations, or company social media content.
This study has several implications for regulators, corporate managers, and investors. First, our method of employing NLP to explain asset prices in different market conditions can provide guidance for regulators. Instead of examining only quantitative data, textual data can also be used to explain the relationship between manager sentiments/tones and stock returns. Second, managers can adjust their communication strategies according to the results found in this study. Managers must communicate effectively in different market conditions. Using inappropriate tones or sentiments during bear markets may cause stock prices to tumble. The unfavorable price movement may lead to a “feedback effect” (Edmans et al., 2015), resulting in underinvestment in the company’s corporate decision-making. Last, our method of using sentiments and tones to predict returns can prove useful to investors. Sentiments, tones, and fundamental factors can simultaneously explain stock returns in econometric settings.
Footnotes
Acknowledgements
The company’s fundamental data and prices are supported by Capital Market Research Institute (CMRI) and the S&P Capital IQ.
Funding
The author(s) received no financial support for the research, authorship, and/or publication of this article.
Declaration of Conflicting Interests
The author(s) declared no potential conflicts of interest with respect to the research, authorship, and/or publication of this article.
Data Availability Statement
Data sharing not applicable to this article as we state the sources of the data in this study.