
Abstract
The rapid increase in cashless transactions, especially digital wallets that have become widely used, has increased competition among service providers. However, while competitive analysis in this field has been explored extensively, there is still a gap regarding analyzing user feedback through social media channels. This research aims to address this gap by evaluating the competition of digital wallet providers in Indonesia, explicitly focusing on user feedback from Twitter (X), a well-known platform for its role in electronic Word of Mouth (e-WOM). This research employs SERVQUAL framework to analyze reviews of Indonesia's leading digital wallet providers, LinkAja and DANA. Support Vector Machine (SVM) and and K-Nearest Neighbors (KNN) were used for sentiment analysis by categorizing user feedback into reliability, economic benefits, assurance, and responsiveness. The findings show that LinkAja is better in responsiveness dimension while DANA is better in economic benefit dimension the quality of services, as evidenced by a higher volume of positive reviews. This research underscores the critical role of social media reviews in assessing user satisfaction and provides actionable insights for digital wallet providers to improve service quality. This research contributes to the literature by offering a novel application of e-WOM analysis in the competitive evaluation of digital wallet services.
Introduction
The rapid development of information and communication technology has driven the growth of the global digital economy. One aspect that has also been digitized is the payment method. Payment methods vary widely, as some prefer to pay with cash, while others prefer non-cash methods such as debit, bank transfers, and mobile payments (Ghandour et al., 2023). The potential use of mobile payment is enormous and it has raised global attention (Liébana-Cabanillas et al., 2020) because mobile payment offers advantages (Chen & Lai, 2023), leading to the shift of modern-day transactions from cash payments to mobile payments (Khando et al., 2023). Among the rapidly growing mobile payment options is the digital wallet (Belascu et al., 2023). A digital wallet enables electronic gadgets to store money and allows users to make payments for goods and services online (Sherman, 2014). Digital wallets, such as Apple Pay, PayPal, Samsung Pay, and Google Pay, provide great convenience and other benefits to the users (Khando et al., 2023).
Convenience and economic benefit are two major driving factors behind the growth of digital wallets (Nurcahyo et al., 2023; Pisoni et al., 2022; Shankar & Behl, 2023). Users tend to use a digital wallet to save time and effort when performing transactions. A digital wallet allows users to complete transactions anytime, anywhere, with simple clicks on their gadget (Shankar & Behl, 2023). Moreover, the digital wallet also offers economic benefits such as cashback rewards, discount vouchers, and loyalty programs to users (Nurcahyo et al., 2023). However, convenience and economic benefits will not maintain long-term user loyalty. Innovations are needed to improve customer satisfaction which can be seen in customer opinions and reviews (Lee et al., 2022).
Users interact with others and exchange opinions through social media to discover other users’ experiences using the application (Chen & Lai, 2023). Genc-Nayebi and Abran (2017) revealed that a user review could encompass various elements, including user experiences with the application, opinions regarding its performance, feature requests, and bug reports. User reviews can serve as a valuable source of information for understanding the challenges users face through e-WOM on the Internet (Ismagilova et al., 2017). Rodrigues et al. (2017)stated that user reviews play a crucial role in assisting prospective users in making informed decisions regarding adopting an application. For current users, the reviews are useful in deciding whether to continue using an application or stop using it and switch to another one (Chen & Lai, 2023). Digital wallet providers must conduct competitor analysis and promptly identify issues in their services through user reviews to ensure that their services remain superior (Zuo et al., 2019). Therefore, user feedback and reviews on an app are useful in analyzing user loyalty and competition between digital wallet providers.
An increasing number of digital wallet providers are joining the market, creating many options for users to choose from (Dhaigude et al., 2023) and intensifying competition between digital wallet providers. In Europe, for instance, competition exists among digital wallets such as PayPal, Google Pay, Apple Pay, Venmo, and other local digital wallet providers (DiMolfetta & Modrich, 2022). Digital wallet providers must strive to understand their customers’ needs and preferences, improve their services and develop strategies for sustainability, customer acquisition, and competitive advantage (Hopalı et al., 2022). Firms could measure user satisfaction with digital wallets, determining how well the services meet or exceed user expectations. User experience shows whether users will continue to use a digital wallet or switch to a competitor offering (Ilieva et al., 2023). Thus, attracting, retaining and building customers loyalty is essential to outweigh the growing competition in the digital wallet service providers’ market (Bagale & Srivastava, 2023; Dhaigude et al., 2023).
Prior research emphasizes the effectiveness of analyzing competition through the utilization of Servqual and e-WOM analysis. In Ren and Lam (2014) study, the investigation focused on the correlation between SERVQUAL dimensions and the intention to engage in positive WOM within the Chinese context. The findings indicated that reliability and assurance played a significant role in fostering positive WOM. Similarly, Yun and Park (2022) discovered that the reliability and assurance dimensions of SERVQUAL not only influenced customer satisfaction but also positively affected repurchase intention and the likelihood of positive WOM. Baumann et al. (2017) conducted research on the dimensions of the SERVQUAL scale, aiming to elucidate various forms of loyalty, such as WOM. Their study revealed a positive association between satisfaction and WOM. Camilleri (2022) utilized SERVQUAL to better understand the participants’ satisfaction with shopping websites, as well as their loyal behaviors and WOM activities. Alghamdi et al. (2023) research outcomes demonstrated that Servqual contributes to sustained intentions of usage due to its favorable impact on the adoption of e-WOM reviews. Moreover, research on word of mouth and user satisfaction concerning digital wallet providers has been conducted by several studies. The study by Zamil et al. (2022) supports the role of e-WOM in the relationship between digital wallet attitude and usage intention in Pakistan. Furthermore, a study conducted in Finland by Shaikh et al. (2018) found that satisfaction positively affects loyalty, and there is a positive moderating effect on the linkages between satisfaction and e-WOM. Similar findings by Talwar et al. (2021) in India indicate that positive e-WOM drives the continuance intentions of digital wallet users. Al-Okaily (2023) in Jordan also indicated that user satisfaction and e-WOM were determinants of e-loyalty toward digital wallet payment apps. Previous research indicates the importance of a digital wallet provider company's analyzing the level of customer satisfaction, including examining e-WOM, in order to succeed in the competition among digital wallet providers.
The benefits of online product reviews based on experience, information content, and product type have been widely adopted as considerations in the literature on decision support systems (DSS) (Sun et al., 2019). Fan et al. (2022) highlighted that the effectiveness of online reviews depends on the moderating role of reviewer reputation and sentiment, providing valuable insights for online platforms looking to improve their review scoring mechanisms. Relevant information can increase the usefulness of a review, while emotional intensity at the beginning of a review can reduce the valuation of a review. Furthermore, the characteristics of the distribution of star ratings in online consumer reviews can significantly affect consumers’ decision-making process. Venkatesakumar et al. (2021) stated that understanding these characteristics allows consumers to effectively make more informed decisions by utilizing online review content. Consistency between individual review ratings and overall product ratings in determining the usefulness of reviews is also crucial to consider during the consumer decision-making process (Jia et al., 2022). Therefore, the positive impact of online reviews and deep learning on product innovation can enhance the reputation of an online business platform (Zhao et al., 2021).
This research aims to examine the competition among digital wallets by measuring user satisfaction. The data date range tweets were collected from January 10th to March 10th, 2023, using the Twitter platform as the primary data source. This research still uses the Twitter name as a data source because the data collection was collected before the platform name change to “X” was realized. The distinctive feature of this research is the application of social media and SERVQUAL data. Hence, this approach has been proven in some previous literature. The findings of this study can serve as evaluative material for digital wallet providers, offering insights into areas of user dissatisfaction. This work can be used to enhance services, address user concerns, and prevent the recurrence of issues, ultimately leading to increased user satisfaction with the provided services.
Literature Review
User Satisfaction
In the fast-paced and rapidly evolving digital payment landscape, user satisfaction is a critical factor for the success of digital wallets (Ilieva et al., 2023). Oliver (2014) defines satisfaction as the consumer's response to fulfillment. It constitutes an evaluation of whether a product or service feature or the entire product or service, has provided or is providing a satisfactory level of consumption-related fulfillment, which may include both underfulfillment and overfulfillment. User satisfaction depends on the quality of the digital wallet services (Ajina et al., 2023). Users need to experience holistic satisfaction with digital wallets, taking into account factors such as reliability and the availability of desired features (Dhaigude et al., 2023). User experience determines whether users will continue to use a digital wallet or switch to the competitors (Ilieva et al., 2023).
Measuring user satisfaction is important. Ajina et al. (2023) posit that the organization must ensure the quality of the digital wallet service and enhance the specifications and quality of services to guarantee customer satisfaction and loyalty. Digital wallet providers must strive to understand their customers’ needs and preferences to guarantee digital wallet success (Ilieva et al., 2023). Among the various tools for measuring user satisfaction is SERVQUAL.
Service in a business or industry context is mainly intangible and challenging to measure (Al-Laymoun et al., 2019). The evaluation of user satisfaction with a service can be accomplished by employing the SERVQUAL framework, encompassing dimensions like tangibles, reliability, responsiveness, assurance, and empathy, as delineated by Parasuraman et al. (2005). The SERVQUAL approach is widely utilized or adopted for measuring service quality and management in practical business settings and academic research (Gathoni & Van der Walt, 2016). However, the theory can only be applied to conventional services. It cannot be fully applied in technology-based services (Huang et al., 2015). This study measures the level of satisfaction of digital wallet users using factors that have a significant influence on user satisfaction of a technology adopted from previous studies. These factors are reliability (Ganguli & Roy, 2011; Theodosiou et al., 2019), economic benefit (Bagla & Sancheti, 2018; Sutticherchart & Rakthin, 2023), assurance (Kim, 2021) and responsiveness (Ganguli & Roy, 2011; Huang et al., 2015; Theodosiou et al., 2019).
The first factor is Reliability, which refers to the capacity to consistently and accurately deliver the services that have been promised (Parasuraman et al., 1988). The correct and standardized provision of primary services is of utmost importance for users. Safi’i et al. (2019) stated that reliable services play a crucial role in mitigating transaction errors that could adversely impact users in terms of time and financial aspects. Moreover, Kim (2021) added reliability as the complete set of platform services, including the security and privacy of the platform service, can be trusted. The second factor is Economic benefit, which refers to the reciprocal advantages users derive from engaging in transactions facilitated by digital wallet applications (Sutticherchart & Rakthin, 2023). Typically, corporations offer various incentives such as cashback, discounts, rewards, and vouchers to provide advantages to their customers (Bagla & Sancheti, 2018; Sutticherchart & Rakthin, 2023). The third factor is Assurance, which refers to the capacity of a company to instill trust in users by providing secure and seamless application experiences (Kim, 2021). Ensuring the security and seamless functioning of applications should be paramount to the company in order to uphold user data privacy. The fourth factor is Responsiveness, which refers to the capacity to assist users and deliver efficient service promptly (Kim, 2021). This dimension pertains to how employees demonstrate a proactive attitude in assisting users in resolving issues encountered while utilizing digital payment applications. Responsiveness encompasses the ease of locating contact information for the customer service center, prompt responses, and the usefulness of the answers provided by the platform's customer service center (Kim, 2021).
Previous research has identified various benefits of service quality in relation to user satisfaction. Kim (2021) observed a noteworthy influence of service quality on satisfaction and loyalty within the context of content providers. Likewise, Dhaigude et al. (2023) underscores the importance of user satisfaction in fostering loyalty. Maintaining the satisfaction of digital wallet users will lead to an augmented market share, enhanced competitive capabilities, and an opportunity to expand the customer base (Ajina et al., 2023). Moreover, users with satisfaction are likely to continue using digital wallets and when they have a chance to share their experiences with others, which could lead to positive WOM (Sutticherchart & Rakthin, 2023). Al-Okaily (2023) showed that satisfaction and WOM were found to be determinants of loyalty toward digital wallet payment apps.
Electronic Word-of-Mouth
Electronic word of mouth (e-WOM) is defined as the dynamic and ongoing information exchange process between potential, actual, or former consumers regarding a product, service, brand, or company, which is available to a multitude of people and institutions via the Internet (Ismagilova et al., 2017). E-WOM, which often includes online reviews, recommendations and/or opinions, has gained significance with the emergence of innovative technologies such as social media (Al-Okaily, 2023). The main difference between e-WOM and traditional word of mouth (WOM) is that e-WOM communications are spread via the Internet while traditional WOM happens face-to-face. Also, e-WOM communications have a wider reach, stay in public repositories for a long time, and can be easily accessed by other consumers, which, in the case of negative e-WOM, can damage or even ruin the business (Ismagilova et al., 2017).
Understanding e-WOM can contribute to various aspects of business operations, including branding, user acquisitions, product development, and quality control. It gives companies valuable insights into user attitudes and behaviors, which can be leveraged to enhance services and establish a sustainable competitive advantage (Ismagilova et al., 2017; Luo & Xu, 2019). People rely on e-WOM to make various decisions, from gathering information about others' experiences with a specific product or service, sharing their reviews based on their personal experience, and forwarding reviews from others to their relatives (Zamil et al., 2022). When users are satisfied with the provided service, positive e-WOM is likely to emerge; conversely, in the event of user dissatisfaction, negative e-WOM may arise (Chang et al., 2019).
In order to survive in the services industry, service providers must analyze both positive and negative e-WOM. Individuals, in particular, closely observe online reviews detailing others’ experiences, encompassing favorable and unfavorable feedback (Al-Okaily, 2023). Positive e-WOM not only mitigates potential users’ status quo bias but also enhances the likelihood of continuous usage (Talwar et al., 2021). Similarly, positive e-WOM proves beneficial, fostering loyalty to digital wallet applications and prompting service providers to elevate the reputation of these applications (Al-Okaily, 2023). Conversely, negative e-WOM is recognized for its detrimental impact on a firm's customers, including past, current, and potential customers, potentially leading to negative attitudes or even defection from the brand (Talwar et al., 2021). Motivated by negative experiences of a service or company, users tend to disseminate negative e-WOM swiftly, contributing to the spread of negative news within society (Anderson, 1998; Chang et al., 2019). It is imperative to handle such instances properly to avoid any harm to the image of service providers (Singh et al., 2023).
Twitter, a form of e-WOM (Hodeghatta & Sahney, 2016), has emerged as one of the most extensively utilized social media platforms globally (Majumdar & Bose, 2019). Twitter has a global user base of 353 million users in 2023 (Dixon, 2023). Indonesia ranked as the fifth largest Twitter user country, with a total of 24 million users (Statista, 2023). Utilizing social media platforms for marketing has become a pivotal strategic undertaking by global brands (Vidya et al., 2015). In recent decades, numerous researchers have endeavored to extract valuable insights from various social media platforms, focusing on Twitter.
Methodology
The methods applied in this research are Support Vector Machine (SVM) and K-Nearest Neighbors (KNN) to classify the sentiments from the Twitter community regarding digital payment services. Data was collected using the Twitter Application Programming Interface (API) and then analyzed using RapidMiner software, which provides Python Script extensions and Execute operators. The SVM and KNN were used to classify the sentiments of the collected data.
The preference for the SVM algorithm in sentiment analysis is based on several factors. First, SVM effectively handles high-dimensional data, commonly in text data such as social media (Gaye et al., 2021). SVM also performs well in text classification, including sentiment analysis, due to its ability to generalize to unseen data (Yadav & Vishwakarma, 2020). In addition, implementing SVM using kernel functions such as the Radial Basis Function (RBF) allows for efficient training and testing processes, which is especially important in sentiment analysis with large datasets (Ding et al., 2021). Furthermore, another advantage of SVM is its ability to provide clear separation boundaries between classes, which helps understand decision boundaries in sentiment classification and analyze the influence of different features on such classification decisions (Han et al., 2020). Yao et al. (2021) also conducted sentiment analysis in their research, where social network analysis and sentiment analysis were used to investigate knowledge sharing on Twitter as a new attempt to understand the social structure of Twitter networks related to construction safety. Moreover, Song et al. (2022) studied sentiment analysis to understand the social structure of English and French tweets about work safety and sentiment distribution. In addition, testing was conducted using the SVM algorithm to evaluate the accuracy of the developed system. This system is expected to create a more comprehensive understanding of the views of digital payment users on the services they get on social media.
Meanwhile, K-Nearest Neighbors (KNN) is a widely used algorithm in supervised machine learning, primarily employed for classification and regression tasks. The essence of KNN lies in its simplicity and intuitive approach to classifying data points based on their proximity to other data points in the feature space. In KNN, a data point is classified by looking at the “k” number of nearest neighbors from the training dataset and assigning the class that is the most frequent among those neighbors. This process typically employs distance metrics such as Euclidean distance, but other distance measures can also be utilized depending on the specific requirements of the application (Idouglid et al., 2024; Uçar et al., 2021; Wang & Lu, 2021).
One of the defining characteristics of KNN is that it operates without a formal training phase. Instead, it is classified as a “lazy learner,” meaning the computation of classifications occurs at the time of query rather than during the training phase (Qi et al., 2023; Rodriguez-Bazan et al., 2023). This attribute makes KNN particularly appealing in scenarios where rapid classification is required over accumulation of training data, as it eliminates the computational overhead of training (Uçar et al., 2021). Upon receiving a new data point for classification, the algorithm calculates the distance from this point to all other points in the training dataset before determining the class based on majority voting among the nearest neighbors (Idouglid et al., 2024).
The choice of “k,” the number of nearest neighbors to consider, significantly affects the classification’s accuracy and the model’s performance. A small value of “k” may introduce noise into the classification decision, particularly if the dataset exhibits a lot of overlap between classes. Conversely, a larger “k” may smooth out the classifications too much, potentially misclassifying points by diluting the influence of the nearest neighbors. Empirical studies often demonstrate that choosing an optimal ‘k’ through methods such as cross-validation leads to improved model performance (Guo & Sun, 2025).
In sentiment analysis, KNN is appreciated for its simplicity and effectiveness in handling multi-label classifications. This is particularly evident in applications involving social media comments and user reviews, where sentiments may not be distinctly positive or negative but rather nuanced expressions of opinion. KNN can adeptly classify these sentiments through majority voting among the nearest neighbors (Aljameel et al., 2021; Rasheed & Sadiq, 2021). For instance, Rasheed and Sadiq (2021) implemented KNN to analyze a dataset comprising 7,800 social media comments, highlighting how its application resulted in useful insights into public sentiment regarding various services.
The process of this research begins with determining the user review data, reviews from users of the DANA and LinkAja payment applications collected from Twitter. Twitter has been proven to provide accurate and reliable data in sentiment analysis research (Antonakaki et al., 2021). Before data retrieval is carried out, keywords relevant to the research topic are also selected to ensure that the data retrieved follows the research objectives. The data text collected was selected only from users, while those from administrators were not used. The data collected is still semi-structured. Hence, pre-processing must be done first to turn the data into structured data. This stage is essential because it can affect the accuracy of the model created. Pre-processing is done with the help of Kemangi software. The pre-processed data is then used to create a dimensional and sentiment classification model. The classification stage uses the SVM and KNN algorithm. The collected data is divided into training data and test data. Data is classified into four dimensions: reliability, economic benefit, assurance, and responsiveness. After that, classification is carried out to determine the review's sentiment. The analysis compares the sentiment results on each dimension of the two digital payment applications.
Data Collection
The data collected in this research are user reviews of DANA and LinkAja digital payment applications on Twitter, commonly referred to as tweets using the Indonesian language. The data collection process was conducted using web scraping techniques on the Twitter platform using the Twitter API. Web scraping techniques can be an alternative to obtaining reliable data when the required data is challenging to obtain (Luscombe et al., 2022). Twitter provides an API that can be used to access their data officially. Understanding and complying with the rules set out in the Twitter API documentation is essential. This research has acknowledged Twitter’s Terms of Service (TOS), including provisions related to collecting data automatically or using techniques such as web scraping. The statements in the TOS guide the use of web access, determining acceptable or unacceptable methods for collecting information found on the site (Stringam et al., 2023). All data from Twitter is collected using the Spyder program with the Python programming language. Python is beginner-friendly and can help low-level users with its many packages, but it can also lead novices to trust the output too much. Python is very popular with researchers and practitioners who find a need for web scraping (Valente & Marchetti, 2022). Spyder is an integrated development environment (IDE) or program in the Python programming language that was often used to perform web scraping in previous studies (Navlani et al., 2021). The keywords used are @danawallet and @linkaja. The data collection results include a user name, full name, identity number, URL address, text, replies, retweets, and likes. The tweets obtained will be used to measure the satisfaction value of users of the digital wallet applications DANA and LinkAja on the performance and services of the application manager.
Data Pre-Processing
The next stage is conducted after the raw data is collected from the data collection stage. The data change from semi-structured to more structured data is carried out at this stage. The data pre-processing stage aims to remove distractions and inappropriate content. Moreover, this stage is to present the form of the words to reduce their number so that the results in the next step will be more accurate. The data collected through the webscraping technique must be converted into structured data for text-processing applications (Nigam & Biswas, 2021). Cheema et al. (2023) applied the Natural Language Processing (NLP) technique in their research to help customize raw data into structured data. NLP techniques were applied to extract keywords and develop a data repository. NLP can automate tasks that usually require much manual work (Jafari & Far, 2022). However, the results of this stage will provide data ready to be used in the following steps. The data pre-processing stage is carried out manually with the help of Kemangi software version 1.0.0 because of the large amount of data obtained and the Indonesian language used in this study. Dewi et al. (2020) also used this software as a research tool in the data pre-processing stage and showed the best results. The pre-processing stage includes document selection and spelling normalization, which are done manually. Meanwhile, the stages of case folding, cleansing, tokenization filtering, and matrix creation were carried out using Kemangi 1.0.0 software due to the limited capabilities of the software. The document-finding stage is done by sorting the collection of texts obtained. Only tweets that come from users are used.
Similarly, tweets containing administrators' answers and company quiz answers were eliminated. The selected text data is still not standardized because of many abbreviations and non-standardized language. Therefore, an advanced stage is carried out, namely spelling normalization, which is changing the language of the text data obtained with standard and uniform language. The spelling normalization process is essential so the data obtained can be processed further.
However, after the text data has been standardized and uniform, the next step is to perform case folding and data cleansing. This phase converts all text data into lowercase letters so that it is uniform and can be processed, while data cleansing is done to remove unimportant words and symbols such as punctuation marks, hashtags (#), usernames, and others. Furthermore, in the data pre-processing stage, a tokenization process is carried out to break down the text stream into meaningful words so that they can be explored into sentences. Data in the form of words obtained from the tokenization process is then filtered to eliminate words that are not important. The algorithm used in the filtering stage is the stoplist algorithm (discarding less important words) or wordlist (keeping essential words). Meaningless words such as “which,”“and,”“in,”“from,” and so on are removed using the stoplist algorithm. In this study, the stages of the case folding process, data cleansing, tokenization, and filtering use Kemangi Software Version 1.0.0.
The stemming process is advanced in the pre-processing stage, where the process of normalizing the word pieces into their basic words is carried out in this stage. This process also groups words with similar root words and meanings but have different forms or forms because they use different affixes. The data obtained using the previous stages is finally converted into numerical form using the Term Frequency-Inverse Frequency (TF-IDF) weighting method. TF-IDF is used to represent the terms in the data so that the term-specific weights in the document vector can be represented as a vector space model (VSM) (Jiang et al., 2022). TF-IDF is useful for calculating the level of relevance between the input query and the available documents to derive a similarity index, and it can be further used in information retrieval approaches (Thakkar & Chaudhari, 2020). The TF-IDF metric mainly defines terms used in search engines, text summarization, or text classification (Zaware et al., 2021). The matrix formation stage uses RapidMiner 9.6.0 software. Text data is given a weight based on the term frequency of the pieces of words that appear in each tweet.
Furthermore, the text is given weight with the TF-IDF scheme, namely by calculating the frequency of pieces of words that appear in all tweets. Following the weighting with the TF-IDF method, a model is developed to process the data and produce outputs to answer the research objectives. Two models are used at this stage. The first model is used to classify categories or factors in tweets, while the second model is used to determine the sentiment in the tweet based on several SERVQUAL dimensions and additional dimensions, namely reliability, economic benefit, assurance, and responsiveness.
Results
Labeling for Model Development
The labeling is done before developing the classification model. The labeling stage is conducted by manually building a data set given the suitability of dimensional labels. Dimension labeling is done based on keywords that describe the dimension. The first model development labeling is determining the category classification by manually building a set of data to be given the appropriate dimension label. Dimension labeling is done based on keywords that describe the dimension. The keywords used for labeling use terms often used in digital payments in Indonesia because the reviews to be analyzed in this study are Indonesian digital payment applications whose market is the Indonesian people. Labeling for the each dimension are:
Reliability: “transfer,”“bayar (pay),”“pulsa (credit),”“beli (buy),”“transaksi (transaction,”“rekening (account),”“topup,”“saldo (balance),”“qrcode,”“scan,”“paket (package),”“belanja (shopping),”“debit,”“kredit,”“pesan (order),”“krl.”
Economic benefit: “Cashback,”“voucher,”“promo,”“potong (cut),”“diskon (discount),”“bonus,”“gratis. (free)”
Assurance: “error,”“akun (account),”“premium,”“upgrade,”“nomor (number),”“login,”“sistem,”“blokir (block),”“server,”“device,”“password,”“aplikasi (application),”“update,”“gagal (failed).”
Responsiveness: “admin,”“dm,”“balas (reply),”“respon (response),”“layan (service),”“baca (read),”“twitter,”“email,”“jawab (answer),”“cs,”“komplain,”“cek,”“lambat (slow).”
The development labeling of the second model, in order to find out the sentiment in the tweet reviews, is done by using keywords that show the sentiment of the data and are used to label the data obtained.
The keywords used to indicate positive sentiment include “puas (satisfied),”“terima kasih (thank you),”“hebat (great),”“cashback,”“promo,”“gratis (free),”“untung (profit),”“diskon (discount),”“enak (delicious),”“keren (cool),”“senang (happy),”“murah (cheap),”“bagus (good),”“asik (fun),”“nikmat (pleasant),”“hadiah (reward),”“Alhamdulillah,”“bonus,”“giveaway,”“mantap (excellent),”“hemat (saving).”
Meanwhile, in the labeling that shows negative sentiment, the keywords used include “error,”“kecewa (disappointed),”“complain,”“tipu (scam),”“bohong (lie),”“kapok (regret),”“gagal (failed),”“tidak masuk (not successful),”“baca dm (read dm),”“lihat dm (check dm),”“down,”“tidak masuk,”“rumit (complicated),”“blokir (block),”“parah (terrible),”“tidak nyaman (uncomfortable),”“pending,”“susah (difficult),”“kendala (problem),”“jelek (bad),”“tidak cashback (no cashback),”“lama (lengthy),”“tunggu (wait),”“gangguan (disruption).”
The keywords that used to determine neutral sentiment are described in question or information request keywords including “bagaimana (how),”“cara (way),”“apa (what),”“kenapa (why),”“kapan (when),”“dimana (where),”“berapa (how much).”
Dimension Category Classification Model Using Tweet Reviews
Classification is done to get a model that can automatically classify large amounts of data. The classification at this stage is carried out to determine the dimensions or categories in the tweets that have been processed. Classification modeling is done with the SVM and KNN classification algorithm.
This research uses k-fold cross-validation to evaluate the classification model with a value of k = 10. Before performing classification, the parameters for the SVM algorithm must be determined. This research uses the Radial Basis Function (RBF) kernel type, so the parameters that need to be determined are the gamma and C values. The gamma value is determined in the interval 0.1 to 0.5 with an increase of 0.1. The C value is determined from 1 to 100 with an increase of 1. Evaluate the model's performance by looking at the accuracy value and the F1 value obtained. F1 is a trade-off between precision and recall. In the classification model for DANA, the gamma value used is 0.2, and the C value used is 3. The accuracy value obtained by the classification model for DANA is 84.24%, and the average F1 is 83.24%. The resulting accuracy value obtained by the classification model for LinkAja is 81.80%, and the average F1 is 80.36%. The resulting model is then used to classify new data that has not been labeled with categories, with 1031 data for DANA and 905 data for LinkAja. DANA customers review the responsiveness dimension more by about 42%, and the reliability dimension is reviewed more by LinkAja customers by about 48% on social media. Figures 1 and 2 show the data results classified into their respective categories for DANA and LinkAja.

Dimensional proportion data of DANA: (a) Data processed using SVM; (b) Data processed using KNN.

Dimensional proportion data of LinkAja; (a) Data processed using SVM; (b) Data processed using KNN.
KNN was conducted using 10-fold cross-validation on the same dataset for each method. The optimal k value for KNN is 5, obtained from testing k = 3, 5, and 7. KNN uses Euclidean distance as a distance metric. The classification result for DANA using KNN achieved an accuracy of 78.86% and an average F1-score of 68.6%, while for LinkAja using KNN made an accuracy of 70.28% and an F1-score of 55.84%. DANA customers review the responsiveness dimension more by about 71.87%, and the reliability dimension is reviewed more by LinkAja customers by about 62.87%.
Sentiment Classification Model using Tweets Reviews
The current stage involves conducting a process to obtain the results of data classification in order to determine whether the data falls under positive or negative sentiment. The data processing employed in the classification model process stage is similar, using the Support Vector Machine (SVM) classification algorithm with the help of RapidMiner 9.6.0 software and using k-fold cross-validation to evaluate the classification model with a value of k = 10. This stage uses a Radial Basis Function (RBF) kernel with a gamma value of 0.1 to 0.5 in 0.1 increments and a C value of 1 to 100 in 1 increment. The results of the sentiment classification model for DANA resulted in an accuracy of 88.55% and an average F1 of 88.3% with a gamma value of 0.1 and a C value of 3. Meanwhile, the sentiment classification results for LinkAja resulted in an accuracy of 83.65% and an average F1 of 82.62% with a gamma value of 0.5 and a C value of 3.
The results of the sentiment proportion for DANA using SVM show that neutral sentiment dominates the proportion of around 49.85% of the total tweets, or as many as 514 tweets, while positive sentiment is 309 tweets and 208 tweets for negative sentiment. Furthermore, the proportion results for LinkAja also show that neutral sentiment dominates the classification proportion, around 58.56% of the total tweets or as many as 530 tweets, while positive sentiment is 190 tweets and 185 tweets for negative sentiment.
The results of the sentiment proportion for DANA using KNN show that neutral sentiment dominates the proportion of around 43.94% of the total tweets, or as many as 453 tweets, while positive sentiment is 315 tweets and 263 tweets for negative sentiment. The proportion results for LinkAja also show that neutral sentiment dominates the classification proportion, around 48.29% of the total tweets or as many as 437 tweets, while positive sentiment is 179 tweets and 289 tweets for negative sentiment.
The comparison of the number of positive, neutral and negative sentiments based on tweeter reviews on each dimension can be seen in Table 1.
Comparison Between Negative, Neutral, and Positive Sentiments for DANA and LinkAja.

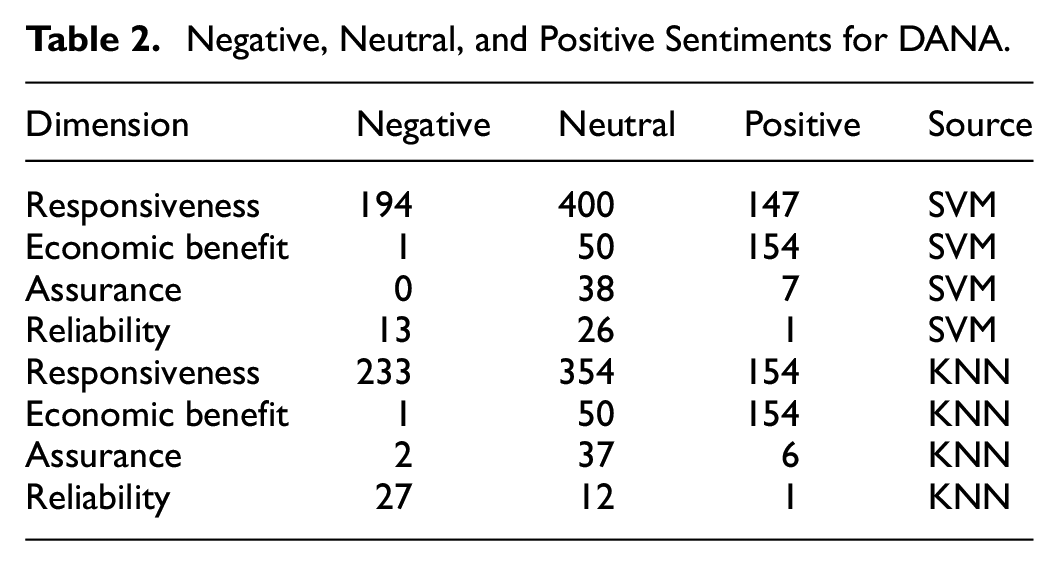
The classification of tweet sentiments—negative, neutral, and positive—into the SERVQUAL dimensions reveals significant insights for both DANA and LinkAja. For DANA, the responsiveness dimension is the most frequently reviewed and discussed by users (Table 2). However, most of the discussions around this dimension tend to highlight problems and receive predominantly negative sentiments (Figure 3). Additionally, the reliability dimension also attracts negative sentiments from users. On the other hand, the economic benefit dimension stands out as the one that receives the most positive sentiments from users.
Negative, Neutral, and Positive Sentiments for DANA.

Difference between positive and negative reviews for DANA.
For LinkAja, the reliability dimension is the most discussed by users (Table 3), many users express dissatisfaction, resulting in significant negative sentiments (Figure 4). Interestingly, contrary to DANA, LinkAja’s responsiveness dimension receives mostly positive sentiments. Furthermore, similar to the findings for DANA, the economic benefit dimension is the one that garners the highest number of positive sentiments from users. This analysis indicates that while both platforms share positive user perceptions regarding economic benefits, their performances in reliability and responsiveness are perceived differently by their users.
Negative, Neutral, and Positive Sentiments for LinkAja.


Difference between positive and negative reviews for LinkAja.
Discussion
Classification modeling is done with the SVM and KNN classification algorithm. Classification models were built for each digital payment application. Then, divide the data into training data and test data using k-fold cross-validation with k = 10. Marcot et al. (2021) said that the k = 10 value is used because it has a relatively low bias and variance. Model evaluation is done by looking at the confusion matrix, which consists of accuracy and F1. Shah et al. (2020) stated that they performed text classification comparative analysis in their research. They also used the confusion matrix and F1 score as parameters to determine the accuracy of the model generated. Habimana et al. (2019) explained obtaining word sentence sentiment classifications. However, a limitation of this technique is that it does not consider neutral views included in the dataset. The resulting classification model has a relatively good accuracy of above 80%. The category classification model for DANA produces a higher accuracy of around 84%, while the category classification model for LinkAja is 81%. Thus, it can be caused when pre-processing data for LinkAja. Some words are still missed at the text normalization stage because this stage is done manually. Haddi et al. (2013) compared the accuracy of classification results with data that was not pre-processed and data that was pre-processed first. Text pre-processing helped address challenges posed by raw data, such as redundant, null, or irrelevant information that might disrupt the analysis process (Gopi et al., 2023). However, Kobayashi et al. (2017) said that practical applications of natural language processing, such as classification and clustering, need a comprehensive knowledge of the system.
The results showed that the model that was pre-processed first had higher accuracy. Errors when labeling training data that is done manually can also be a cause because it can confuse the classification to the correct dimension. Performing the classification of the service dimensions is followed by the sentiment classification of the data. The sentiment classification model for DANA and LinkAja has relatively the same accuracy of 84% and 83%. It showed that the classification model can correctly classify data and produce correct classifications. After classifying the new data and obtaining the final results of the number of sentiments on each dimension, digital payment application services are assessed using the sentiment results.
The two digital payment applications were assessed based on reliability, economic benefit, assurance, and responsiveness. Furthermore, both digital payment applications have deficient responsiveness scores. The two digital payment applications have relatively similar problems: long problem-solving times and unresponsiveness in handling user complaints. Improvements need to be made to the operation of user complaint services to be more responsive and quick in handling user problems, which is expected to increase positive user sentiment in the future and reduce dissatisfied users. Dana is better than LinkAja in terms of the economic benefit dimension. Most users appreciate the various cashback promotions offered by DANA.
Many LinkAja users get cashback when they make transactions for credit and data package purchases, bill payments, and fuel payments. Ipsos (2020) said that it is appropriate that the number of users who will continue to use LinkAja if there are no promotional activities is only 6% of the total respondents who use digital payment applications. LinkAja should continue providing promotional programs to attract users until users feel they will continue using LinkAja without promotion. Gap calculations were also carried out for both digital payment applications based on the number of positive and negative tweets. LinkAja customers have a relatively impartial attitude toward the services offered by LinkAja compared to the other digital payments based on their official Twitter accounts.
Meanwhile, when viewed from the sentiment gap value, LinkAja has a better level of satisfaction and reputation when compared to DANA. This can be seen from the number of positive reviews for LinkAja, which is more than that of DANA. However, the number of complaints for each dimension is mostly higher except for the economic benefit dimension, and the reliability dimension has the highest number of complaints, inline with finding from Kamila et al. (2024) and Widiantoro et al. (2023). This problem must be fixed immediately, considering that LinkAja's primary strategy is in the Payment Point Online Bank (PPOB) field, and the public and private transportation fields are also included in the reliability dimension. Goodman (2019) said that to minimize the number of problems users feel, companies must “do the right job the first time” or do the right job from the start. Companies must provide consistent services according to user needs and expectations. The most complained problem is the purchase of credit and data packages that have been successful, but the destination number does not receive the credit and data packages. JAKPAT (2020) showed that 67% of LinkAja users use LinkAja to purchase credit and data packages. However, more users choose DANA to purchase credit and data packages due to cooperation with e-commerce companies Lazada and Bukalapak. It also occurs in bill payments (electricity and cable TV) where more users use DANA, so improvements are needed so that LinkAja can compete in this service and can add sales strategies, namely by collaborating with e-commerce to increase sales of credit products, data packages, and bill payments. For airplane or train ticket purchase services, more users use LinkAja than DANA (JAKPAT, 2020). This can be caused by LinkAja collaborating with Indonesia's Train Access, Garuda Indonesia, and Citilink as one of the payment methods that can be used.
JAKPAT (2020) found that 24% of LinkAja individuals use this service. However, the current scope of this service is limited. There is potential for improvement through collaboration with additional airlines and Online Travel Agencies to expand the available payment methods. Further to research findings, users who express their concerns and subsequently experience a satisfactory resolution exhibit a 30% higher level of loyalty than users who choose not to voice their complaints. Goodman (2019) said that the proportion of individuals who switch to another brand among those who complain is one out of five. The number of users who make complaints is 530, so by resolving complaints well, LinkAja will get an additional 106 new active users. Solving the problem is expected to increase the positive sentiment of LinkAja users. The increase in positive reviews is expected to increase users, as friends introduce 50% of new users to digital payment applications (Ipsos, 2020). Therefore, if the 190 users who leave positive reviews share their experience or recommend LinkAja to at least two of their friends, then it is predicted that there will be 380 new users. The more users who leave positive reviews, the more new users will use LinkAja. It will also affect the revenue of the LinkAja application. Statista (2020) showed that the prediction of the average transaction value of digital payment application users in Indonesia in 2020 is $53.4/year, or around IDR 790,082. Furthermore, LinkAja is predicted to get additional revenue of IDR 559.4 million/year by solving the problems users face.
Conclusion
This research focused on user satisfaction with mobile payment services based on user reviews on Twitter. Four dimensions affect mobile payment service provider assessment: reliability, economic benefits, assurance, and responsiveness. DANA customers mainly review the responsiveness dimension, while the reliability dimension is reviewed more by LinkAja customers on social media. The evaluation of the DANA digital payment application provider service based on the number of tweets for each dimension shows that negative sentiment is more significant than positive. The assessment of LinkAja digital payment application providers' services for the economic benefit dimension shows a more significant positive sentiment than negative. The remaining dimensions show a more significant negative sentiment than positive. The reliability dimension attracts the highest level of security among LinkAja users, while the services of credit and data package purchases elicit the most frequent complaints.
Meanwhile, LinkAja outperforms DANA in the transportation ticket purchase service because it collaborates with KAI, Garuda Indonesia, and Citilink. Application developers should pay more attention to solving problems related to consumer complaints. Resolving user complaints well can increase the number of active and new users, affecting LinkAja's revenue. Furthermore, it is predicted that LinkAja will generate an additional IDR 559.4 million/year in revenue by resolving user complaints. Furthermore, it can be concluded based on the research that user reviews on social media can help companies find out users' assessment of services and problems complained about more quickly, compared to traditional data collection techniques such as questionnaires.
This research investigated digital payment applications with a product strategy on Payment Point Online Bank (PPOB). Therefore, the services assessed may differ if the object under study uses other strategies, such as e-commerce payments. Furthermore, the limitation of this study is that it analyzes the competition between DANA and LinkAja based on user reviews available on Twitter. The types of complaints obtained may be more diverse if they are used on several other social media platforms, such as Facebook and Instagram. Therefore, it is recommended that future research can pay attention to these issues.
Footnotes
Acknowledgements
None.
Ethical Considerations
Not applicable.
Funding
The author(s) disclosed receipt of the following financial support for the research, authorship, and/or publication of this article: This research has funded by Hibah Publikasi Terindeks Internasional (PUTI) Q1 Tahun Anggaran 2024-2025 Nomor: NKB-536/UN2.RST/HKP.05.00/2024
Declaration of Conflicting Interests
The author(s) declared no potential conflicts of interest with respect to the research, authorship, and/or publication of this article.
Data Availability Statement
The data that support the findings of this study are available from the corresponding author upon reasonable request.