
Abstract
The Couples Satisfaction Index (CSI) is one of the most widely used instruments to assess intimate relationship satisfaction and status. However, its performance in the Chinese population has yet to be validated, including investigation of potential differential item functioning (DIF). To verify the performance of the adapted Chinese CSI, data were collected from 740 participants (235 males and 505 females). Under the item response theory (IRT) framework, the graded response (GR) model was fit. Key assumptions and model fit were checked first, followed by a DIF analysis. Category response curves and information functions were also examined. Results showed that the two IRT assumptions—unidimensionality and local independence—were generally satisfied. The GR model fit the data well. Moreover, the items from the CSI scale performed very well in assessing and differentiating among participants of differing levels of intimate relationship satisfaction. Meanwhile, high test information distributed across a wide range of latent ability ensured that the CSI was reliable and accurate. Moreover, there was no significant DIF for all CSI items, which supported its equity and fairness when administered to different gender groups. Overall, the CSI shows good psychometric characteristics, has no systematic DIF between genders, and holds promise to facilitate further research on intimate relationship satisfaction.
Keywords
Intimate relationship is a relationship characterized by strong, sustained, mutual influence across a wide range of interactions, typically including lustful desire and the possibility of sexual involvement (Bradbury & Karney, 2019). Building and maintaining a positive, healthy, and meaningful intimate relationship is one of the key tasks in the early adulthood (Berk, 2018; Erikson, 1963; Gerrig, 2013), and can have a lifelong effect on a person, especially on mental and physical health (Blow et al., 2019; Bradbury & Karney, 2019; Kawachi & Berkman, 2001; Whisman & Baucom, 2012) and other important aspects.
Therefore, it is vital to develop effective and valid psychometric tools to monitor, evaluate, guide, and adjust the intimate relationship satisfaction. To date, many scales and tests have been developed and testified for their excellent performances in intimate relationship studies. Among them are the Dyadic Adjustment Scale (Spanier, 1976), Marital Adjustment Test (Locke & Wallace, 1959), Quality of Marriage Index (Norton, 1983), Relationship Assessment Scale (Hendrick, 1988), Semantic Differential Scale (Karney & Bradbury, 1997), Kansas Marital Satisfaction Scale (Nichols et al., 1983), and Couples Satisfaction Index (Funk & Rogge, 2007). To be mentioned, the Couples Satisfaction Index has been newly developed by incorporating and selecting items from other successful and valid scales abovementioned (Funk & Rogge, 2007). This new scale has been verified for excellent psychometric performances and applied to a large body of literature on intimate relationships (S. M. Johnson, 2019; Karney & Bradbury, 2020; Papp, 2018; Williamson, 2020). However, to our knowledge, it has yet to be adapted to Chinese and validated for its performance, which is one of the main focuses of this study.
Another important purpose of this study is to testify differential item functioning (DIF) between genders. Gender differences exist in many aspects of intimate relationships, which hold a great deal of power and influence (Bradbury & Karney, 2019). These gender differences include, for example, ways of thinking and behaving (Fuller & Riggs, 2021; Messinger et al., 2021; Winstok & Smadar-Dror, 2021), emotion expressing (Bliton et al., 2016; Umberson et al., 2015), mate selection (Fletcher et al., 2014; Jarrett & Anderson, 2023; Xiao & Qian, 2020), aggressiveness (Harrington et al., 2021; O’Connor et al., 2023), and other variables (Horne & Johnson, 2018; Policastro & Finn, 2021). Meta-analyses have revealed consistent average differences between women and men on a wide range of characteristics (Bradbury & Karney, 2019). Therefore, it is vital to validate the equity and equality of the adapted Chinese CSI between genders.
The remainder of this paper is organized as follows. First, we introduce the CSI and provide a review of its research in the Chinese context. Then, we present the purpose, methods, and procedures of this study. Based on this, we provide a detailed description of the results and discussions. Finally, practical recommendations and future directions are discussed based on the results.
The Couples Satisfaction Index
Using item response theory (IRT) techniques, Funk and Rogge (2007) demonstrated that the traditional scales that have been used widely, such as the Marital Adjustment Test (Locke & Wallace, 1959) and the Dyadic Adjustment Scale (Spanier, 1976), provided poor levels of precision in assessing intimate relationship satisfaction, particularly given the length of those scales. Then they constructed an item pool by selecting items from those scales. After that, item- and test-level analyses were carried out to determine which items contribute more when satisfaction was assessed. As a result, the Couples Satisfaction Index (CSI) scale with 32 items was developed. Research findings have been synthesized to show that the CSI scale, despite having fewer items compared to other scales, is capable of providing significantly more information (precision). In addition, from the perspective of classical test theory (CTT), the CSI scale demonstrated excellent internal consistency and convergent validity, as well (Funk & Rogge, 2007).
Due to its excellent and promising psychometric performances (Graham et al., 2011; Mattson et al., 2013; Saavedra et al., 2010; Schlagintweit et al., 2016), the CSI scale has been applied across many domains of intimate relationships. These domains include relationship quality (Bareket et al., 2018; McDaniel et al., 2018; Williamson, 2020), relationship maintenance (Doss et al., 2019; Halford & Bodenmann, 2013; Karney & Bradbury, 2020), couple therapy (S. M. Johnson, 2019; Patterson et al., 2018), intimate conflict and violence (Papp, 2018; Visschers et al., 2017), and so on.
In order to facilitate and advance the area of intimate relationship, researchers have adapted the CSI scale into several versions under different languages worldwide. For instance, to explore the association between intimate relationships and other important factors, several studies have been conducted using translated versions of the CSI scale (Glowacka et al., 2018; Kirchner-Häusler et al., 2022; Pfaff & Schlarb, 2022; Pinto et al., 2019; Qadir et al., 2013; Rauch-Anderegg et al., 2020). However, they reported only a simple reliability index and did not systematically evaluate the psychometric properties of the adapted CSI scale, which limits its generalizability to other studies. Therefore, systematic validation of the translated CSI scale is an important research endeavor. Some researchers have done this work already under several language systems (El Frenn et al., 2022; Lamela et al., 2020; Okhotnikov & Wood, 2020). Nonetheless, to the best of our knowledge, the CSI scale has yet to be adapted to Chinese and validated. Verifying the performance of the CSI in the Chinese population is of great value and significance because Chinese is one of the most widely spoken languages in the world.
As a part of validation, it is common to compare and contrast responses from participants with different backgrounds (e.g., socioeconomic status and gender). If the participants from different demographic groups who possess the same level of latent construct of interest have unequal probabilities of giving a certain response to an item, the equity issue arises. This is called differential item functioning (DIF). The DIF analysis is a vital procedure in the processes of scale development and validation. Unfortunately, DIF has not been investigated for the CSI scale since its original development (Funk & Rogge, 2007), which renders its equity and effectiveness questionable under circumstances where subgroups with different demographic characteristics exist.
The Chinese Context
Intimate relationship studies with the CSI scale in Chinese language mainly entail two domains: intercultural and intracultural comparisons and the associations between intimate relationship and other factors.
Regarding the intercultural and intracultural comparisons, Kaya et al. (2019) examined Chinese and Western ethnic identification and relationship satisfaction in four cultural combinations of couples: Western male-Western female, Chinese male-Chinese female, Western male-Chinese female, and Chinese male-Western female. They found that greater similarity between partners on ethnic identification with the majority Western culture of Australia predicted greater relationship satisfaction, but there was no association of relationship satisfaction with partner similarity on Chinese ethnic identification. Hiew et al. (2015), Kim et al. (2012), and Parung and Ferreira (2017) hold similar views that intimate relationship patterns vary across countries and culture. On the other hand, Halford, Leung, et al. (2018) explored the association of relationship standards with relationship satisfaction, by comparing intercultural couples with two groups of mono-cultural couples across two countries of residence (China and Australia). They found that endorsement of couple bond standards and partner similarity on family responsibility standards were associated with relationship satisfaction across all three groups and both countries of residence. Then they concluded that the association of family responsibility standards with satisfaction is remarkably similar across countries of residence and cultural groups. Halford, Lee, Hiew, and van de Vijver (2018) hold similar views that intimate relationship satisfaction shares some common patterns and relations with other aspects across different culture.
Surrounding factors related to intimate relationship, with the assistance of the CSI, were studied around the topics of stress and depression (Zhang et al., 2022), disease (Yeung et al., 2020), baby nurturing (Xue et al., 2018), family functioning (Anderson et al., 2014; Deitz et al., 2015), and personal character (M. D. Johnson et al., 2015). Nevertheless, there is still lack of in-depth research under the Chinese culture. Thus, validation of the CSI scale in the Chinese population is of great importance.
Present Study
Since its initial development, the CSI scale has been verified and validated worldwide (El Frenn et al., 2022; Lamela et al., 2020), and has been applied to various empirical practices (Kirchner-Häusler et al., 2022; Pfaff & Schlarb, 2022). Nevertheless, there still lacks systematic evidence of its performance for the Chinese. In addition, DIF needs to be investigated (Funk & Rogge, 2007), as severe DIF problems can jeopardize the validity and equity of the scale. Therefore, this study aims to validate the performance of the Chinese version of the CSI scale, and conduct the DIF analysis between genders under an IRT framework.
Method
Participants and Sample Selection
In order to validate the Chinese version of the CSI, 762 adults were recruited and asked to respond to the scale online in 2020. Of the original 762 cases, 22 were excluded as they failed to completing the demographic information. After the exclusion, the sample size used for IRT and other analyses was 740 (235 males, 505 females).
Review and approval for the study procedures were obtained from the university institutional review board prior to study onset. Before answering the scale, participants received an information sheet online that assured them that the data obtained would be handled confidentially and anonymously, and they were asked to give electronic informed consent. After filling the scale, they would receive an electronic red packet with a random amount of money.
Measure
Demographic Characteristics
Participants completed a demographic questionnaire including gender, age, and duration of intimate relationship.
The Couples Satisfaction Index (CSI)
The CSI scale (Funk & Rogge, 2007) has 32 items, of which 31 items are rated on a 6-point Likert-type scale from 0 (low satisfaction) to 5 (high satisfaction), and one item (item 1) is rated on a 7-point Likert-type scale from 0 (low satisfaction) to 6 (high satisfaction). Taking item 1 as an example, the question is “please indicate the degree of happiness, all things considered, of your relationship.” In addition, for items 26 to 32, participants rate semantic differential scale with bipolar adjectives on either end (e.g., enjoyable vs. miserable for item 32). Six items (items 6, 10, 15, 27, 29, and 31) are reversely scored such that lower scores reflect more positive attitudes toward intimate relationship satisfaction. For instance, the question for item 6 is “how often do you wish you hadn’t gotten into this relationship.” A score of 0 in this item represents high satisfaction. The CSI scale has been verified to have excellent psychometric properties, such as higher precision of measurement and strong convergent validity (e.g., Graham et al., 2011; Mattson et al., 2013; Saavedra et al., 2010; Schlagintweit et al., 2016). In this study, the CSI scores demonstrated an internal consistency estimate of Cronbach’s α of .97 in the total sample.
In order to validate the performance of the Chinese adapted CSI, the English version was first translated into Chinese following the five-stage procedures proposed by Brislin (1970) and Beaton et al. (2000): initial translation, synthesis of the translations, back translation, expert committee, and test of the prefinal version. The prefinal version was administered to 170 college students and data were analyzed. Results of the analysis showed high discrimination, reliability, and validity, and thus no further revisions were made. Because IRT analyses are the focus of this study, the results for the prefinal version are not provided here, but they are available upon request.
The items of the final translation in Chinese used in this study can be found in the Supplementary Material.
Statistical Analyses
To accomplish the objectives of this study, psychometric techniques under the IRT framework were used. IRT is a system of models that defines the correspondence between latent variables and their manifestations, and it uses latent characterization of individuals and items as predictors of observed responses (De Ayala, 2013). Specifically, two key assumptions in IRT (i.e., unidimensionality and local independence) as well as the goodness of fit of the graded response (GR) model were evaluated first. After that, item parameter estimates and their characteristics were examined. Finally, a DIF analysis was performed using gender to define subgroups. Grounded on the aforementioned, further analyses were conducted to inspect the category response curves and information functions as a measure of the overall performance of the CSI scale and the items in it. All the analyses were executed using several packages in R (R Core Team, 2019).
Unidimensionality
Item response models in which a single dominant ability is presumed sufficient to explain or account for examinee performance are referred to as unidimensional models (Embretson & Reise, 2013; Hambleton et al., 1991). To assess it, exploratory factor analysis (EFA) was executed with the fa function in the psych package (Revelle, 2016) prior to carrying out IRT analyses (Acevedo-Mesa et al., 2021; Eichenbaum et al., 2019). If the first factor accounts for more than 20% of the variance, the scale can be said to be unidimensional (Hattie, 1985; Reckase, 1979).
Local independence
According to Embretson and Reise (2013), responses to items are independent conditional on the level of the latent construct (i.e., the intimate relationship satisfaction in this study), which is referred to as local independence between items in the CSI scale. To check this assumption, Yen’s
Graded Response Model and Model Fit
Items for assessing the participants’ attitudes with more than two ordered response categories can be fitted with GR model (Samejima, 1968). The probability of a response in category

where
Based on the guidelines from Baker and Kim (2017), the
To verify that the GR model fits the data,
These analyses were performed by the mirt and itemfit functions in the mirt package (Chalmers, 2012).
DIF Analysis
DIF tests were analyzed to identify discrepancies in responses between participants with different gender. Three nested models were estimated for each item, of which the first model only included the trait score for the CSI, the second model included the trait score and gender, and the third model included the trait score, gender, and their interaction. If there is a statistically significant difference between the first and third models, DIF effect is present. If there is a statistically significant difference between the first and second models, uniform DIF effect is present. If there is a statistically significant difference between the second and third models, nonuniform DIF effect is present (Choi et al., 2011). As the chi-square difference test was oversensitive to sample size and might detect negligible effects that bear no practical significance, the change of McFadden’s pseudo
These analyses were executed using the lordif function in the lordif package (Choi et al., 2011).
Category Response Curves and Information Functions
The category response curves from the GR model represent the probability of a response in category
Results
Descriptive Statistics and Preliminary Analyses
Table 1 shows descriptive statistics for age, duration of intimate relationship, and the CSI scores, grouped by gender. From the 740 participants, 62.70% were younger than 25 years old, 35.81% were 26 to 40 years old, and 1.49% were older than 41 years old. Regarding the duration of intimate relationship, 18.11% were shorter than 3 months, 13.11% were 4 to 6 months, 15.54% were 7 months to 1 year, 27.70% were 1 year to 3 years, and 25.54% were longer than 3 years. All Cronbach’s α values from CTT for three samples were larger than .95, indicating good reliability for the Chinese version CSI.
Descriptive Statistics for the Sample.

Note. CSI = Couples Satisfaction Index.
Assessing Model Assumptions and Fit
EFA with a one-factor solution explained 49.5% of the total variance, exceeding the 20% minimum, which supports the unidimensionality assumption. Regarding the local independence assumption, of the total 496 residuals from Yen’s
Table 2 shows results from the goodness-of-fit analysis. It can be seen that all items showed excellent goodness of fit with respect to
Fit Statistics of the CSI Items.

Note. Boldfaced value denotes a significant
Graded Response Model Parameters
Table 3 shows the estimated item parameters and their standard errors (SE) for the GR model. The discrimination parameter estimates ranged from 0.69 to 4.01.The numbers of items of low, moderate, high, and very high discrimination were 0, 3 (items 6, 10, and 15), 5 (items 2, 3, 13, 14, and 20), and 24 (other items), respectively. The category boundary locations spread across the whole ability scale ranging from −2.83 to −1.13, −1.99 to −0.67, −1.53 to −0.14, −0.86 to 0.64, and −0.07 to 1.67, for
GR Model Parameters for Each Item.

Note. Of the 32 items from the CSI scale, only item 1 was rated on a 7-point Likert scale with six category boundary locations, and the others were rated on a 6-point Likert scale with five category boundary locations.
DIF Analysis
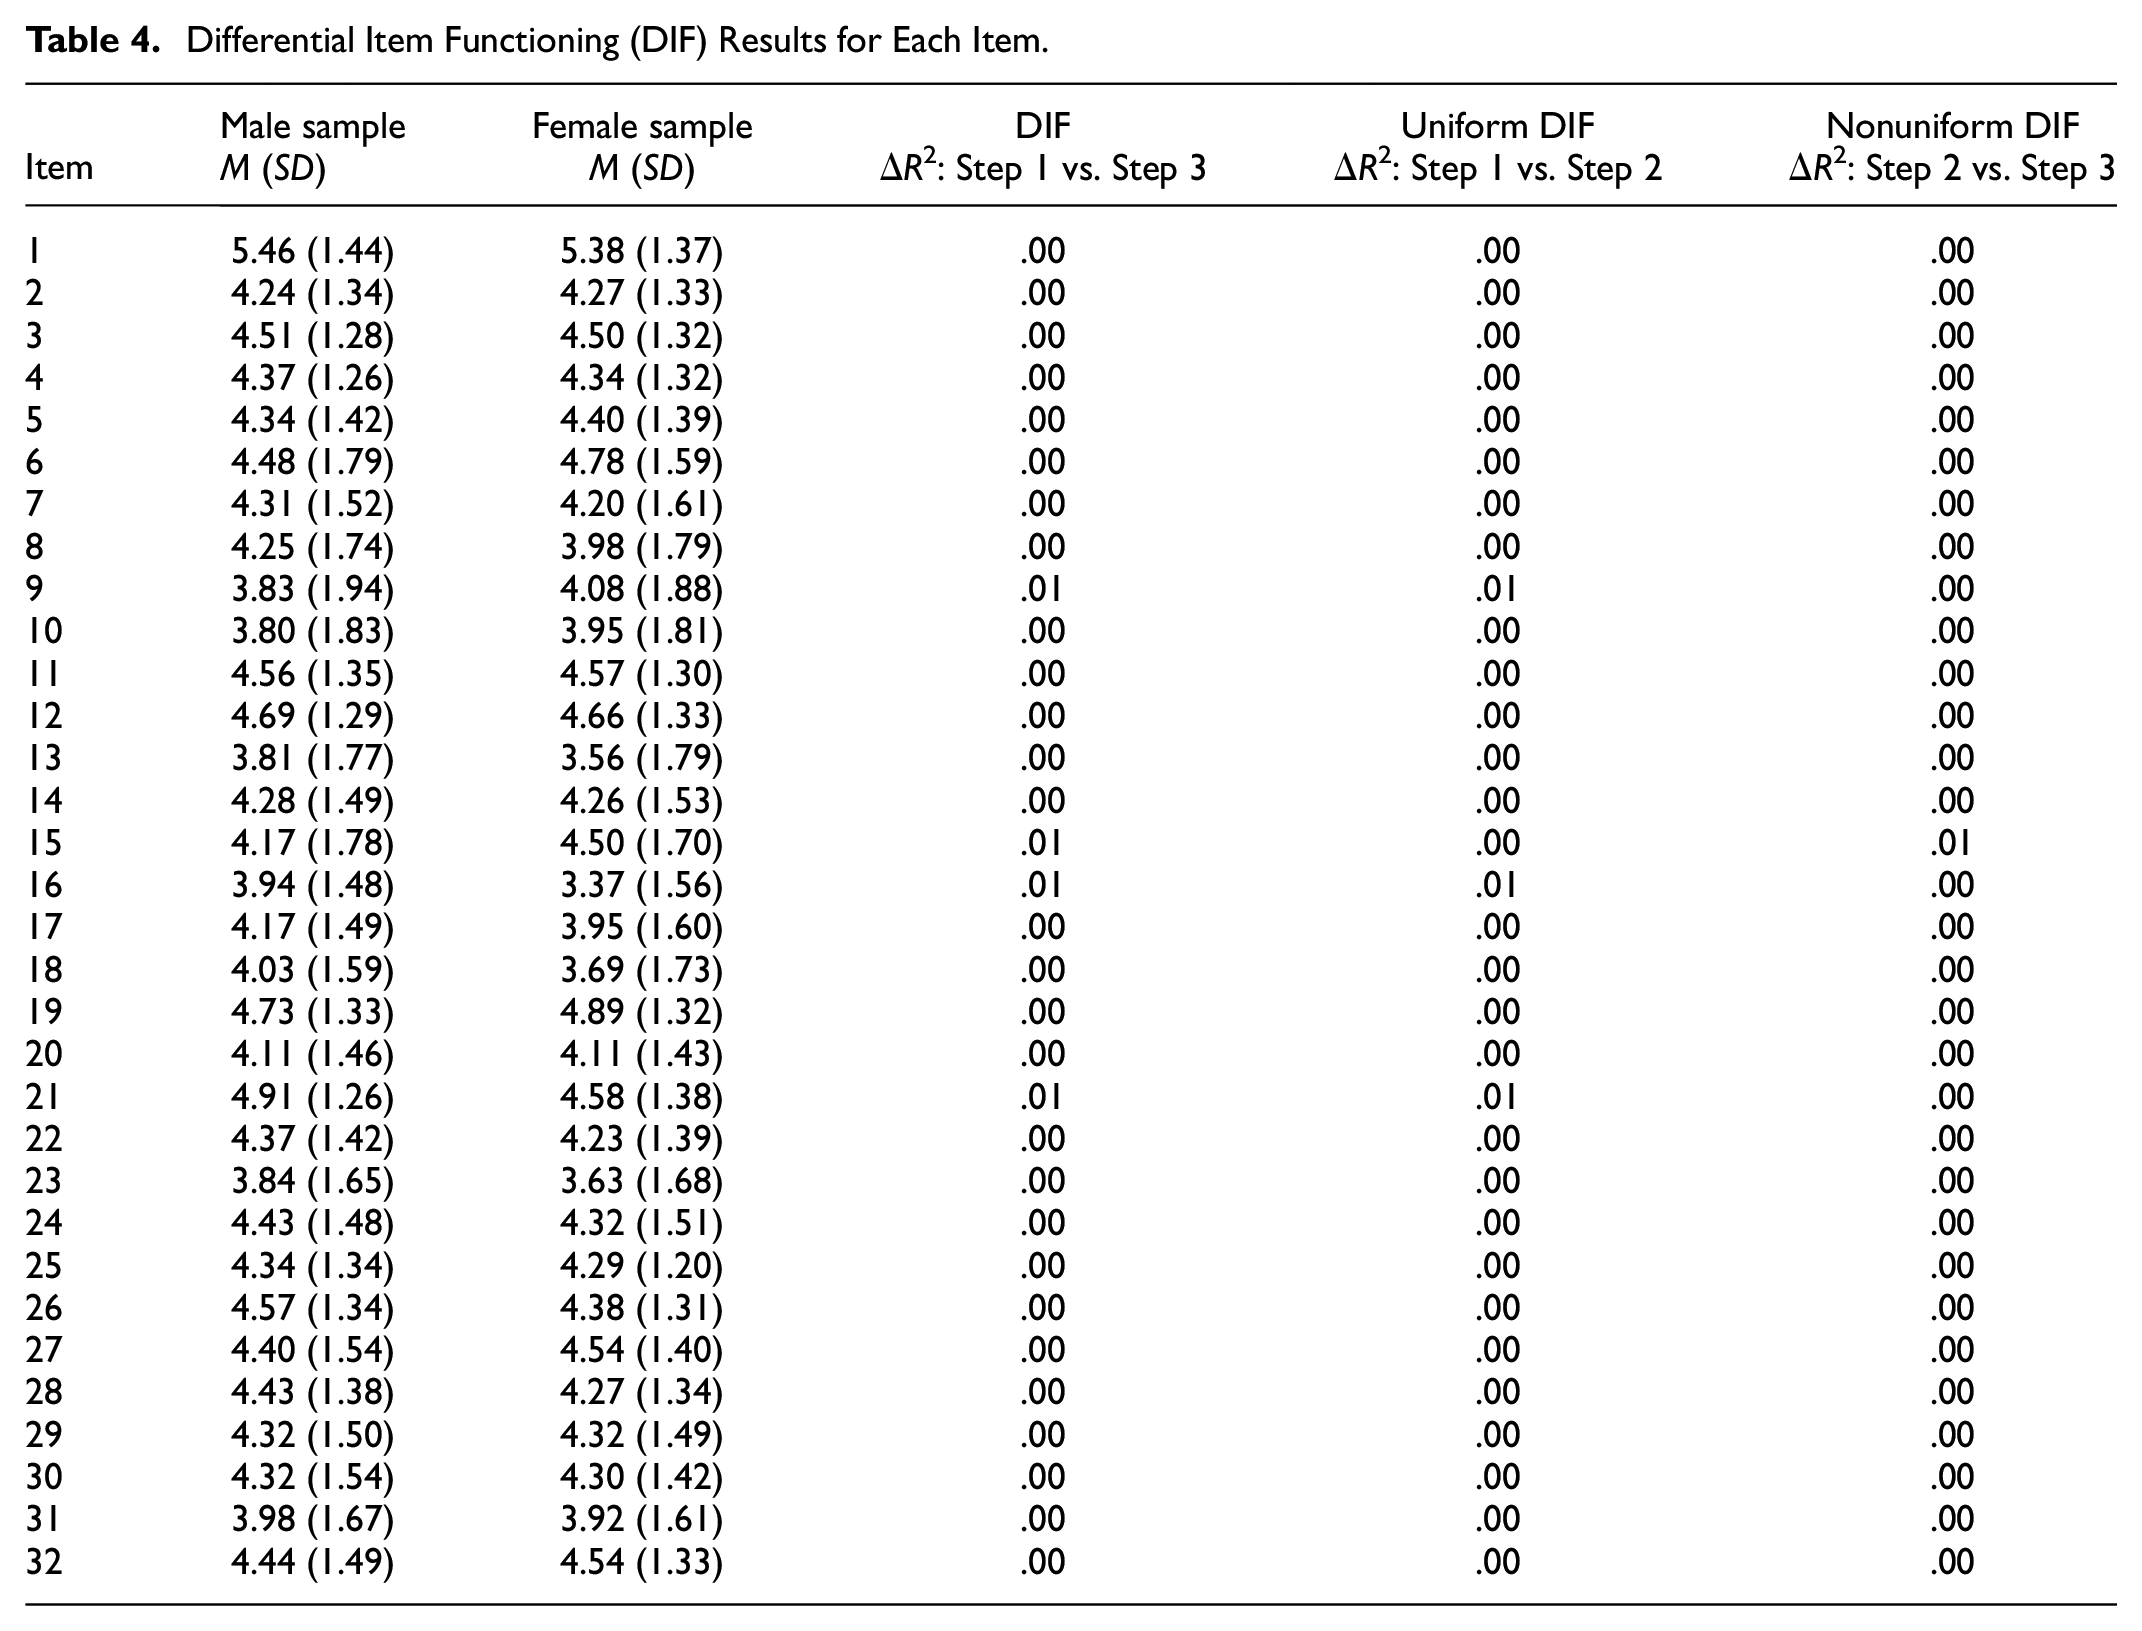
Results for the DIF analysis across two gender samples are shown in Table 4. The second and third columns in the table are the mean and standard deviation for the raw score of each item. According to the change of McFadden’s pseudo
Differential Item Functioning (DIF) Results for Each Item.
Category Response Curves
Figure 1 shows the category response curves for each item. Most items had satisfactory category response curves, with each category displaying discrimination ability to some extent. However, for items 6 (row 1, column 6), 10 (row 2, column 3), and 15 (row 3, column 1), response curves for categories 2, 3, 4, and 5 were nearly coincided and intertwined with each other. This indicated that the three items failed to utilize all six response options (categories); that is, four response categories, except categories 1 and 6, provided little information for differentiating participants with various levels of intimate relationship satisfaction. Accordingly, the abovementioned imperfect performances were in line with their moderate discrimination values found in the GR model parameters in Table 3. Nevertheless, the first and sixth category response curves in these three items (items 6, 10, and 15) differentiated well among individuals located at different points and covered the whole ability scale.

Category response curves.
Item and Test Information Functions
Figure 2 shows the item information curves for the CSI scale. Similar to category response curves, most items seem to provide enough information across the whole latent trait of intimate relationship satisfaction, except for items 10 (row 2, column 3) and 15 (row 3, column 1) whose information curves were flat and close to 0 across the entire range of the latent scale.
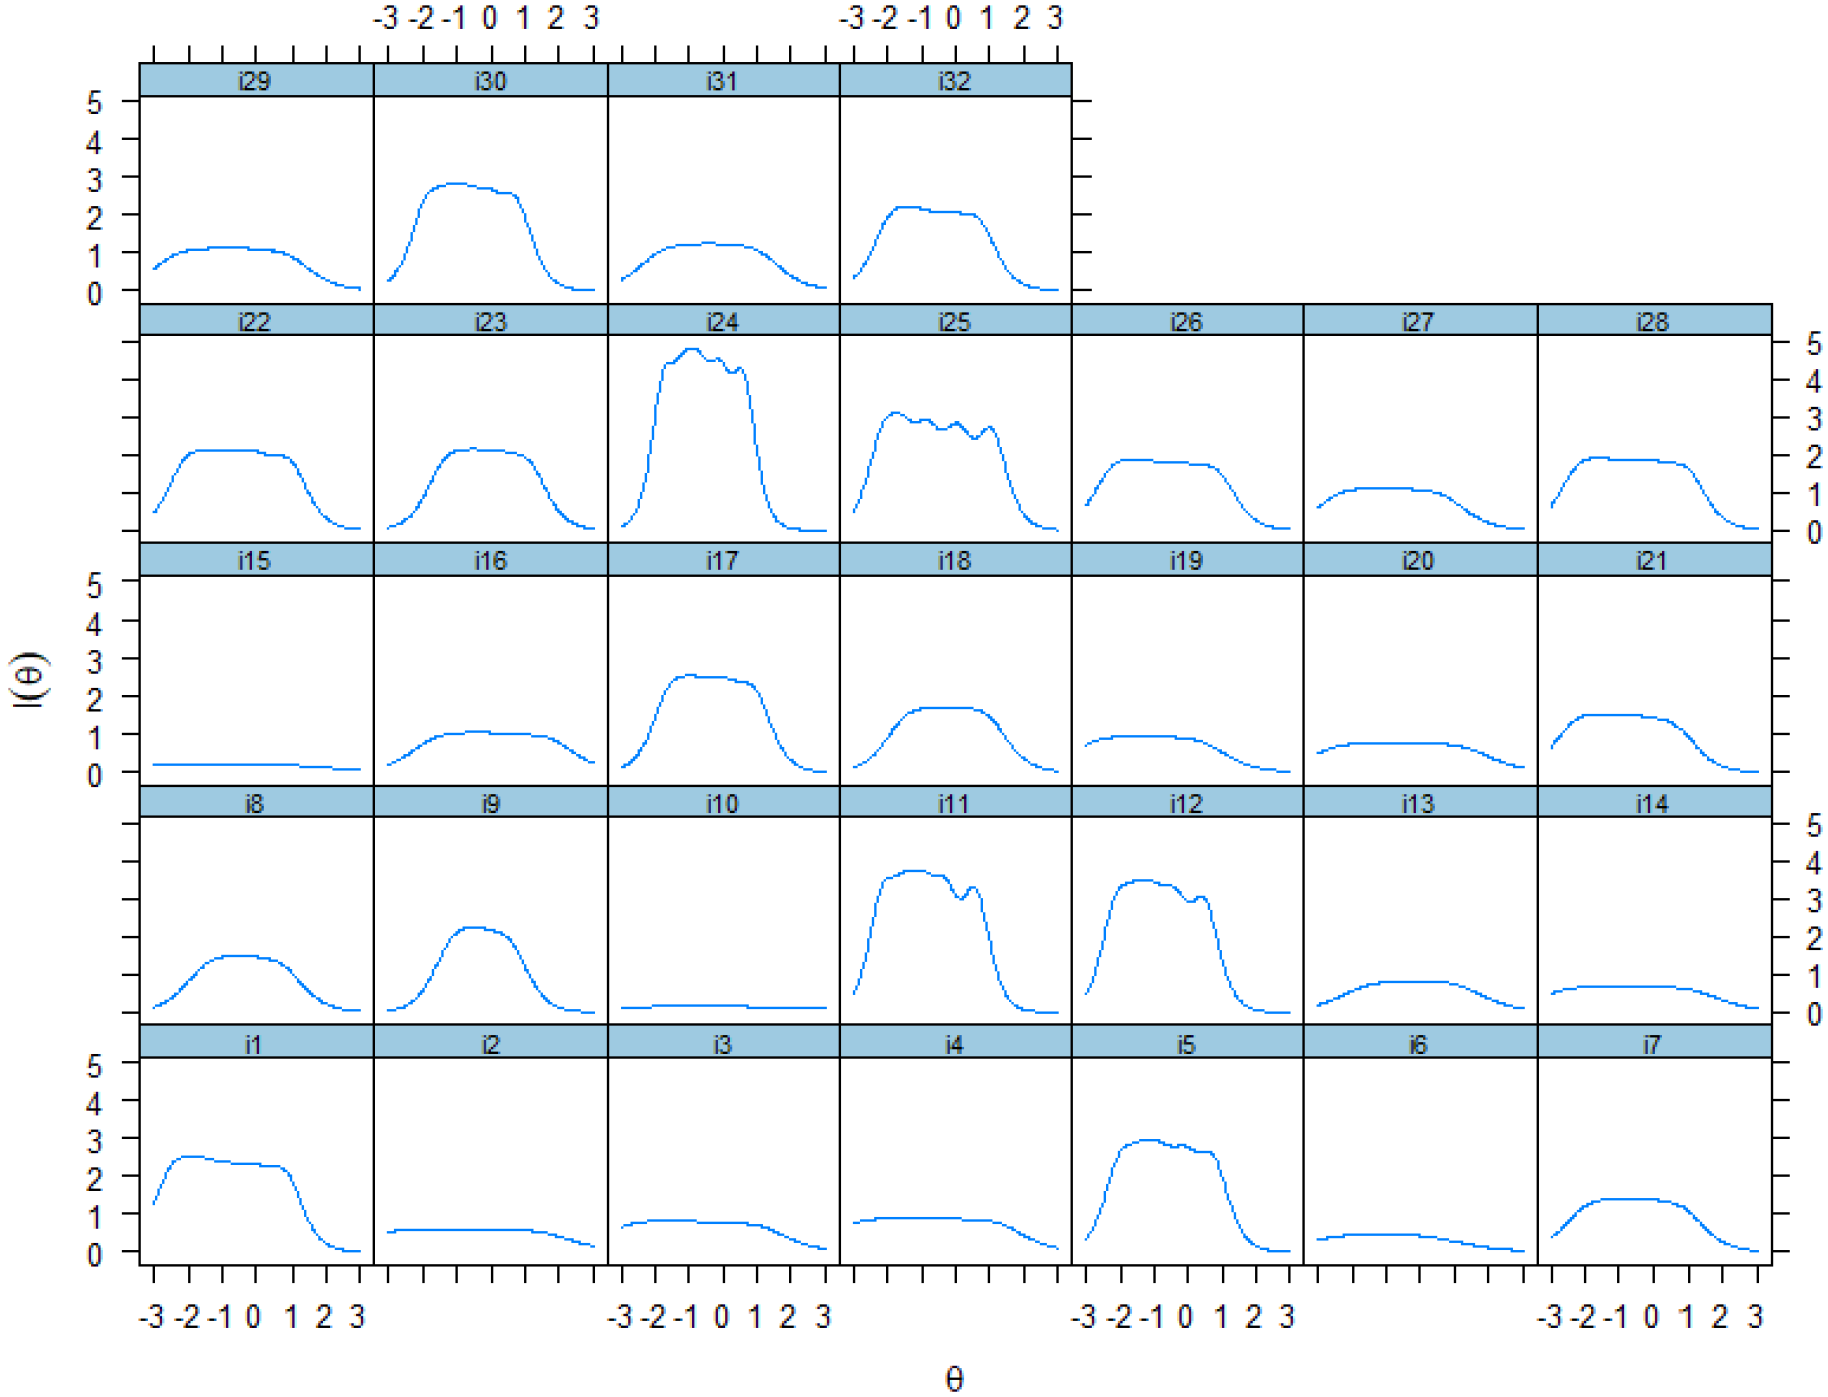
Item information curves.
Figure 3 shows the test information curve for assessing the intimate relationship satisfaction. The CSI scale provided good information across the lower end and middle of the latent trait, indicating that the CSI scale accurately and reliably produces information about participants located near that range. Especially, when the CSI scale was administered to participants whose ability is less than 1.9 or 2.4 (see the two vertical dotted lines at those values in Figure 3), test information exceeds 5 and 10 (equivalent to the traditional reliabilities of 0.80 and 0.90), respectively. The scale provided the largest test information (i.e., highest reliability and accuracy) around
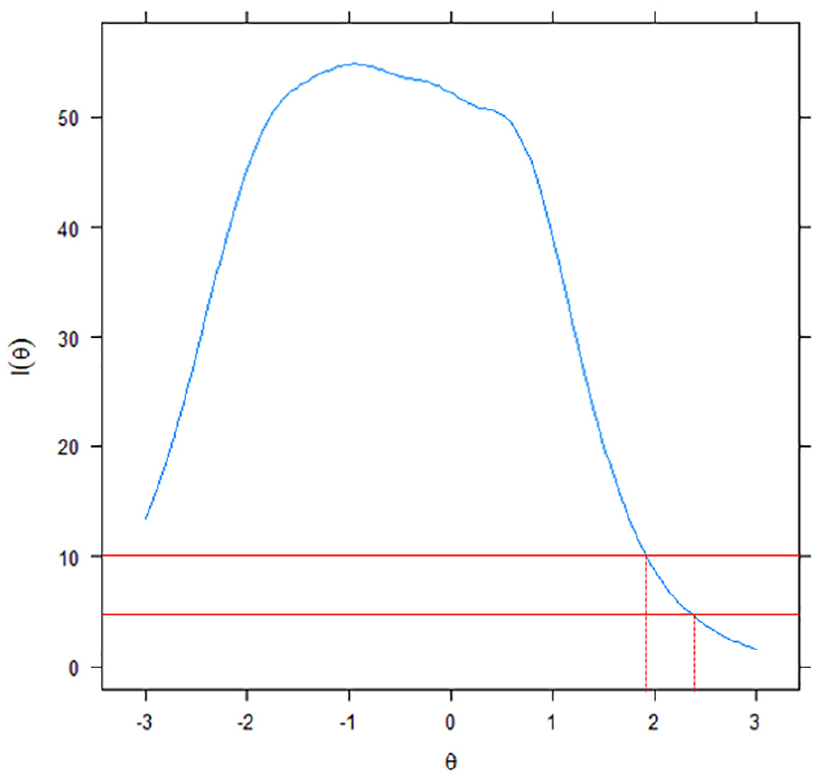
Test information curve.
Discussion
The current study used IRT techniques to validate the Chinese version of the CSI scale and investigate potential DIF across two gender samples. Generally speaking, the adapted CSI scale showed satisfactory psychometric statistics, in the aspects of assumption checking, GRM fitting, response curves and information, and DIF analysis. Moreover, several findings deserve more attention and discussion.
IRT Assumptions
Two key IRT assumptions, unidimensionality and local independence, were checked in this study. No strong evidence of violation of the two assumptions was observed. Specifically, the EFA results clearly showed that the CSI scale was unidimensional, which is in line with the conclusions from Funk and Rogge (2007) and other studies (Lamela et al., 2020; Okhotnikov & Wood, 2020; Qadir et al., 2013).
For the local independence assumption, Yen’s
The two sets of adjectives for items 26 and 28 in semantic differential format are “boring vs. interesting” and “empty vs. full,” respectively. The semantic differential formats between these two items shared the same scoring rubrics, which might cause the LD between them (Baghaei & Aryadoust, 2015; Jiao et al., 2012; Yen, 1993). The LD between items 27 and 29 can be explained with this logic as well. To be mentioned, both of them used the reverse-scored semantic differential scale, which might cause the LD and other identification problems (Eichenbaum et al., 2019).
On the other hand, it was found that a single critical value for the
Overall, it could be concluded that the two IRT key assumptions were hold reasonably well. Nevertheless, more evidence on local independence assumption should be gathered in further studies.
Graded Response Model
After fitting the GR model, all items from the CSI scale showed parameter estimates (i.e.,
Differential Item Functioning
This study also aims to verify whether DIF exists in the CSI scale between two gender samples. As the results indicated, no significant DIF was detected, which ensured the equity and validity of the CSI scale. It is important to note that no DIF between gender samples does not indicate little or no gender differences exist for intimate relationship. Conversely, men and women are distinct from each other in many aspects of intimate relationship (Caldwell et al., 2012; Hamby, 2014; Mark & Murray, 2012), while also maintaining some similarities (Fagan & Wright, 2011; Larsen et al., 2011; Romito et al., 2013). On the other hand, as Bradbury and Karney (2014) stated, “our sex consistently accounts for how we think about intimacy, pursue and maintain intimacy, repair rifts in our intimate relationships, and respond when intimacy is threatened or lost.” As an effective scale without DIF, the CSI scale can be readily used in the studies about the similarities and discrepancies of intimate relationship between genders.
Conclusion
The Couples Satisfaction Index (CSI) is widely used in intimate relationships assessment. However, there is no research about adapting it to the Chinese context. This study employs IRT techniques to validate the revised Chinese CSI and examine its fairness across different gender groups. The statistical analyses include unidimensionality, local independence, fit of the GR model, DIF, category response curves and information functions. Overall, the adapted Chinese version of the CSI scale showed satisfactory psychometric performances and exhibited no systematic DIF between genders. It is expected that results of this study will facilitate the advancement of intimate relationship studies.
Limitations should be taken into consideration when interpreting the results from this study. First, although we tried to recruit as many participants as possible, the sample used in this study was not large and representative enough to generalize results over other age groups, ethnic groups and the Chinese living in other cultures, for example, Chinese Americans. Second, with respect to the results from IRT analyses, there were a few cases where the performance of the CSI scale was not completely satisfactory, which calls for more research on gathering further validation evidence from various other applications and statistical techniques. Among them are, for example, checking the unidimensionality assumption using confirmatory factor analysis (CFA), revising or removing items to alleviate the dependence between several items, and improving the scale performances when applied to participants with high or low satisfaction.
Supplemental Material
sj-docx-1-sgo-10.1177_21582440241271087 – Supplemental material for The Chinese Version of the Couples Satisfaction Index: Psychometric Assessment and Differential Item Functioning Analysis with Item Response Theory
Supplemental material, sj-docx-1-sgo-10.1177_21582440241271087 for The Chinese Version of the Couples Satisfaction Index: Psychometric Assessment and Differential Item Functioning Analysis with Item Response Theory by Shaojie Wang, Won-Chan Lee and Huixia Ma in SAGE Open
Footnotes
Declaration of Conflicting Interests
The author(s) declared no potential conflicts of interest with respect to the research, authorship, and/or publication of this article.
Funding
The author(s) received no financial support for the research, authorship, and/or publication of this article.
Ethical Approval
Review and approval for the study procedures were obtained from the university institutional review board prior to study onset. Before answering the scale, participants received an information sheet online that assured them that the data obtained would be handled confidentially and anonymously, and they were asked to give electronic informed consent.
Data Availability Statement
Data are available upon request.
Supplemental Material
Supplemental material for this article is available online.
References
Supplementary Material
Please find the following supplemental material available below.
For Open Access articles published under a Creative Commons License, all supplemental material carries the same license as the article it is associated with.
For non-Open Access articles published, all supplemental material carries a non-exclusive license, and permission requests for re-use of supplemental material or any part of supplemental material shall be sent directly to the copyright owner as specified in the copyright notice associated with the article.