
Abstract
This paper investigates the impact of student-centered teaching strategies (SCTS) on the educational attainment of econometrics students, at a university based in the UK. Theoretical foundations underlying the usage of SCTS suggest that SCTS is better for students’ long-term recall, comprehension, problem-solving abilities and interest in the subject. Yet, most existing studies have only examined short-run outcomes, and none in technical social-science fields. We contribute to the literature by empirically analyzing whether SCTS affects the long-term learning outcomes for a STEM-related social-science subject like econometrics, by comparing the impact of SCTS with traditional teacher-centered strategies using a repeated cross-sectional sample spanning over four academic years. Our results provide robust evidence that SCTS is positively associated with students’ grades in the long run. Heterogeneity analyzes additionally indicate that female students and those in the upper quantiles of the grade-distribution disproportionately benefit more from SCTS.
Plain Language Summary
This study contributes to the literature by comparing the effectiveness of student-centered teaching strategies (SCTS) with traditional teacher-centered strategies using a repeated cross-sectional sample spanning over four academic years to investigate whether SCTS affects the long-term learning outcomes for a STEM-related social-science subject like econometrics. We specifically use a UK university as a case study to exploit a change in class organization wherein economics and management students are now enrolled in different econometrics courses. The results show that SCTS enhances students’ long-term econometrics performance by roughly 3% in comparison to the mean grade. This study implies that SCTS has a significant impact on the labor market’s ability to fill positions that are more technical and quantitative. Additionally, heterogeneity analyses show that female students and students in the higher quantiles of the grade distribution benefit disproportionately more from SCTS. As a result, it’s critical to recognize and apply the aspects of SCTS that are equally appealing to both genders. This finding carries important implications for the teaching of technical social-sciences, not just limited to econometrics, but also public policy courses that require causal evaluation of programs and laws.
Keywords
Introduction
Efficient and appropriate teaching strategies produce top academic performance, and are the cornerstones of academic institutions (Andrietti, 2014; Giddens et al., 2012; Sothan, 2019). Traditionally, lecturers have mostly been responsible for determining the milieu in which students learn, based on previous teaching experience, to which the pedagogical literature refers as the “teacher-centered teaching strategy” (TCTS) (Shah, 2020). In TCTS, lecturers directly transfer knowledge to students in the classroom and decide on the learning process and environment (Dong et al., 2019). It is often associated with a teaching style whereby students passively receive knowledge and information from the lecturer, and do not actively partake in the decision-making process when it comes to learning. Over time however, as class content and materials evolve, it is important for lecturers to revise, adapt and develop methods of teaching to ensure that students properly absorb new concepts. Particularly in technical social-science subjects like econometrics, many novel empirical methods are regularly invented and introduced into the course curriculum. Therefore, to help students quickly grasp this new content, more hands-on computer lab sessions for example, have increasingly been implemented to solidify and complement students’ knowledge in econometric theory (Becker & Greene, 2001; Rosenberg et al., 2003; Wilson et al., 2019). This type of teaching method falls under the umbrella of “student-centered teaching strategies” (SCTS), which give students the opportunity to be the leaders and decision-makers of their own learning (Mayer, 2004). Lecturers can implement SCTS by various instructional practices fostering a self-guided and active learning process, such as problem-based learning, project-based learning, flipped classroom and blended learning (Hoidn & Reusser, 2020; Roach, 2014; Weimer, 2002). Compared to TCTS, this method moves away from what teachers want to do, to what students need to achieve in terms of proper learning outcomes. Moreover, SCTS considers students’ learning needs, abilities, interests, aspirations, and cultural backgrounds, thereby making learning more independent of the teacher (Clarke, 2010; Hoidn & Reusser, 2020; Weimer, 2002).
To date, studies examining the effect of SCTS in technical social-sciences such as econometrics, remains scarce and inconclusive (Bara & Xhomara, 2020; Clements et al., 2013; Cordero & Gil-Izquierdo, 2018; Ganyaupfu, 2013; Giles et al., 2006; Kang & Keinonen, 2018). While some research examines the impact of SCTS on science-related fields like mathematics and statistics, it is not possible to generalize results to social sciences like econometrics due to these subjects’ different nature and content. In addition, most of these studies examine the impact of SCTS on short-term learning outcomes for science-based subjects, but not on long-run outcomes. As the demand for more technical knowledge increases in the labor market, it is important to uncover the teaching methods that help to enhance and cement students’ technical skills in the long run. Scholars like Felder (1993), Hoidn and Reusser (2020) and Soubra et al. (2022) argue that SCTS result in learning outcomes (i.e., comprehension, long-term recall, problem-solving abilities, and positive attitudes toward the subject) that persist over time compared to TCTS, which has been shown to be more effective for short-term recall among students.
In this paper, we therefore add to the scant literature by examining the long-term impacts of SCTS for a quantitative social science subject like econometrics. Specifically, we exploit a change in class structure using a university in the UK as a case study, where economics and management students are now placed in separate econometrics courses. SCTS was used for the group of management students, whereas TCTS was employed for the group of economics students. Subsequently, this paper empirically examines whether management students who received SCTS performed better in the long run than their counterparts who were exposed to TCTS. We also conduct heterogeneity analyses on whether the effect of SCTS on educational attainment varies across students’ ethnicity, gender, age, and academic strength. At present, only a handful of studies have assessed the effects of SCTS for different student characteristics such as ethnicity, (Salinas & Garr, 2009; Talbert et al., 2019), gender (Giles et al., 2006; Laursen et al., 2014), age or academic strength. It is important to account for the fact that students may construct knowledge and reality based on what they were previously exposed to, which in turn may be influenced by personal characteristics (Hattie, 2008). Moreover, Echazarra and Mostafa (2020) show that the effect of SCTS varies by school environment and students. Understanding if there are variations in the impact of SCTS along several dimensions such as gender, age, ethnicity and academic strength is therefore essential for identifying more vulnerable student groups.
Student-Centered Teaching Strategies (SCTS) in Theoretical and Empirical Literature
Theoretical Foundations of Student-Centered Teaching Strategies (SCTS)
Wright (2011) argues that across many colleges and universities, there has recently been a shift in focus from TCTS toward SCTS. According to self-determination theory (Ryan & Deci, 2000), teaching strategies range from teacher-centered to student-centered instruction (Edmunds et al., 2008; Haerens et al., 2015; Tessier et al., 2010). In teacher-centered instruction, lecturers directly transfer knowledge to students, and by determining the learning process and designing the learning environment, they take on the role of a decision-maker (Dong et al., 2019). In contrast, student-centered strategies promote a self-directed, responsible, and active involvement of students in the learning process, while teachers play a more facilitating role (Hoidn & Reusser, 2020). Weimer (2002) identifies five main dimensions in which teacher-centered and student-centered teaching strategies differ: (1) balance of power in the classroom, (2) function of the course content, (3) role of the teacher versus role of the student, (4) responsibility for learning, and (5) purpose and processes of evaluation.
Student-centered teaching strategies (SCTS) are influenced by constructivist thinking where teachers provide opportunities to students “to acquire knowledge and construct meaning through their own activities, through discussion, reflection and the sharing of ideas with other learners with minimal corrective intervention” (Hattie, 2008, p. 26). In this view, learning is an active participation process where students themselves are involved in constructing and organizing knowledge by gathering and synthesizing information (Kassem, 2018; Mayer, 2004; Weimer, 2002). Moreover, this teaching strategy emphasizes not only students’ learning processes but also the entire learning context (Hoidn & Reusser, 2020). Thus, in constructivist thinking, teaching strategies shift from focusing on what teachers want to do to what students need, while considering students’ learning needs, abilities, interests, aspirations, and cultural backgrounds to achieve learning goals (Hoidn & Reusser, 2020; Weimer, 2002). With this shift, teaching becomes more independent of the lecturer and hence encourages lifelong learning (Clarke, 2010; Weimer, 2002). Moreover, by emphasizing the importance of the knowledge acquisition process, SCTS requires teachers to fulfill a role different to that expected from “traditional” teacher-based instruction (Mayer, 2004). In the classroom, teachers can use various pedagogical practices to implement SCTS, such as provide students with new experiences with the help of scenarios, problems sets, role-play situations or discussion and reflection in groups (Clarke, 2010; Hoidn & Reusser, 2020; Weimer, 2002). Specifically, students are allowed to create knowledge on their own, and through collaboration and interaction within a group (Clarke, 2010). Besides group work, SCTS also includes experiential learning and learning from reflection (Clarke, 2010).
SCTS entails stronger and more active engagement of students, which is in line with neurologists’ and cognitive scientists’ argument that students must engage in active forms of learning to effectively utilize their mental capacity (Hoidn & Reusser, 2020). Previous evidence shows that SCTS not only enhances students’ learning motivation (McCombs et al., 2008; Polly & Hannafin, 2010) but also increases deep understanding of knowledge acquisition (Hanewicz et al., 2017; Lin, 2015; Yamagata, 2018) and critical thinking abilities (Cornelius-White, 2007; Şendağ & Ferhan Odabaşı, 2009). Scholars like Felder (1993), Hoidn and Reusser (2020) or Soubra et al. (2022) suggest that while TCTS is more effective for short-term recall of facts, SCTS is better for comprehension, long-term recall, problem-solving abilities, positive attitudes and increased interest in the subject.
SCTS can also include retrieval practices, which yield significantly greater long-term retention of the studied materials through tests (Moreira et al., 2019). According to Wilson et al. (2019), SCTS additionally integrate a variety of technology including computer-aided instruction (CAI), which has become an increasingly popular way to provide information to students, patients, and practitioners (Rosenberg et al., 2003). By changing the structure, delivery and assessment of courses, the application of new technologies plays an important role in teaching strategies, especially in the teaching of economics (Elliott, 2003; Middleditch & Moindrot, 2015; Roach, 2014; Zhang & Fang, 2022). CAI for example increases student engagement and helps them re-experience lectures at anytime, anywhere and at their own pace (Samaranayake, 2020). This experience is important due to a multitude of reasons such as language barriers, gaps in terminology knowledge, and the fact that some students may not be able to process information as quickly as others (Pale et al., 2011).
Table 1 below summarizes the main differences between SCTS and TCTS as discussed in the literature (see also Hoidn & Reusser, 2020; Serin, 2018):
Differences Between SCTS and TCTS in Theory.

Empirical Evidence on Student-Centered Teaching Strategies (SCTS) in Quantitative Courses
Extensive empirical literature has explored how teachers affect the academic performance of students. From this literature, a common thread that emerges is that the teacher, the quality of teaching (e.g., Andrietti, 2014; Sothan, 2019) and teaching strategies (e.g., Giddens et al., 2012) are important predictors of academic performance and achievement. However, as the quality of teaching and strategies are difficult to measure or quantify, most of the literature focuses on the effect of lecturer characteristics, such as experience, education, or certificates (Cordero & Gil-Izquierdo, 2018). Moreover, existing research on teaching strategies in higher education mainly covers fields such as nursing, physical sciences, or languages (e.g., Bechter et al., 2019; Kassem, 2018; Wilson et al., 2019), whereas only a handful of studies are on technical subjects like econometrics (a subfield of economics) or related fields such as statistics, mathematics, or science. In addition, most of this literature examines single teaching practices such as problem-based learning (Bara & Xhomara, 2020; Karpiak, 2011), retrieval practices (Lyle et al., 2020; Lyle & Crawford, 2011) or use of computer technology (Becker & Greene, 2001), but not how a comprehensive set of teaching practices related to SCTS affect student achievement.
Currently, the evidence on the impact of SCTS versus TCTS is mixed. These studies not only differ in the examined SCTS related instructional practices, but also the analyzed subject and how the outcome is measured. In a pilot study on an introductory university statistics course, Giles et al. (2006) applied an experimental design where students were exposed to both student-centered and teacher-centered teaching. Looking only at short-term achievement outcomes measured by quiz scores, they found that TCTS students had a slightly higher score compared to those in the SCTS class. In line with this finding, Cordero and Gil-Izquierdo (2018) and Echazarra and Mostafa (2020) show that TCTS has a positive impact—while SCTS has a negative one—on students’ mathematics and science proficiency, respectively, as measured in the Program for International Student assessment (PISA). This finding was supported by Kang and Keinonen (2018) who analyze the Finish PISA data on students’ science literacy focusing on their use of science in real-life problems. In contrast, Bara and Xhomara (2020) find a positive correlation between SCTS and academic achievement scores in science, albeit again, the study focused on short-run outcomes. Other research has shown, however, that teacher-student interactive instruction leads to the best mean test scores in a statistics assessment compared to TCTS and SCTS (Ganyaupfu, 2013), or that the two were almost as equally effective in increasing student performance in a class assessment in mathematics (Clements et al., 2013). Looking at mathematics instruction, Talbert et al. (2019) find that SCTS is positively related to mathematics engagement and Laursen et al. (2014) show that SCTS students report greater learning gains on different measures, including understanding and thinking, confidence, persistence, and collaboratively working with others.
In addition, there remains scarce evidence on the heterogeneous effects of SCTS in a science-related subject in terms of different student characteristics (Echazarra & Mostafa, 2020). Only two of the mentioned studies look at whether the results differ between males or females: Giles et al. (2006) do not find an influence of gender, whereas Laursen et al. (2014) conclude that SCTS may offer several features that may be particularly effective for women. For ethnicity, Talbert et al. (2019) provide evidence that the effect of SCTS on mathematics engagement differs by ethnicity, whereas Salinas and Garr (2009) find that minority students in elementary school SCTS classes can close the performance gap with their non-minority peers. Based on the theoretical considerations and the empirical evidence discussed in this section, we formulate the following hypotheses for our subsequent analyses:
H1: As we expect that SCTS is more effective than TCTS in the long run, we hypothesize that the students in the SCTS class outperform those in the TCTS class in later semesters.
H2: As the effectiveness of SCTS also depends on students’ previous’ experience and background, we hypothesize that the effect of SCTS on student performance varies by student characteristics.
Data and Method
Study Context
Treatment (SCTS) Versus Control (TCTS) Groups
Traditionally, the Department of Economics (DoE) offers Econometrics I in semester 1 (S1) for various postgraduate degree programs in economics and management. This unit provides students with the knowledge they need for modern econometric techniques, particularly the utilization of economic and financial data for conducting research in economics and finance. Another goal of this unit is to help students understand the basics of econometrics and prepare them for the Econometrics II course in semester 2 (S2) and for the dissertation unit. In the academic year of 2016–17, both economics and management students who were previously placed in the same S1 Econometrics I class were now divided into two separate classes, with economics students now allocated to the one at the DoE, and management students to the one at the School of Management (SoM). There were several reasons for this change: (a) the original class size was too large and had more than 300 students, (b) due to the workload policy at the university, each lecturer was only allowed to teach a limited number of classes, and (c) when students were divided into different classes, lecturers had the autonomy to use their preferred teaching strategy for the class. While lecturer 1 applied SCTS to SoM students (i.e., the treated group), lecturer 2 applied the conventional TCTS to the group of DoE students (i.e., the control group).
Subsequently, to investigate whether SCTS improves outcomes for econometrics students in the long run, we use S2 grades as a proxy for long-run student performance after being exposed to SCTS in S1. As the S2 Econometrics II unit builds upon content from the S1 Econometrics I unit, the impact of SCTS conducted in the previous period (i.e., S1), should be reflected in students’ performance in the subsequent period in S2. Additionally, as the final exam in S1 was different for the SoM and DoE students, it is not feasible to properly elicit the true impact of SCTS versus TCTS on student performance using S1 grades. Additionally, existing studies on this topic have suggested that examining long-run effects is likely to be more relevant for teaching methods like SCTS as active strategies may have a lagged impact on student performance (Felder, 1993; Hoidn & Reusser, 2020; Soubra et al., 2022).
Structure and Nature of Courses
The two units taught to economics and management students in S1 were worth six credit points. Teaching and learning activities consisted of a total of 22 hr of lectures and 16 hr of problem sets and computer labs classes, delivered over a span of 12 weeks. The final exam accounted for 70% of the final grade, and course work throughout the semester was worth 30%. The teaching material, content, and syllabus for the two courses offered separately to the DoE and SoM students were identical, and only the teaching method and final exam was different. The main textbook used for the two Econometrics I courses was “Introductory Econometrics for Finance by Brooks (2019).” Subsequently, in the following semester (S2), students from the two groups were required to take the same advanced unit called Econometrics II and were taught by the same lecturer, lecturer 3. This course built on the basic econometric methods and concepts covered in Econometrics I in S1. In total, the theoretical material, methodology and empirical examples were covered in 11 lectures of 2 hr each, with an additional 7 supporting lectures that combined problem sets and computer labs. The summative assessment of this unit put a weight of 70% on the final exam and 30% on coursework, like Econometrics I.
As part of SCTS, Cook and Elliott (2016) proposed a practical approach that builds on learning-by-doing with a combination of lectures, exercises and student-led computer workshops especially when teaching econometrics. Accordingly, Table 2 below summarizes the teaching methods that were applied to SoM students (treatment group), but not to DoE students. Specifically, the online quizzes—one of the tools for retrieval practices (Moreira et al., 2019)—included built-in hints in response to incorrect answers, so students received instant feedback about their understanding and teachers get the information they need to address learning gaps. Video recording of lectures and pre-recorded Supplemental Material also allowed students to review segments of the lectures at their own pace and time. SoM students who were part of the treated group and thus exposed to SCTS related methods also had real-time slide annotations during lectures using computer-aided instruction software such as “whiteboard,” thus any notes or annotations made by the lecturer in class were immediately available to students. The lecturer was therefore able to respond to students’ needs by adding more information from questions asked during class.
Differences Between SCTS and TCTS in Practice.

SoM students also had access to short instruction videos posted on media platforms like YouTube that complemented material from lecture slides. These videos provided a quick snapshot of information and were highly selective with the aim of maximizing students’ focus, time, and energy. There were also differences in the frequency of lab-work and tutorials, where students exposed to SCTS had more “hands-on” learning in labs using computer software. Lastly, because fewer economics pre-requisite courses were required for the management versus economics program, the group of management students who received SCTS were also provided with additional material to prepare them for the econometrics class. For instance, lecture notes containing clarification of content and material, foundational mathematics and statistics notes as well as additional econometrics topic material were supplied to the SCTS group. Lastly, students’ feedback about the class was also considered for future teaching.
Data Collection and Sample
At the end of each semester every year, data on students’ overall econometrics grades is collected from the two groups. Figure 1 illustrates the process of data collection and analysis of students’ performance for each academic year. In summary, the diagram explains differences in lecturers for Econometrics I taken by DoE and SoM students in S1, and shows that students had the same lecturer (lecturer 3), and final exam in S2 for the Econometrics II unit. The sequence is repeated over a 4-year study period (2016–2019) without any substantial changes. In S1, lecturers 1 and 2 teach Econometrics I in parallel. The only differences are the method of teaching, whereby lecturer 1 applies SCTS and lecturer 2 applies the TCTS, and the final exam. We therefore expect to see the effect of SCTS implemented in S1 to be reflected in the long run educational outcomes of students in S2.

Treatment and control groups.
The data employed in this paper are extracted from the Board of Examination reports published by the Department of Economics (DoE), at a UK based university. Due to data privacy reasons, the name of the university is confidential. Table 3 presents the distribution of the demographic characteristics used as covariates in the empirical analysis over the four-year period considered in this paper. The dataset is a repeated cross-section of four academic years. Accordingly, students are grouped into cohorts as a function of the year they commenced their studies. Table 3 shows that enrollment across the years ranged between 129 and 225 for the TG, and between 36 and 75 for the CG. The pooled sample contains 993 students, where international students from China constitute most participants, and both the TG and CG have a similar proportion of Chinese. The average age of students across all years is quasi-identical (i.e., 23 years old) for both the TG and CG, in line with the expected age that one begins a postgraduate degree (i.e., 1–2 years after completion of one’s undergraduate studies). The TG had a higher proportion of females in all years compared to the CG. The statistics also reveal that in general, the number of female students in both the CG and TG was disproportionately larger than the number of male students. Lastly, as data on other key predictors of student performance—for example, class attendance—is not available, it is not possible to rule out omitted variable bias. Nonetheless, as lecturers reported that class attendance was at least 80%, we argue that this bias was not likely to be large. Nevertheless, the following results should be interpreted indicatively rather than causally.
Descriptive Statistics of Students’ Characteristics.

Note. For age, students’ average (arithmetic mean) is reported. The standard deviation of age per group (treatment and control) and year is reported in parentheses in the respective row. All other variables reported in the above table represent a count of the corresponding characteristic. Percentages of the full sample with corresponding characteristics are in parentheses.
Empirical Method
To investigate whether SCTS is more effective at improving students’ performance compared to the traditional TCTS, we append students’ grades in S2 across all the years to the students’ characteristics and create a pooled cross-sectional dataset. Albeit it is not feasible to analyze the impact of SCTS on S1 grades, we present the mean and standard deviation of S1 econometrics grades in Table 4, with additional summary statistics in Table A1 of the online Supplemental Material. Taken together, these statistics provide suggestive evidence that SCTS was successful in narrowing the distribution of grades relative to TCTS as the standard deviation of Econometrics I grades was smaller for SoM students exposed to SCTS compared to DoE students exposed to TCTS. Additionally, the mean grade for each cohort was generally higher for SCTS students compared to TCTS students.
S1 Performance Statistics (Mean and Standard Deviation) for Econometrics I.
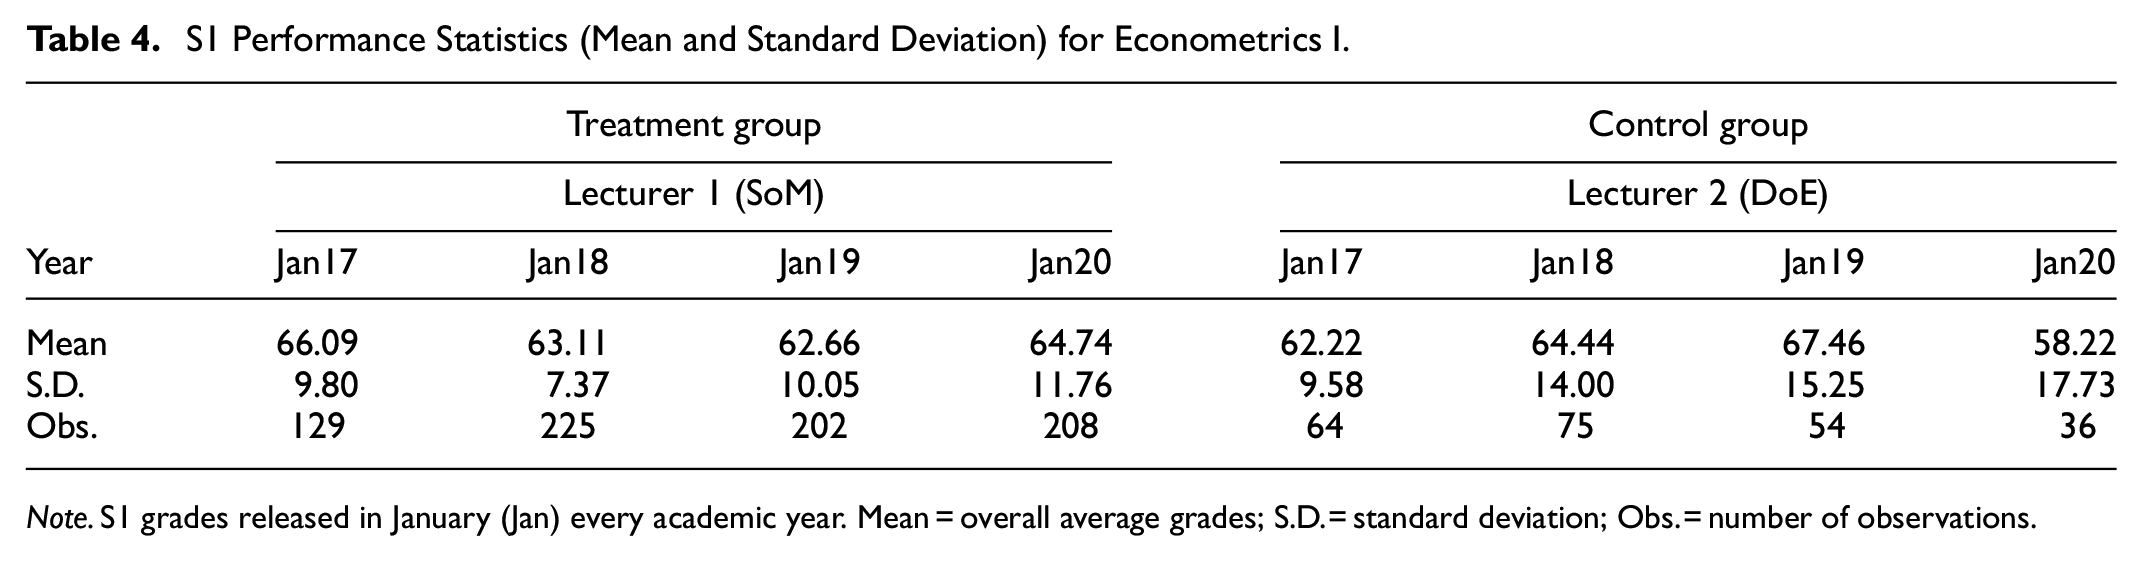
Note. S1 grades released in January (Jan) every academic year. Mean = overall average grades; S.D. = standard deviation; Obs. = number of observations.
To empirically evaluate the impact of SCTS relative to TCTS, we run the following OLS regression using the repeated cross-sectional data across four academic years. When explaining educational attainment, Cassidy (2012) argues that individual variations including age and gender must be considered. Thus, as control variables, we include gender, age and nationality that have been frequently identified as influencing factors in the literature (e.g., Agasisti & Cordero, 2017; Cordero & Gil-Izquierdo, 2018) and that are available in our data. Accordingly, we estimate Equation 1:

Where
For nationality, we divide students into two groups: Chinese and non-Chinese. According to data from the Higher Education Statistics Agency (HESA, 2021), there were 556,625 international students enrolled in UK higher education institutions in 2019–20, of which 73% were non–EU citizens. China continues to be the main source of enrollments from outside the EU, accounting for 35% of all non-EU students in the UK. As Chinese students constitute between 67% and 92% of our sample, it is representative of the current demographic population of students in UK university classrooms. Subsequently, we divide students into Chinese and non-Chinese, which also creates a more balanced statistical sample compared to British and non-British.
Results
Descriptive Statistics of Student Performance (SCTS vs. TCTS)
In Table 5, we present descriptive statistics of SCTS on students’ performance in the long run, that is, S2. Should SCTS be more effective, we expect the TG to outperform the CG in all aspects, including the average unit grade. We also expect the TG’s variance to be smaller if SCTS successfully improves student performance as it theoretically should narrow the distribution of students’ grades around the mean. Altogether, the results show that although TG students’ S2 grades were more dispersed than the CG’s S2 grades in the first year, the difference in variance between the two groups reversed in subsequent years, substantiating SCTS’ effectiveness at narrowing the distribution of grades. Table 5 additionally reveals that the absolute value of the skewness of S2 grades in the TG is consistently lower than the skewness of the CG’s, suggesting that S2 grades in the TG are more symmetric and deviate less from a normal distribution. In the TG, the kurtosis of S2 grades is closer to a normal distribution (with a kurtosis of 3) across all years except 2020, whereas the reverse is true for the CG where the kurtosis ranged between 3.8 and 11.5 over the sample time frame. In 2020, the S2 Econometrics II exam was unexpectedly overhauled due to the COVID-19 pandemic. The fatter tails in the distribution of the CG’s S2 grades therefore indicate a greater prevalence of outliers relative to the TG (Kim, 2013).
S2 Performance Statistics for Econometrics II.

Note. S2 grades are released in June (Jun) every academic year and range from 0 to 100. Mean = overall average grades; SD = standard deviation; Min = minimum; Max = maximum; Obs. = observations.
In Figures B1 and B2 of the online Supplemental material, we also plot histograms for S2 grades for both the TG and CG respectively. Relative to the CG, the distribution of S2 grades in the TG is markedly more centered around the mean, consistent with the kurtosis measures in Table 5. The histogram for CG’s S2 grades also reveals more outliers compared to the TG, indicating that the traditional TCTS generates a wider range of grades relative to the SCTS. Altogether, the histograms support the statistics presented in Table 5 as they show less variance in students’ performance in the TG compared to the CG. A t-test, assuming unequal variances between groups, was conducted to compare the two means. Results of this t-test are not included here for brevity; however, they are available upon request. The overall mean of the S2 grade for the treatment group (66.54) exceeds that of the control group (64.54).
Empirical Effect of SCTS on Student Performance
Table 6 below presents the empirical results from estimating Equation 1. Column (I) includes no controls or academic year fixed effects (FE), column (II) adds all covariates but no year FE, and column (III) includes all controls and academic year FE. Consequently, column (III) is our preferred specification as it accounts for students’ socio-demographic characteristics and for latent time shocks that also impact students’ academic performance. Altogether, the findings indicate that SCTS had a positive impact on students’ econometrics grades. In particular, the coefficients are statistically significant at the 5% level across all specifications and the coefficient in our benchmark specification in column (III) suggests that a student who was exposed to SCTS in S1 was likely to get approximately 1.9 points more on the final exam in S2 compared to students in the control group. Compared to the mean dependent variable coefficient, this corresponds to about a 3% (1.871/66.08) increase in exam scores. A comparison of the coefficients across all specifications ((I) to (III)) indicates that regardless of whether covariates or academic year FE were added, the coefficients’ magnitude and sign do not greatly vary, indicating that the results are not likely to be spurious.
Effect of SCTS on Student Performance.

Note. Robust standard errors (“HC1” as in Hinkley, 1977) are reported in parentheses. Specification (I) includes no controls and no academic year FE, specification (II) includes controls such as gender, age, age squared, and a dummy indicating if the student was Chinese or not, and no academic year FE, and lastly column (III) progressively includes academic year FE in addition to the controls in specification (II). The dependent variable in all regressions is the S2 econometrics grade which ranges from 0 to 100. ***p < .01. **p < −.05. * p < .1.
Heterogeneity Analysis
Academic Strength
In this subsection, we investigate whether the effect of SCTS on S2 grades is heterogeneous based on students’ academic strength, proxied by their S2 econometrics grade. This exercise should detect whether there is a statistically significant difference in the effect of SCTS on S2 grades between academically weaker and stronger students. We conduct simultaneous quantile regressions by applying the following Equation 2 on three quantiles of S2 grades: 25th, 50th, and 75th.

Where
Effect of SCTS on Student Performance Disaggregated by 25th, 50th, and 75th percentiles.

Note. Bootstrapped standard errors (1,000 replications) are reported in parentheses. All three specifications ((I)–(III) include all controls and academic year FE. Specification (I) reflects students in the 25th percentile, specification (II) those in the 50th percentile (median), and specification (III) those in the 75th percentile. The dependent variable in all regressions is the S2 econometrics grade which ranges from 0 to 100. ***p < −.01. **p < .05. *p < .1.
Age, Gender and Nationality
In this section, we assess whether the impact of SCTS on S2 grades is heterogeneous across students’ gender, age, and nationality (i.e., Chinese or non-Chinese). Column titles in Table 8 specify which covariate has been interacted with the SCTS indicator variable. The findings in Table 8 present evidence that women benefited from SCTS more than men. Specifically, the interaction term between the SCTS and the female variable is statistically significant at the 1% level in all specifications and indicates that female students exposed to SCTS scored about 5.5 points higher on the final exam in S2 compared to their male peers. The coefficient on this interaction term equivalently shows that females with SCTS significantly outperformed females not exposed to SCTS. Males’ S2 grades do not seem to be significantly affected by SCTS. In contrast, we do not find any effects of SCTS on S2 grades along the age and nationality dimensions. The coefficients for these socio-demographic characteristics interacted with SCTS are statistically insignificant in all specifications. Considering that there is little variation in age among students from both the TG and CG however, the insignificant interaction term between SCTS and age is statistically plausible. Moreover, Chinese students do not appear to benefit disproportionately more from SCTS than their non-Chinese peers.
Heterogeneity Analysis Through Interaction Terms.

Note. Robust standard errors are reported in parentheses. Specification (I) shows the interaction of SCTS with the female dummy variable, specification (II shows the interaction of SCTS with the age variable, column (III) shows the interaction of SCTS with the Chinese student dummy variable, and lastly column (IV) includes interactions with all controls. The dependent variable in all regressions is the S2 econometrics grade which ranges from a scale of 0–100. ***p < .01. **p < .05.*p < .1.
Robustness Checks
S2 grades in June 2020 were impacted by COVID-19 as the exam was not held in-person, but online. The structure of the exam was therefore overhauled and shifted from problem-solving centered to essay based. Consequently, we conduct a robustness check by executing our preferred specification (III) in Equation 1 and omit the year 2020 from the analysis. The results in Table A3 of the online Supplemental Material corroborate the findings from Table 7. Particularly, the coefficient in the benchmark regression in column (III) is positive and statistically significant at the 5% level and indicates that a student who took a SCTS class scored about 2.4 points higher on the final exam compared to a student who took a TCTS class. Albeit the coefficient is about 0.5 points higher than the main coefficient in Table 6 with the omission of the 2019/2020 academic year due to COVID-19, the inference that SCTS significantly improved student performance remains the same.
In addition, Table A4 of the online Supplemental Material provides qualitative evidence that SCTS was well received by students based on their end of the semester feedback with “teaching effectiveness” and “supporting class material” both receiving high scores. Lastly, despite the accurate representation of Chinese students across US and UK universities, there may still be concerns that the positive impact of SCTS was driven by this nationality group. Accordingly, we omit the “Chinese” variable from regressions and observe qualitatively similar inferences that SCTS remains effective in improving student performance (see Table A5 column (III) of the online appendix). Moreover, the interaction of SCTS with the “Chinese” variable is not statistically significant, providing support for the fact that Chinese students are neither driving the main results nor benefiting more from SCTS.
Discussion
Taken together, the results provide robust support in favor of SCTS for better long-term academic performance outcomes in technical social-sciences like econometrics. Students in the treatment group exposed to SCTS in S1 experienced an increase in S2 grades by about 1.9 points (3%) compared to their counterparts exposed to TCTS. This is consistent with our hypothesis and previous literature suggesting that SCTS has persistent benefits on student performance. The final grades consisted of 70% final exam and 30% coursework throughout the semester, and since we do not have disaggregated information on grades from the two separate components, it is challenging to understand whether these results were driven by an accumulated effect (i.e., due to coursework completed over the semester) or a lagged effect (i.e., a one-time final exam at the end of the semester). Nonetheless, we can conclude that SCTS rather than TCTS is more useful for long-term student performance, given that S2 grades were overall higher for those in the SCTS class than those in TCTS. This finding carries important implications for the teaching of technical social-sciences, not just limited to econometrics, but also public policy courses that require causal evaluation of programs and laws. First, as grades are proxies for how well students have understood the course content, better grades in the long run also indicate better understanding of course material and hence, application to real-world issues. Second, as some courses are divided into sub-parts and are continuations of each other, such as Econometrics I and II, having a good grasp of the content in the first part of the course due to SCTS helps to cement understanding for future courses. Third, grades are also proxies for hiring. Therefore, higher achievement in such technical social-science courses can improve students’ chances of finding employment in quantitative sectors that are higher paying and also currently facing labor shortages.
The results reveal disproportionate benefits of SCTS among academically weaker and stronger students, with SCTS students in the 75th percentile scoring on average 2 points higher than those in the lower percentile groups. We further observe that at the 25th and 50th percentiles, even after controlling for SCTS, Chinese students scored approximately 5 and 3 marks higher their non-Chinese peers respectively. We do not however, find any effects for Chinese students in the 75th percentile. This finding provides further support for the fact that SCTS disproportionately benefits academically stronger students as the effect of nationality on grades disappears once SCTS is controlled for in the group of higher performing Chinese students. Altogether, these findings are consistent with our hypothesis that students’ previous experiences may alter the effectiveness of SCTS.
Lastly, when interacting the SCTS variable with gender, we provide evidence that SCTS benefits female students more than male students, where females exposed to SCTS score about 5.5 points higher than males. These findings lend support to Laursen et al.’s (2014) study suggesting that SCTS may offer several features that are particularly effective for women. In addition, these results are encouraging from an education and skills gap perspective in a sense where higher scores in quantitative subjects like econometrics increase the chances of women partaking in more technical and higher paid jobs that require these skills. Lastly, the results of this paper offer empirical proof of SCTS’s nondiscriminatory effects on students’ nationality as we do not observe differences in the effect of SCTS between Chinese and non-Chinese students. Therefore, the higher grades observed in our estimations are likely driven by SCTS rather than student characteristics such as nationality for instance.
Conclusion
Over time, more and more educational institutions have shifted from teacher-centered teaching strategies (TCTS) to student-centered teaching strategies (SCTS) that allow students to participate more actively in their learning. In this paper, we demonstrate that SCTS improves students’ long run performance in econometrics by about 3% when compared to the mean grade. This finding suggests that SCTS plays a major role in filling labor market gaps in more technical and quantitative positions. Furthermore, because academic grades have been found to be an important determinant of hiring and earnings (Alili & Mehmetaj, 2021; Hansen et al., 2023), SCTS can improve students’ overall chances of employment after graduation, especially in more quantitative job roles. The findings also reveal heterogeneous effects along the gender and academic strength dimensions, whereby SCTS appears to benefit female students more than males, and academically stronger students more than academically weaker ones. This evidence produces mixed inferences where on the one hand, as male students have historically performed better in more technical fields (Ashlock et al., 2022; Miles & Foggett, 2016; Oluwatelure, 2015), the fact that SCTS can potentially mitigate the performance gap, and hence the wage gap between males and females in STEM-related fields is encouraging. On the other hand, the findings highlight disproportionate benefits of SCTS between genders. Therefore, it is important to identify and implement the facets of SCTS that appeal to both genders equally.
The results also suggest that SCTS drives a greater wedge in educational achievement between students who are academically stronger, and those who are weaker. Consequently, educators should consider using SCTS in tandem with other teaching methods to ensure that weaker students receive sufficient help to also catch up with their better performing peers. For instance, teachers could target students who perform more poorly in mid-term assessments during the semester by providing more supplementary classes for this group of students. By doing so, SCTS can reach its full potential by helping both weaker and stronger students. Overall, the results from the analysis in this paper can potentially be generalized to university courses in the US and the UK, that have similar student demographics due to the representativeness of our sample, for instance, a large share of Chinese students (HESA, 2021). Moreover, given that the content taught in econometrics courses is more or less consistent across these countries, it is likely that similar conclusions can be drawn. Notwithstanding, more detailed data and qualitative surveys are required to uncover the causal mechanisms that underlie the association between the two variables.
Since students’ end-of-semester feedback on the usefulness of SCTS is generally difficult to acquire due to confidentiality and privacy reasons, this paper provides a more descriptive overview of the relationship between SCTS and educational attainment. Moving forward, future research should therefore attempt to collect information on which components of SCTS, for example, online quizzes, or labs and tutorials are responsible for the increase in students’ grades. Additionally, because of the lack of a valid counterfactual, we cannot observe the same students’ grades for the same unit before and after implementing SCTS. This study nonetheless hopes to serve as a catalyst in promoting more research on the differences in long term student outcomes between TCTS and SCTS, especially in more technical social sciences like econometrics. Based on our results, we show that SCTS is important for laying the foundation for better student performance and hence labor market opportunities in the long run. It is therefore worthwhile to implement SCTS in technical social-science courses that span over multiple semesters, where final student outcomes are largely contingent upon content knowledge from previous semesters.
Supplemental Material
sj-docx-1-sgo-10.1177_21582440241240844 – Supplemental material for The Impact of Student-Centered Teaching Strategies on Educational Attainment in Econometrics: Evidence From the UK
Supplemental material, sj-docx-1-sgo-10.1177_21582440241240844 for The Impact of Student-Centered Teaching Strategies on Educational Attainment in Econometrics: Evidence From the UK by Imran Hussain Shah, Audrey Au Yong Lyn, Guillaume Maxence Augustin Morlet and Ladina Rageth in SAGE Open
Footnotes
Acknowledgements
We especially thank the University of Bath, Department of Economics, UK, for providing the data on student performance in Econometrics and additional information about the courses offered in Econometrics. We are also deeply appreciative of the University of Bath for covering the cost of the open acess article processing charge from the UKRI fund, facilitating the dissemination of our research findings. We would also like to thank our colleagues at the Chair of Education Systems (CES) at ETH Zurich, and the University of Bath for their valuable feedback and comments. All errors are our own.
Declaration of Conflicting Interests
The author(s) declared no potential conflicts of interest with respect to the research, authorship, and/or publication of this article.
Funding
The author(s) received no financial support for the research, authorship, and/or publication of this article.
Data Availability Statement
The data for the study are extracted from the Board of Examination reports published by the Department of Economics, University of Bath. Some parts of the dataset containing students’ grades is confidential due to privacy and data protection regulations. However, the authors confirm that the data supporting the findings of this study are openly available in Mendeley: ![]() (doi: 10.17632/dgygpns2hs.1).
(doi: 10.17632/dgygpns2hs.1).
Supplemental Material
Supplemental material for this article is available online.
References
Supplementary Material
Please find the following supplemental material available below.
For Open Access articles published under a Creative Commons License, all supplemental material carries the same license as the article it is associated with.
For non-Open Access articles published, all supplemental material carries a non-exclusive license, and permission requests for re-use of supplemental material or any part of supplemental material shall be sent directly to the copyright owner as specified in the copyright notice associated with the article.