
Abstract
Technological innovation (TI) is conducive to economic growth, but whether it promotes the development of renewable energy remains controversial. This study aims to analyze the interrelation between TI and renewable energy investment (REI) to see how to promote the coordinated development of TI and REI. By using the bootstrap rolling-window subsample Granger causality test and the sample from January 2010 to July 2022 in China, we find that the influence of a country’s overall TI level on REI is twofold. On the one hand, the increase in a country’s overall TI level has a positive influence on REI by reducing the renewable energy risk. On the other hand, TI can reduce REI by bringing more demand for relatively stable non-renewable energy. Conversely, REI has both positive and negative influences on a country’s overall TI level. Additional REI promotes renewable energy-related TI, but it may crowd out the investment in other fields and impede TI. Based on these results, policymakers intended to achieve sustainable development should encourage renewable energy TI, which is conducive to reducing the risk of renewable energy. In addition, policymakers should pay attention to REI’s role in crowing out the investment in other fields, and take measures to promote TI of the whole society.
Plain Language Summary
The improvement of a country’s technological innovation (TI) level is conducive to economic growth, but whether it promotes the transition from non-renewable energy (e.g., oil, gas, coal) to renewable energy (e.g., solar, hydropower, wind, biomass, and geothermal energy) remains controversial. By using the data from January 2010 to July 2022 in China, we find that the influence of a country’s overall TI level on renewable energy investment (REI) is twofold. On one hand, a country’s overall TI level promotes REI by reducing REI risk. On the other hand, TI reduces REI by benefiting non-renewable energy. Conversely, REI promotes TI by providing more funds for renewable energy-related TI, but REI may crowd out the funds for the research in other fields and therefore impede a country’s overall TI. Based on these results, policymakers intended to develop renewable energy should encourage renewable energy-related TI to reduce the risk of REI. In addition, policymakers should pay attention to REI’s role in crowing out the investment in other fields, and take measures to promote TI of the whole society.
Introduction
The main objective of this paper is to investigate the interrelationships between technological innovation (TI) and renewable energy investment (REI) to see how to coordinate the development of TI and REI in the context of carbon neutrality. Renewable energy (e.g., solar, hydropower, wind, biomass, and geothermal energy) is becoming quite attractive because it helps to achieve carbon neutrality (Ibrahim & Ajide, 2021) and provides new sources of economic growth (Lehr et al., 2008; Zahoor et al., 2022). Despite the great potential, it requires enormous investment to convert natural resources into usable energy (e.g., electricity). Hence, scaled-up REI is critical for the development of the renewable energy industry, while achieving climate and development targets.
The Relationship Between TI and REI Worldwide
TI in the renewable energy industry facilitates REI, but whether TI in the whole society promotes REI remains controversial (A. Khan et al., 2021; Kitzing et al., 2020). On the one hand, TI related to renewable energy facilitates REI. For example, renewable energy production may be intermittent because of the changing weather, which increases the risk of REI. The TI in renewable energy storage can reduce the risk and attract additional REI. On the other hand, since renewable energy and non-renewable energy are substitutes (M. S. Alam et al., 2022), TI related to non-renewable energy may attract investment in non-renewable industry rather than REI, thereby inhibiting REI. For example, the development of clean coal technology makes it attractive to invest in coal-powered electricity production, which may crowd out REI. Moreover, TIs in various industries (e.g., manufacturing industry, construction industry, etc.) help to expand production and increase energy demand (Gunderson & Yun, 2017), which may change the proportion of REI in total energy investment.
As a key factor affecting REI, TI’s impacts on REI in different regions may not be the same (Bamati & Raoofi, 2020; K. Khan et al., 2022). According to Renewables 2022 Global Status Report, with the development of TI related to renewable energy, global REI has reached US$366 billion, and investment in energy storage reached a new record of US$7.9 billion. Nevertheless, not all countries and periods have seen an increase in REI. For example, solar investment in Japan and India declined by 54% and 29% in 2020, respectively. The off-grid REI in Southeast Asia was USD 137 million over 2018 to 2019, while it plummeted to USD 3 million during 2020 to 2021 (IRENA and CPI, 2023). Therefore, the impact of TI on REI varies in different countries and stages. It is essential to investigate the time-varying relationship between TI and REI by using a suitable sample, which has important inspirations for policymakers to achieve sustainable development.
The TI and REI in China
China is a good sample to investigate the relationship between TI and REI. Recent years have witnessed the rapid growth of REI in China. According to RGSR2022, the country takes up the largest share of global REI, at 37%, whose generation capacity of hydropower, wind power, biomass power, and photovoltaic power all rank first in the world. Figure 1 shows the energy investment in China in both 2019 and 2022. It can be observed that clean energy investment has the largest amount and fastest growth among all energy investments.

Energy investment in China, 2019 and 2022.
The rapid development of the renewable energy industry is largely attributed to TI supporting policies from the government. China has implemented the national innovation-driven development strategy since 2012 at the 18th National Congress of the Communist Party of China (CPC). This strategy seeks to enhance the contribution of TI to economic growth and the upgrade of economic structure. In recent years, confronted by the severe impact of climate change, the government has further emphasized on building a system that nurtures green energy TI (X. Zhao et al., 2022). Specifically, the government has started to integrate digital and artificial intelligence technologies with technologies for clean and efficient energy exploration. The progress of TI reduces the risk of REI and promotes a surge in private capital investment. According to the International Renewable Energy Agency, private investments accounted for almost 75% of the total REI. Thus, we can infer that TI contributes to REI in China.
However, the promoting impact of the national TI level on REI is uncertain because the national innovation-driven development strategy encourages TI in all industries and TIs are not directed toward the renewable energy sector. For example, in addition to encouraging the development of renewable energy, the government also promotes the clean and efficient utilization of fossil fuels through TI. The fossil fuels-related TI will increase the investment of fossil fuels, driving down the proportion of REI in total energy investment. In addition, coal consumption accounts for more than 50% of the total energy consumption in China and coal is relatively cheaper and more stable than renewable energy. The progress of TI in various industries will help to expand production and increase energy demand (Gunderson & Yun, 2017), which may lead to additional investment in coal and crowd out REI. It is noteworthy that the relationship between TI and REI in China may change in different periods because the country is undergoing industrial upgrading. Thus, discussing whether the TI improvement in China promotes or impedes REI has special significance. This paper investigates the time-varying effect of the overall TI level on REI in the context of the national innovation-driven development strategy and provides important policy implications for China’s energy transition.
Contribution of the Study
The originality of this paper is as follows. Firstly, this paper extends the research of renewable energy and innovation from the perspective of renewable energy investment. Investigating today’s investment in renewable energy is conducive to forecasting tomorrow’s capacities. Existing studies focus on the installed capacity and consumption of renewable energy, rather than addressing investment (Solarin et al., 2022; Vural 2021). This paper fills this gap by investigating the influence of the national TI level on REI. Secondly, this paper contributes to the current investigations by applying the bootstrap sub-sample rolling-window causality test, which examines the dynamic interrelationship between TI and REI. Existing studies mainly use the full-sample causality test or panel data regression, neglecting the parameters’ structural breaks, which results in an unreliable result (Balcilar & Ozdemir, 2013). To fill this gap, we use the bootstrap rolling-window sub-sample Granger causality test to obtain a more precise result (Balcilar et al., 2010). This method has two advantages. First, the time-varying causal interrelationship between TI and REI can be examined. Second, the impact of structural change on stability across different sub-samples can be observed (Su et al., 2022; Yuan et al., 2022).
The method has three steps as follows. The first step is to construct the Vector Autoregression (VAR) Model and conduct the standard Granger causality test. We apply the residual-based bootstrap (RB) modified-Likelihood Ratio (LR) statistics (Shukur & Mantalos, 2000) to explore the causal interrelationship between TI and REI. The second step is to test the stability of the parameters to see whether structural changes exist at unknown moments. If results support the existence of structural changes, then there is the third step to conduct the rolling-window subsample causality test. This test divides the full sample from January 2010 to July 2022 into fixed-size subsamples based on the rolling window width, and then the Granger causal interrelationship between TI and REI in each subsample can be investigated. Results show that the impact of TI on REI has structural breaks. On the one hand, the increase in a country’s overall TI level has a positive influence on REI by reducing the renewable energy risk. On the other hand, TI can reduce REI by bringing more demand for relatively stable non-renewable energy. Understanding the relationship between TI and REI provides an important reference for policymakers to achieve sustainable development. This paper also inspires further research on renewable energy investment.
The rest of this paper is organized as follows. Section 2 is the literature review. Section 3 analyzes the interrelationship between TI and REI theoretically using the risk-return model. Section 4 is a detailed introduction to the empirical method. Data is introduced in section 5. Section 6 presents the empirical results. Section 7 discusses the results. Section 8 concludes the paper, and provides policy implications and limitations.
Literature Review
The impact of TI has attracted significant attention in the past few years. TI is usually seen as a crucial factor in affecting economic growth (Mele et al., 2022), environmental quality (Magazzino et al., 2021), and the energy industry (C. C. Lee & Wang, 2022; Miao et al., 2018; Solarin et al., 2022). Popp et al. (2011) use patent accounting to measure TI and verify that renewable energy TI positively impacts renewable energy capacity across 26 countries in the Organisation for Economic Co-operation and Development (OECD). MacGillivray et al. (2014) point out that TI in marine renewable energy has commercial prospects if it helps to reduce cost, implying that TI is conducive to REI. Elia et al. (2021) also maintain that energy TI is conducive to reducing the cost of renewable energy technology. Besides, Irandoust (2016) indicates that TI is helpful to renewable energy’s growth for the four Nordic countries. In South America, Vural (2021) suggest that TI promotes renewable energy production per capita. Solarin et al. (2022) also show that TI in renewable energy facilitates the production of renewable energy in the BRICS (Brazil, Russia, India, China, and South Africa) countries. In addition, Yüksel et al. (2020) demonstrate that TI effectively increases renewable energy usage. J. Li et al. (2020) also show that green innovation is essential in explaining the consumption of renewable energy in the OECD. Likewise, Sharma et al. (2021) find that TI facilitates the consumption of renewable energy in the BRICS countries.
Unlike most research that renewable energy TI promotes the renewable energy industry, Bamati and Raoofi (2020) demonstrate that technology-intensive export promotes the production of renewable energy in developed economies, but it is insignificant in affecting the consumption of renewable energy in developing economies. M. M. Alam and Murad (2020) reveal that while TI is conducive to using renewable energy across OECD countries in the long term, their short-run relationships are mixed. In addition, A. Khan et al. (2021) show that TI has a negative influence on renewable energy in 69 countries of the “Belt and Road Initiative.” Moreover, K. Khan et al. (2022) demonstrate that the impact of TI on Germany’s renewable energy is mixed.
In turn, some researchers discuss renewable energy’s impact on TI. Hille et al. (2020) find that supporting policies on renewable energy spurs solar- and wind-power-related TI. D. Zhang et al. (2022) demonstrate that environmental regulations increase renewable energy TI by affecting REI. However, S. Li and Shao (2021) reveal that the share of renewable energy power generation impedes TI for the OECD countries. In addition, some studies are focusing on the impact of renewable energy and technology on the climate, concluding that renewable energy and technology help to mitigate climate change and improve environmental quality (Hassan, Khan et al., 2022; Z. Khan et al., 2020; Y. Khan, Hassan, Kirikkaleli et al., 2022; Y. Khan, Hassan, Tufail et al., 2022; Y. Khan et al., 2022a, 2022b, 2023; Liu et al., 2023; Shao et al., 2021; Suki et al., 2022; Wang et al., 2020; X. Zhang et al., 2023), which will ultimately benefit the economy (Y. Khan et al., 2019; Y. Khan & Bin, 2020). Likewise, Ibrahim and Ajide (2021) suggest that carbon emissions can be reduced by developing renewable energy for G7 countries including Canada, Germany, France, Italy, Japan, the USA, and the UK. Y. Khan and Liu (2022) find that renewable energy exerts a positive influence on environmental quality. Furthermore, Hassan, Song et al. (2022) prove that carbon emissions are also related to environmental policies.
More recent studies have examined TI’s impact on renewable energy in China and drawn conflicting conclusions. P. Guo et al. (2016) suggest that TI input, policy, ability, and organization harm the usage of non-renewable energy, which benefits the transition of energy structure. S. Zheng et al. (2021) find that the TI progress in a province leads to a rise in renewable energy production in its neighboring provinces. C. C. Lee and Wang (2022) further point out that TI is an important way to ensure energy security. In turn, L. Zhang et al. (2022) find that the growth of renewable energy positively influences TI. He et al. (2019) reveal that REI has a mixed impact on the green economy development index. Moreover, Kuang et al. (2022) point out that green TI and renewable energy cut CO2 in the long term. J. Guo et al. (2021) also confirm that TI and energy investment reduce emissions. H. Zheng et al. (2021) further find that renewable energy can reduce carbon emission intensity.
Most previous researchers investigate TI’s impact on the production and consumption of renewable energy (A. Khan et al., 2021; Sharma et al., 2021; Solarin et al., 2022), neglecting the impact of TI on REI. In addition, existing studies mainly focus on the impact of green TI (S. Li & Shao, 2021; Ibrahim & Ajide, 2021), and there is still no conclusive answer to whether a country’s overall TI promotes REI. Moreover, although many studies (e.g., Ibrahim & Ajide, 2021; Kuang et al., 2022; Suki et al., 2022) show that TI and REI have a particular impact on the environment, they fail to discuss the two-way relationship between TI and REI. Furthermore, related research does not use time-varying parameters in the models, neglecting the structural changes in the full samples, which may result in inaccurate results. Considering that China’s economic transformation and energy structure may influence the relationship between TI and REI, we apply the bootstrap subsample rolling-window causality test (Balcilar et al., 2010) to explore the causal relationship at different periods. This study not only answers the question of whether China’s innovation-driven development strategies promote REI but also has implications for investors to achieve wealth maximization in the context of carbon neutralization.
Theoretical Analysis of the Relationship Between TI and REI
We develop a theoretical framework to summarize the two-way relationship between TI and REI. Figure 2 displays the impact of TI on REI while Figure 3 shows the impact of REI on TI. As shown in Figure 2, the overall TI level of a country impacts REI through three channels—the progress of TI in renewable energy, non-renewable energy, and other industries. The TI in various industries will change the risk and return of REI and non-renewable energy investment, thereby influencing the share of REI.

The impact mechanism of a country’s overall TI level on REI.

The impact mechanism of REI on a country’s overall TI level.
Since all three transmission channels mentioned above involve risks and returns, we use the

s.t.
The resulting first order conditions of the Lagrange function can be expressed as:

Equation 1 indicates the relationship between w1 and

As ρ < 1,
Secondly, we can get that
Thirdly, we apply the risk-return model to explain the transmission channel (3) in Figure 2. TI in various industries (e.g., manufacturing industry, construction industry, information technology industry, etc.) is conducive to the expansion of production and economic growth, which increases energy demand (Gunderson & Yun, 2017). Confronted with increasing energy demand, investors have a new maximization problem and need to reallocate assets between renewables and non-renewables to maximize returns under a given risk. Hence, the changes in w1 and w2 are uncertain. In general, TI’s impact on REI is inconclusive.
Conversely, REI has a mixed influence on the overall level of TI, which is shown in Figure 3. REI influences TI through two channels—one channel will bring additional funds for research and development (R&D) in the renewable energy industry, while the other channel will crowd out the investment and R&D funds in the non-renewable energy industry.
On the one hand, the increase in REI provides additional funds for R&D in the renewable energy industry, improving a country’s overall TI level (Xu et al., 2021). For example, the increase in wind power investment can promote TI of equipment manufacturing in wind power generation, which will further promote the research and TI in ocean wind measurement, ocean hydrology, deep-sea operations, etc. The progress of wind power can also bring additional opportunities for economic development, improving the overall TI level. On the other hand, as renewable and non-renewable energy are substitutes (M. S. Alam et al., 2022), the increase in REI may crowd out the investment in non-renewable energy, which reduces R&D funds for the non-renewable energy industry and inhibits TI related to non-renewable energy. Hence, the impact of REI on the overall TI level is ambiguous.
Methodology
Table 1 summarizes the main methods in related studies, which include full-sample Granger causality, logical decision tree framework, panel data regression, nonlinear cointegrating autoregressive distributed lag model, and so on. Although these methods examine TI and renewable energy from different perspectives, they fail to account for major structural shocks in the samples and cannot discuss the time-varying relationship between TI and REI.
Main Methods Used in Related Literature.

Source. Our elaborations.
To fill this gap, we apply the bootstrap rolling-window subsample Granger causality test (Q. Zhao et al., 2023). This method has two advantages. First, the time-varying causal interrelationship between TI and REI can be examined by using the rolling-window method. Second, it is easy to observe the impact of structural change on stability across different sub-samples (Su et al., 2022; Yuan et al., 2022). The method has three steps, which are shown as follows.
Conducting the Standard Granger Causality Test Based on the VAR Model
In the existing literature, TI and the renewable energy industry are interactive and they are both related to economic growth (S. Li & Shao, 2021; Popp et al., 2011; Solarin et al., 2022). The increase in economic growth is conducive to the wealth accumulation of the country, which provides more funds for REI and TI. Besides, economic growth usually leads to higher energy consumption (Marinas et al., 2018; Omri et al., 2015), which influences investors’ decisions on REI. Figure 4 illustrates the relationship among TI, REI and economic growth. We use the industrial added value (IAV) to represent economic growth. IAV is usually considered a good indicator of economic growth in China (K. Li & Yuan, 2021) because the industry is the main sector that promotes China’s economic development.

Relationship among TI, REI and IAV.
Based on the literature and theoretical analysis, this paper formulates a VAR model illustrated in Equation 2.

where
The causality test is conducted based on Equation 2. When the null hypothesis that
When conducting the standard Granger causality test, we usually use statistics like Likelihood Ratio (LR) or Lagrange multiplier, which are assumed to follow the standard asymptotic distribution (Sun et al., 2021). However, such an assumption may be invalid because structural changes may exist in the time series (Sims et al., 1990; Toda & Phillips, 1993, 1994), leading to inaccurate estimates. To improve the estimation performance, Shukur and Mantalos (1997) suggest using the critical values of residual-based bootstrap (RB) estimation. Also, Shukur and Mantalos (2000) indicate that RB-based corrected LR- statistics have an advantage in increasing the Granger test’s robustness. Hence, we apply RB-based modified-LR statistics to investigate the causal interrelationship between TI and REI. When the RB-based modified-LR-statistics and related p-values indicate that
Parameter Stability Test
It is assumed in the standard full-sample causal test that the parameters in the VAR model are unchanged over time, and thus we can get only one causality in all periods (Su et al., 2021). However, the relationship between dependent and independent variables may undergo structural changes, which may be brought about by demand or supply shocks in the economy, or may be the result of institutional shifts. In this situation, it is highly possible that the parameters are not constant, thus the result of the full-sample Granger causality test is unreliable (Balcilar & Ozdemir, 2013). Therefore, testing the parameters’ stability is essential. We apply the Sup-F, Mean-F, and Exp-F tests proposed by Andrews (1993) and Andrews and Ploberger (1994) to examine the parameters’ stability. Besides, this paper uses the Lc test proposed by Nyblom (1989) and Hansen (1992) to check the long-run parameters’ stability. These tests can help to check the existence of structural changes occurring at unknown moments.
Rolling-Window Subsample Causality Test
To deal with structural mutations, previous studies usually use dummy variables based on subjective experience, which still leads to some biases and results are sensitive to outliers (A. Khan et al., 2021; Popp et al., 2011). This study applies the bootstrap sub-sample rolling-window Granger causality test, which enables us to observe the difference in casualty caused by structural changes among different subsamples and reduce biases (Qin et al., 2021). To conduct the subsample test, the full sample will be divided into fixed-size subsamples based on the rolling window width. Suppose the rolling window width is R, then each subsample includes R observations. In a full sample including T observations, we can obtain T−R+1 subsamples as follows: τ−R+1, τ−R+2, …, τ, where τ = R, R+ 1, …T.
We then investigate the Granger causality between TI and REI in each subsample based on the RB-based modified LR statistics. By calculating the p-value of the LR statistic, we can get the significance of the causality. The confidence interval is 90% (Balcilar et al., 2010). In addition, the influence of TI on REI can be obtained based on
In this way, we can examine exactly whether TI and REI have a significant positive or negative Granger interrelationship in rolling subsamples. This method captures the dynamic characteristics of the relationship and can avoid the inaccuracy of the results that outliers bring (Arslanturk et al., 2011; Balcilar et al., 2010; Ramzan et al., 2023).
Data
This paper chooses monthly data from January 2010 to July 2022 because REI was first released in January 2010. We use the proportion of renewable energy power investment to total energy power investment (investment in renewable energy power and thermal power) to measure REI (Johnstone et al., 2010), which provides insights into the trends of energy structure in China. A higher REI indicates that investors allocate more funds to renewable energy infrastructure. Renewable resources are valuable when they are converted into usable energy through technology. According to the United Nations Environment Programme, most renewable resources are converted to electricity. By the end of 2021, almost all countries had formulated supporting policies on renewable energy, most of which had been concentrated in the power sector, while there had been fewer supportive policies for renewable energy in construction, transportation, and other fields (RGSR2022).
In addition, this paper uses the number of granted patents each month to measure TI, which is widely considered a standardized and objective indicator of innovation (Aghion et al., 2019; K. Lee & Lee, 2013; Paunov, 2016; Su et al., 2022). China has adopted a national innovation-driven development strategy in recent years, which promotes the rapid growth of granted patents. For example, in 2021, the number of domestic patent authorizations reached 4.467 million, with an increase of 26.9% over the previous year. TI is viewed not only as a primary driver of economic growth but also as a key method to reduce the cost and risk of investment. With the granted patents increasing dramatically (Fang et al., 2018), the REI increases in most periods. Hence, we can infer that TI and REI may be correlated, with TI seemingly being a push for REI.
Moreover, the relationship between TI and REI is connected to economic growth (Grossman & Krueger, 1991). On the one hand, economic growth increases the wealth of residents, which provides more funds for REI. On the other hand, TI and economic growth enhance each other, which usually leads to higher energy consumption (Omri et al., 2015), thereby influencing REI. Considering that China’s economic growth is mainly driven by industry, we choose IAV as the control variable (Marinas et al., 2018; Popp et al., 2011). The main information on the data is reported in Table 2.
The Definition of Variables.
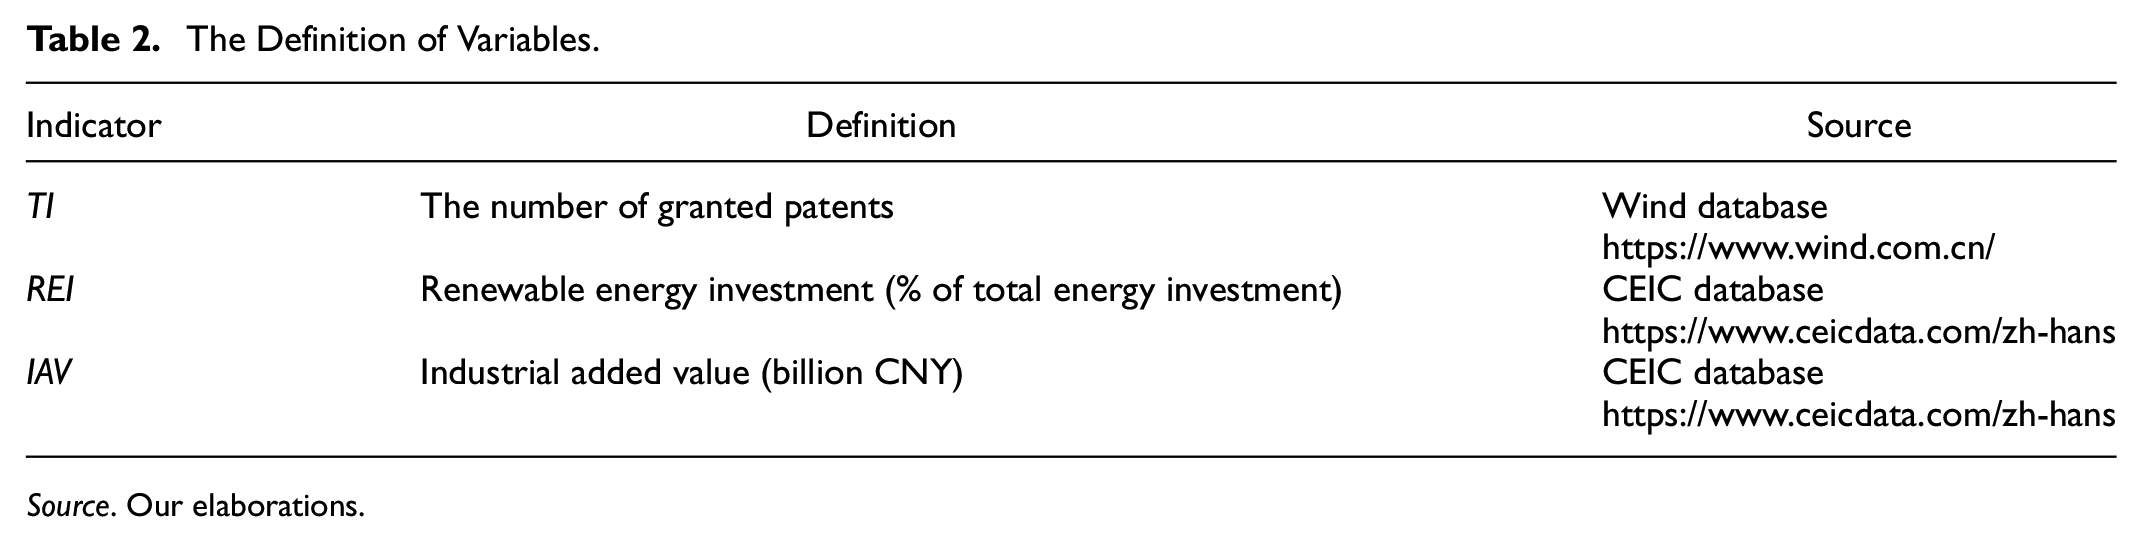
Source. Our elaborations.
Figure 5 presents TI and REI trends. The solid line indicates the changes in TI, while the dashed line describes the changes in REI. It can be observed that TI has an overall rising trend despite fluctuation, and it reaches to peak in April 2022. Besides, the growth rate increased after the 18th National Congress of the Communist Party of China (CPC) in November 2012, when President Xi Jinping emphasized in the congress that TI is the core of overall national development. Compared with TI, the fluctuation of REI is relatively large. Regarding the overall trend, REI values have also increased, indicating that the share of renewable energy investment has risen. In addition, a high TI coincides with a rise in REI in most periods. For example, after the release of the Outline of the National Strategy of Innovation-Driven Development (ONSID) in May 2016, Chinese firms allocated more resources to innovation, causing TI to skyrocket. The figure shows that REI increases in the corresponding period. Likewise, in 2019, there were several reforms to accelerate TI, during which time TI and REI both increased. Therefore, we can infer that TI can promote REI. However, the trends of TI and REI are not always the same. From March 2015 to July 2015, TI continued to rise, but there was a slump in REI during this period, showing that TI may lead to a decrease in the proportion of REI. A similar situation can be observed at the beginning of 2022 when the new version of the Law on Scientific and Technological Progress comes into force. Although TI soared at that time, there was a decline in REI. Moreover, China’s economic growth will affect the interrelationship between TI and REI. Economic growth leads to higher energy usage (Marinas, et al., 2018; Omri et al., 2015), which may change the expected return on renewable and non-renewable energy, thereby influencing investors’REI decisions. To sum up, the relationship between TI and REI changes over time, which may be connected with economic growth.
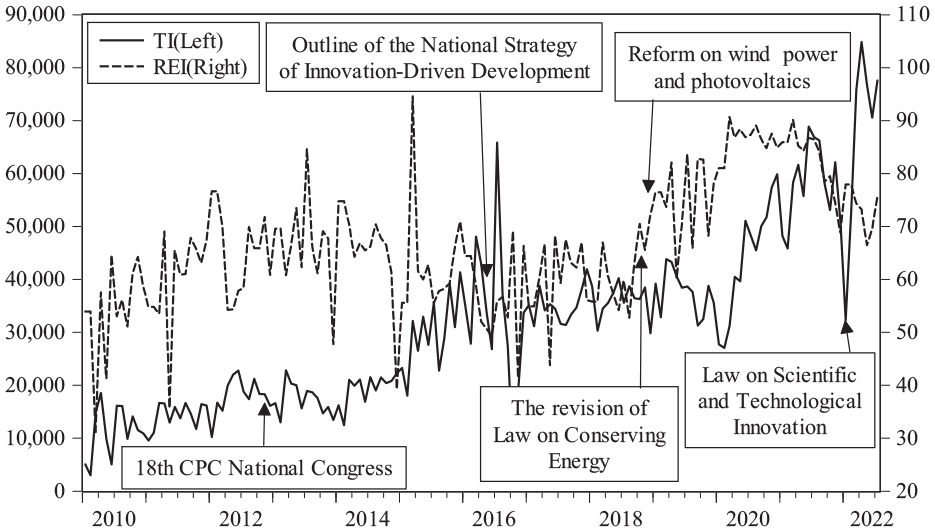
Trends of TI and REI.
Table 3 reports the descriptive statistics of all of the variables. The means of TI indicates that there are 31,326.57 granted patents on average each month. The average value of REI suggests that the investment in renewable energy accounts for 66.721% of total energy investment on average. The average monthly value of LAV is 1995.618 Chinese yuan (CNY). Besides, the maximum REI reaches 94.582%, showing investors are very optimistic about developing renewable energy. In addition, TI, REI and IAV have positive skewness, which means they follow the right-skewed distribution. Moreover, the Jarque–Bera test indicates that TI and IAV follow a nonnormal distribution at the significance of 1% and 10%, respectively. Hence, the estimation of parameters is inaccurate when we apply the standard full-sample Granger causality test. A natural logarithm is applied in the subsequent analysis to avoid heteroskedasticity in the variables.
Descriptive Statistics of the Sequence of TI, REI and IAV.

Source. Our calculations.
Note.*** and * indicates that the statistics are significant at the 1% and 10% level, respectively.
Empirical Results
To begin with, this study performs ADF (Dickey & Fuller, 1981), PP (Phillips & Perron, 1988) and KPSS (Kwiatkowski et al., 1992) unit root tests to ensure the stability of the sequences. It can be observed in Table 4 that TI and REI are non-stationary in their levels, but they are stationary when they are taken the first-order differences.
Unit Root Tests.
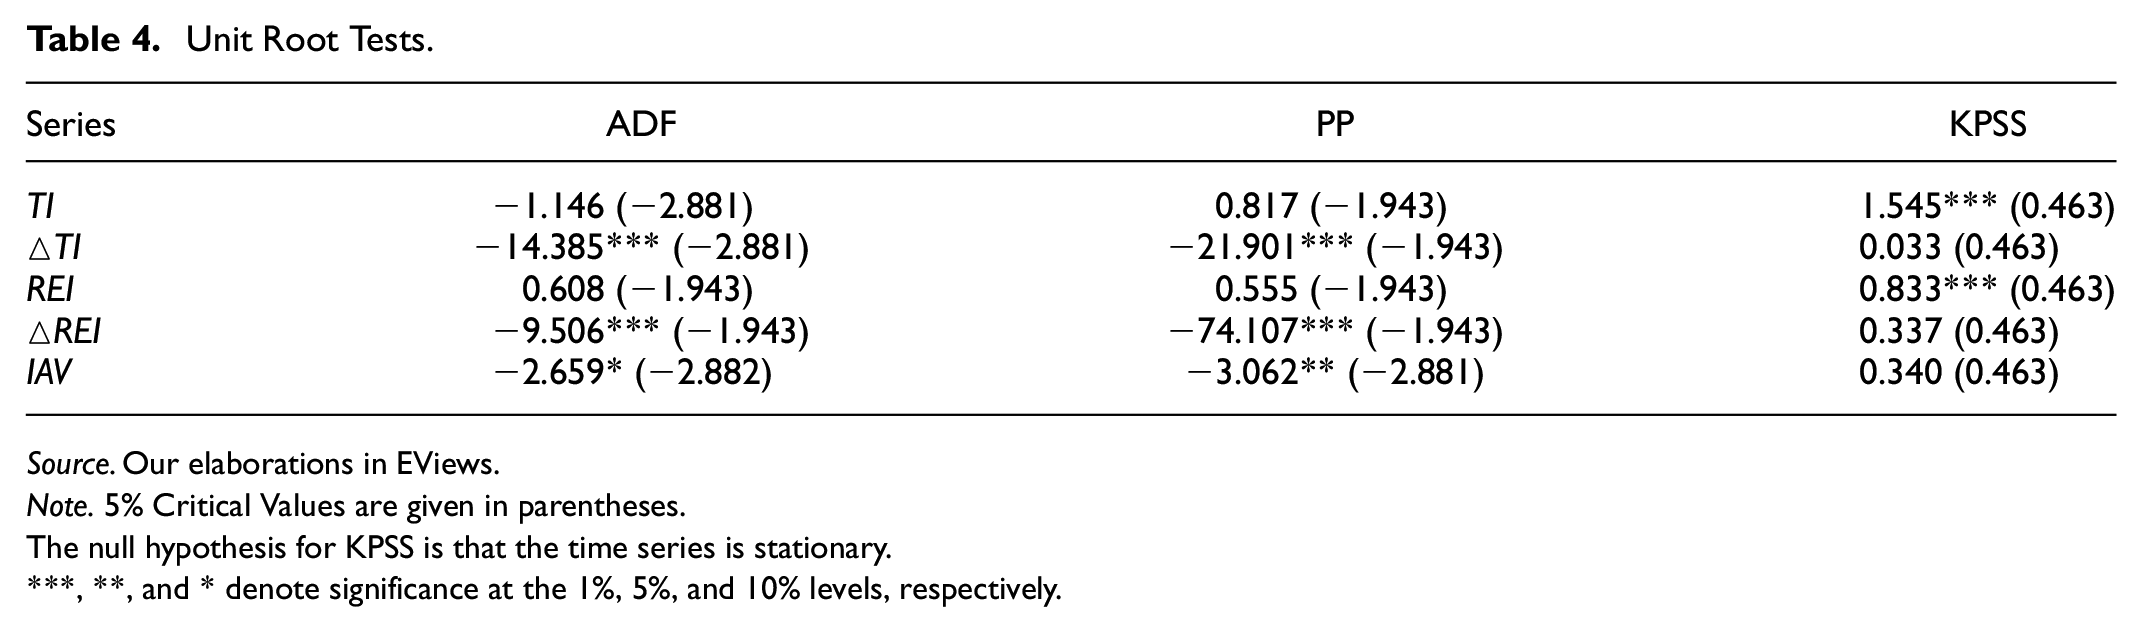
Source. Our elaborations in EViews.
Note. 5% Critical Values are given in parentheses.
The null hypothesis for KPSS is that the time series is stationary.
, **, and * denote significance at the 1%, 5%, and 10% levels, respectively.
We then construct the VAR model as Equation 2. According to AIC, FPE, and HQ, the optimal lag length is 4. Table 5 presents the results of causality in full-sample, showing that TI and REI have no casualty with each other, which is inconsistent with the risk-return model that TI influences REI (P. Guo et al., 2016; Popp et al., 2011).
Full-sample Granger Causality Tests.

Source. Our elaborations in EViews.
Note. The null hypothesis is that no causal relationship exists between the variables. p-Values are calculated using 10,000 bootstrap repetitions.
Considering that when structural changes occur in the parameters, the causality of TI and REI is inaccurate using the full-sample Granger causal test (Zeileis et al., 2005), we perform the stability test using the software R to determine the presence of structural mutations. As mentioned above, this study uses Sup-F, Mean-F, Exp-F, and Lc tests to test the parameters’ stability. Table 6 presents the results.
Parameter Stability Tests.

Source. Our elaborations in R.
Note. We calculate p-values using 10,000 bootstrap repetitions. ** and *** Indicate significance at the 5% and 1% level, respectively. Lc shows the results of the Hansen–Nyblom parameter stability test for all parameters in the VAR jointly.
The results of the Sup-F tests indicate a sudden shift in the TI, REI equation, and VAR system at the 1% level of significance. Besides, the results of Mean-F and Exp-F tests indicate that parameters change gradually over time in the TI, REI, and VAR systems. In addition, the result of the Lc test shows that the null hypothesis can be rejected, implying that parameters in the VAR model do not follow a random walk process. In summary, the results show that the parameters are unstable, and the results of the full sample Granger causality test are inaccurate. To improve the accuracy of the results and observe the structural changes, we use the bootstrap rolling-window sub-sample Granger causality test to examine the time-varying causal relations between TI and REI. As the bias-minimizing window size should not be less than 20 observations (Pesaran & Timmermann, 2005), this paper includes 24 months of observations in the rolling subsample to ensure reliability.
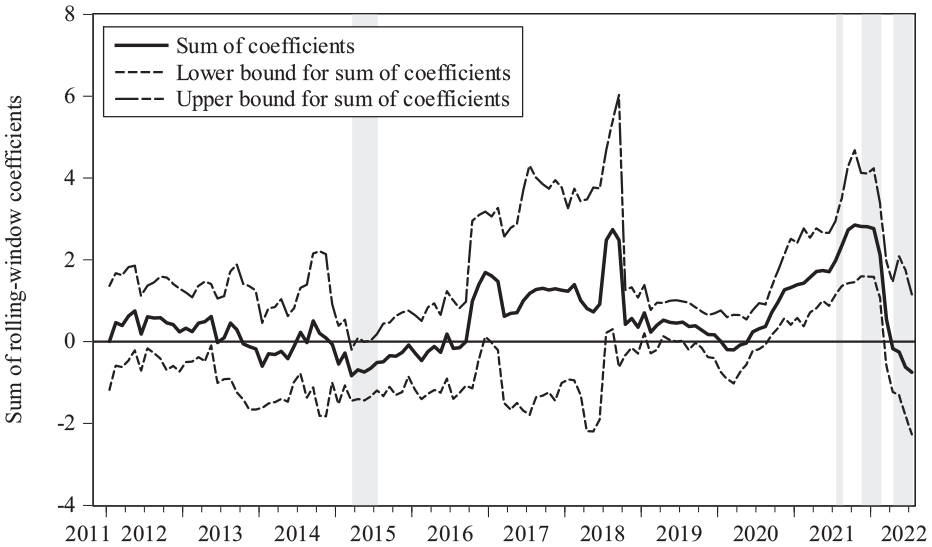
The rolling-window subsample Granger tests are conducted using the software EViews. Figure 6 reports the p-values. Results show that the p-values are less than 0.1 during 2016:M12–2017:M1, 2019:M2–2019:M12, and 2020:M6-2020:M7, indicating that TI is a Granger cause of REI during these periods. Figure 7 reports the influence of TI on REI. We can see that TI influences REI positively in 2019:M2–2019:M12, suggesting that during these periods, TI promotes more investment in renewable energy than in non-renewable energy. However, this influence is negative in 2016:M12–2017:M1 and 2020:M6–2020:M7, suggesting that TI reduces the percentage of investment in renewable energy.

Bootstrap p-value of the statistics (the null hypothesis is that TI is not a Granger cause of REI).

Sum of rolling-window coefficients of TI’s influence on REI.
The result that TI increases REI is consistent with the risk-return model, proving that TI facilitates REI by reducing the risk of renewable energy. In recent years, the Chinese government has continued to encourage TI in renewable energy (Bai et al., 2020). In January 2019, the government passed the Guidelines on Building a Market-oriented Green Technology Innovation System (hereinafter referred to as “Guidelines”), which aims to promote the R&D and application of green TI to achieve economic transformation and sustainable development. The Guidelines propose several measures to promote renewable energy TI, such as establishing a fund to support the commercialization of green TI and combating violations of intellectual property of green TI. Afterward, the National Energy Administration (NEA) has taken several measures to accelerate the TI in renewable energy, which promotes REI. TI can reduce energy storage costs and improve the expected return and the energy storage system’s security, thereby reducing the risk (Elia et al., 2021). Therefore, TI facilitates REI during 2019:M2–2019:M12.
However, TI reduced REI in 2016:M12–2017:M1 and 2020:M6–2020:M7. There are several reasons. First, the Outline of the National Strategy of Innovation-Driven Development (ONSID) was released in 2016, facilitating TI’s rapid growth. When more TIs are focused on expanding the production scale, the energy demand will increase (Gunderson & Yun, 2017). Although renewable energy is gradually popularized, its price is relatively higher than non-renewable energy, leading to more demand for relatively cheap non-renewable energy. Second, although the government is actively developing renewable energy, renewable power generation is unstable due to uncertain factors such as seasonal and extreme weather (M. M. Zhang et al., 2016). Hence, when energy demand increases due to TI, coal still plays a major role in energy consumption (P. Guo et al., 2016). Third, renewable energy technology reduces the cost, which has caused the NEA to cut feed-in-tariffs on renewable energy power generation. A feed-in tariff is a policy aiming to guarantee the development of renewable energy by providing an above-market price for producers. The decrease of feed-in-tariffs aims to develop renewable energy in a market-oriented way, but it may decrease the expected return of REI in the short run (Wüstenhagen & Menichetti, 2012). Therefore, TI has a negative influence on REI. This finding is consistent with theoretical analysis, proving that TI increases the overall energy demand and leads to more investment in cheap non-renewable energy.
Figure 8 shows the p-values using TI as the dependent variable. The p-values are less than 0.1 during the periods of 2015:M3–2015:M7, 2021M7:2021M8, 2021M11:2022:M2; 2022:M4:2022:M7, showing that REI is the Granger cause of TI during this period. Figure 9 depicts the coefficients of REI’s influence on TI.

Bootstrap p-value of the statistics (the null hypothesis is that REI is not a Granger cause of TI).
Sum of rolling-window coefficients of REI’s influence on TI.
Specifically, REI influences TI positively in 2021M7:2021M8, and 2021M11:2022:M2, which means that more investment in renewable energy increases the overall level of TI in China. Since 2021, the Chinese government has been engaged in formulating guidelines and policies for carbon peaking and carbon neutralization. In particular, in October 2021, the government specified in the “Action Plan for Achieving Carbon Peak by 2030” that new coal power projects should be strictly controlled, which is conducive to REI. In addition, according to the 14th Five-Year Plan (2021–2025) for renewable energy development, the annual power generation of wind and solar power generation will double by 2025. Such policies encourage investment in renewable energy, which provides more funds for TI in renewable energy and thereby improves a country’s overall TI level (D. Zhang et al., 2022). Besides, renewable energy also facilitates development in other fields, promoting the overall TI of the country. This conclusion supports the theoretical analysis that REI facilitates TI by providing more funds.
However, the influence becomes negative during 2015:M3–2015:M7, indicating that less REI brings more TI. The decline of REI in 2015 was mainly caused by the sudden substantial growth of thermal power investment. The reasons are twofold. On the one hand, the coal price dropped sharply in 2015, with the coal price index falling from 137.7 in January to 130.8 in July. This has reduced the cost of thermal power and prompted a sudden substantial increase in thermal power investment. On the other hand, the State Council issued “Several Opinions on Further Deepening the Reform of the Electric Power System” in March 2015, deregulating the prices and sales of electricity, which increases the expected return on thermal power investment, thereby promoting non-renewable energy investment and causing REI to decrease. According to the NEA, the proportion of non-renewable energy power generation was more than 80% in 2015. The increase in non-renewable energy investment ensures the energy supply of production, which is conducive to TI (P. Guo et al., 2016). Therefore, the decline of REI led to an overall TI increase in 2015.
There is also a negative influence of REI on TI in 2022:M4:2022:M7, during this period, energy supply is difficult to meet energy demand. On the one hand, the Russia-Ukraine Conflict in early 2022 drove the energy price to soar (Liadze et al., 2022), which increased the cost of China’s power operation. On the other hand, the China Electricity Council predicts that the electricity demand will increase by 5%−6% in 2022. Confronted with such a situation, the NEA issued the Guidelines on Energy (2022) on March 29th 2022, to ensure the security and stable supply of energy, emphasizing that thermal power production should be increased to meet the needs of the production. As a result, there are more investments in thermal power, causing REI to decrease. The National Bureau of Statistics released that thermal power generation accounts for 68.8% of the total national power generation in the first half of 2022. The increase in thermal power investment ensures production, leading to the increase of overall TI in 2022:M4:2022:M7. In addition, the Law on Scientific and Technological Progress (2021 Revision) came into force at the beginning of 2022, which is conducive to TI. Thus, the negative significant influence from REI to TI during 2022:M4:2022:M7 is proved. We can conclude that renewable and non-renewable energy is essential in promoting China’s TI.
Discussion
In the empirical analysis, we use the bootstrap sub-sample rolling-window Granger causality test to investigate the interrelationship between TI and REI in different subsamples and draw third conclusions. Firstly, we find that TI can promote REI by reducing the risk and increasing the expected returns of REI. The empirical result shows that during 2019:M2–2019:M12, TI had a significant positive influence on REI. This is mainly because the NEA took several measures to accelerate the TI in renewable energy in 2019, which reduced the risk and thereby promoted REI. This result supports the risk-return model, proving that TI facilitates REI by reducing the risk of renewable energy. Our finding is consistent with other related studies (J. Li et al., 2020; Solarin et al., 2022; Vural 2021; Yüksel et al., 2020), but they mainly discuss the production and consumption of renewable energy rather than REI. For instance, Solarin et al. (2022) reveal that renewable energy TI facilitates the production of renewable energy in the BRICS. J. Li et al. (2020) propose that TI promotes renewable energy consumption in OECD economies. Different from these studies, this paper focuses on investment in renewable energy. As today’s REI helps to forecast tomorrow’s capacities, we can infer that TI facilitates the growth of the renewable energy industry in the long run.
Secondly, TI can reduce REI because the changes in TI will lead investors to reallocate investment between renewable and non-renewable energy to maximize profit under given risk. The empirical result shows that in 2016:M12–2017:M1 and 2020:M6–2020:M7, TI had a negative influence on REI. During these periods, TI developed rapidly under the Strategy of Innovation-Driven Development, which expanded the production scale and increased the energy demand (Gunderson & Yun, 2017). This has led investors to reallocate investment between non-renewable and renewable energy. As the power generation from non-renewable energy is more stable than renewable energy (M. M. Zhang et al., 2016), the investment in non-renewable energy increases significantly in the short run, causing REI to decrease. This finding supports the risk-return model, suggesting that investors make REI decisions based on expected returns and risk. This result is different from studies that China’s TI benefits the renewable energy industry (P. Guo et al., 2016; C. C. Lee & Wang, 2022; S. Zheng et al., 2021). For example, P. Guo et al. (2016) suggest that TI helps the transition of energy structure by reducing the consumption of non-renewable energy. In contrast, we prove that TI can reduce REI by expanding production and driving up the demand for less risky and cheaper non-renewable energy. This finding has important implications for the government to achieve carbon neutrality, suggesting that we should improve the technology and reduce the cost of renewable energy.
Thirdly, it shows that the influence of REI on TI is time-varying. During the periods of 2021M7:2021M8, and 2021M11:2022:M2, more REI increases the overall level of TI in China. However, during 2015:M3–2015:M7 and 2022:M4:2022:M7, less REI brings more TI. These results are related to investors’ investment decisions. Investors need to allocate funds between non-renewable and renewable energy. In 2021, the Chinese government formulated several policies encouraging REI to achieve the vision of carbon neutralization, which increased the expected return on REI. This prompted investors to allocate more funds for TI in renewable energy and related industries, which improved the overall TI level (D. Zhang et al., 2022). However, in 2015 and 2022, the expected return on thermal power investment increased because of the reduction of coal price and supporting policies on thermal power, which promotes non-renewable energy investment, causing REI to decrease. More non-renewable energy investment ensures the energy supply of production, which is conducive to economic growth and TI (P. Guo et al., 2016). These time-varying results imply that REI promotes TI only when renewable energy provides more expected return under a given risk than non-renewable energy does, which extends the existing static research. In addition, existing literature focuses on the generation and policies of renewable energy rather than investment (Hille et al., 2020; S. Li & Shao, 2021; L. Zhang et al., 2022). For instance, Hille et al. (2020) reveal that supporting policies on renewable energy spurs solar- and wind-power-related TI. S. Li and Shao (2021) find that the share of renewable energy power generation impedes TI for the OECD countries, which does not discuss REI directly. Different from these studies, this paper addresses the investment and investigates the dynamic influence of REI on TI.
Furthermore, the method that we used is the bootstrap sub-sample rolling-window Granger causality test, which is different from other related studies (A. Khan et al., 2021; C. C. Lee & Wang, 2022; Vural 2021; Yüksel et al., 2020). For example, A. Khan et al. (2021) apply a full-sample Granger causality test to examine the influence of TI on renewable energy, which may cause estimation biases when there are structural breaks. C. C. Lee and Wang (2022) use the panel regression model to discuss TI and energy security, but they fail to investigate the time-varying relationships. Our method examines the time-varying causal interrelationship between TI and REI, which allows us to observe the influence of structural change on stability across different sub-samples. This method is also used in other studies (Arslanturk et al., 2011; Ramzan et al., 2023; Su et al., 2022; Yuan et al., 2022) to explore the two-way dynamic relationships between two variables when there are structural breaks.
Conclusion, Implication, and Limitation
Conclusion
With the buildup of greenhouse gases and climate change, there is a dire need to develop renewable energy to achieve carbon neutrality. As an attractive but risky industry, renewable energy requires substantial investments. However, the risk and return of the investment are usually affected by TI (Kitzing et al., 2020), and there is no answer to whether TI can always promote REI. In this context, the purpose of this study is to examine the relationship between TI and REI and to put forward policy suggestions for developing renewable energy. Firstly, we conduct the full-sample Granger causality test based on the VAR model. Results show that there is no relationship between TI and REI, which departs from the existing studies (P. Guo et al., 2016; Popp et al., 2011). Considering that the full-sample Granger causality test assumes that there is only a single Granger causality in the whole sample, it is inaccurate in estimating the relationship between TI and REI. Secondly, we apply the parameter stability test, results show that the parameters are unstable and structural changes exist. Therefore, we apply the bootstrap sub-sample rolling-window Granger causality test to examine the time-varying causal relationship between TI and REI in different subsamples. This method enables us to observe the difference in casualty caused by structural changes in different subsamples and improve accuracy (Qin et al., 2021). We draw two main conclusions.
First, China’s TI has both promoting and inhibiting effects on REI. On the one hand, TI can increase REI during 2019:M2–2019:M12, because renewable energy-related TI can reduce risks of REI. On the other hand, TI can also result in a decline in REI in 2016:M12–2017:M1 and 2020:M6–2020:M7 by raising the expected return on non-renewable energy. The development of TI expands the production scale and increases the energy demand, which leads investors to reallocate investment between non-renewable and renewable energy. Considering that the power generation from non-renewable energy is more stable than renewable energy (M. M. Zhang et al., 2016), investors may increase their investment in non-renewable energy in the short run, causing REI to decrease. These findings are consistent with the risk-return model, verifying that investors need to maximize the portfolio’s expected returns under certain risks.
Second, positive and negative influences of REI on TI are observed in different periods. On one hand, the renewable energy industry is technology-intensive, which facilitates TI. On the other hand, the relatively higher price and intermittent renewable energy production increase the total energy cost, impeding TI in other fields.
Theoretical and Practical Implication
This paper has the following theoretical implications. Firstly, this paper extends the research of innovation and renewable energy by considering the investors’ investment decisions, which is crucial for forecasting renewable energy capacities in the future. Existing research focuses on the capacity and consumption of renewable energy, rather than addressing investment (Solarin et al., 2022; Vural 2021; L. Zhang et al., 2022). As investigating today’s investment in renewable energy is conducive to forecasting tomorrow’s capacities, our finding provides theoretical support for future research on REI. Secondly, this paper extends the future research scope by using the bootstrap sub-sample rolling-window causality test (Balcilar et al., 2010), which examines the time-varying interrelationship between TI and REI. Existing research mainly uses the full-sample causality test or panel regression, neglecting the parameters’ structural changes, which results in an unreliable result (Su et al., 2021; Yuan et al., 2022). Our method examines the dynamic causal interrelationship between TI and REI, which enables us to observe the influence of structural change on stability across different sub-samples. This method can be used in future studies to investigate the two-way time-varying relationships between two interacting variables when there are structural breaks.
The interrelationship between TI and REI also provides practical implications for the government. First, as TI can facilitate REI and contribute to the low-carbon economy, policymakers can encourage renewable energy TI by providing more support for R&D. This is conducive to improving the expected return on REI, reducing risks, and promoting the growth of the renewable energy industry. Second, policymakers should weigh the advantages and disadvantages of REI to ensure energy security. On the one hand, REI provides more funds for R&D in related fields, which helps improve the overall TI level. On the other hand, as renewable energy costs are relatively higher than non-renewable energy, excessive REI may crowd out the R&D funds for TI. Moreover, as the production of renewable energy may be intermittent, excessive REI may harm the short-run development of the economy. Hence, the government should balance the investment between renewable and non-renewable energy according to national conditions to realize sustainable development.
Furthermore, the interrelationship between TI and REI has important practical implications for investors. As the renewable energy industry has long-term growth potential, it is wise for investors to add REI to their portfolio. In particular, with the continuous improvement of TI, the risk of REI is gradually reduced, which indicates that investing in renewable energy can provide a relatively high return per risk unit. However, as TI can also expand production and increase total energy demand (Gunderson & Yun, 2017), which raises the return per risk unit of both REI and non-renewable energy investment, investors should reallocate investment between the two assets to optimize their portfolio.
Limitations and Future Research
The first limitation of the paper is that we focus on the relationship between TI and REI in China, while do not consider other economies. REI is an important issue for countries in the context of carbon neutrality, and the influence of TI on REI may differ among other countries. Hence, future research can investigate whether TI can promote REI using other countries as samples. However, considering that China is the largest developing economy and has committed to the time of carbon peak and carbon neutralization, it has special significance to study this issue using China as a sample.
The next limitation is the relatively limited period. We use the sample in 2010:M1–2022:M7 and reveal that TI can impede REI. This is mainly because when TI expands production and increases energy demand, non-renewable energy investment may crowd out REI due to the discontinuous and high cost of renewable energy production. However, with the maturity of renewable energy technologies and the decline of costs in the future, we have no idea whether this conclusion still holds. Therefore, it is meaningful to see whether this phenomenon will still exist in future research.
Footnotes
Abbreviations
AIC Akaike information criterion
CPC Communist Party of China
FEP Final prediction error
HQ Hannan-Quinn information criterion
IAV Industrial added value
LR Likelihood Ratio
NEA National Energy Administration
ONSID Outline of the National Strategy of Innovation-Driven Development
RB Residual-based bootstrap
REI Renewable energy investment
TI Technological innovation
VAR Vector Autoregression
Declaration of Conflicting Interests
The author(s) declared no potential conflicts of interest with respect to the research, authorship, and/or publication of this article.
Funding
This paper is supported by Fujian Social Science Planning Major Project (No. FJ2020MJDZ049).
Data Availability Statement
Data sharing not applicable to this article as no datasets were generated or analyzed during the current study.