
Abstract
CAMSIS scale measures the long-term position of occupations in social hierarchies. The CAMSIS-China scale, which measures the social interaction distance among occupations as well as the social hierarchies of China in the 21st century, was constructed through the Goodman’s class of Row-Column Association Models II (RCII) according to the occupation tables formed by CGSS data from 2003 to 2018. The validity of the CAMSIS-China scale has been verified. The results show that the most outstanding feature of the CAMSIS-China scale is that farm labors are at the lowest ends, and their scores are separated from other occupations with clear boundaries. Another feature is that occupations characterized by government and public institutions are with unusually high scores. Patterns of specificity reflect that the hukou and danwei sector/ownership, as key institutions to facilitate the redistribution of resources and life chances among Chinese citizens, affect social interaction patterns.
Plain Language Summary
1. Constructed CAMSIS-China scale by using the RCII model.
2. Verified the validity of the CAMSIS-China scale.
3. Described characteristics of CAMSIS-China scale.
4. Discussed the factors that cause the particularity of CAMSIS-China scale.
Introduction
Since more than four decades of reform and opening-up, sociological research has witnessed burgeoning in China. A large amount of empirical research literature has accumulated on the changing patterns of inequality and social mobility based on measures of social class or social stratification. Categorical versus continuous measures have been the longest standing debate: whether social class or stratification involve discrete categories with clear boundaries, or whether they are better analyzed using continuous measures and/or with boundaries determined empirically based on actual data rather than being imposed using theoretical decisions (Jarman et al., 2021).
The Erikson-Goldthorpe-Portocarero (EGP) and Wright class schemes, as convenient choices of discrete categorical measures, are used by many articles that typically consider what is known about social inequality in education or work, followed by evaluations of how social inequality is changing in response to social forces and its implications. Hsiao (1999) summarized many localized versions of the social class scheme classification proposed by East Asian scholars of China, Japan, South Korea, and the Taiwan Province of China. Based on occupational differentiation and possession of organizational, economic, and cultural resources, researchers at the Chinese Academy of Social Science (CASS) have proposed that Chinese people can be classified into 10 social strata (Lu, 2002). Wu and Treiman (2007) found that the EGP class scheme estimated from Chinese empirical data do not follow the same gradient order observed in European and American countries. They argued that the classification ignored China’s hukou system and the rural-urban divide. Based on institutions with Chinese characteristics, such as hukou, danwei, and status distinction between cadres and workers, Lin and Wu (2009) developed Wright’s Chinese class schema. They showed that compared with either the EGP class scheme or CASS classification, their classification captures major socioeconomic cleavages in China. These studies have become reliable discrete category measures for Chinese society to support empirical research in the social sciences. (Cai, 2005; Cohen & Wang, 2009; Hannum, 2005; Shu & Bian, 2003; Sun et al., 2021; Wu & Cheng, 2013; Zhou & Xie, 2017).
Treiman’s (1977) Standard International Occupational Prestige Scale (SIOPS) and Ganzeboom’s et al. (1992) International Socio-Economic Index (ISEI) are frequently used as occupation-based continuous stratification measures, implicitly assuming that the social hierarchy consists of vertically ordered continuous sequence of positions and are typically characterized by incremental status differences. Moreover, both measures are consistently updated to match the most recent version of the International Standard Classification of Occupations (ISCO), which is convenient for scholars to conduct empirical research on social sciences based on ISCO-coded survey data. However, research on continuous measures for social stratification in China is rare. Early cross-sectional surveys at one site, in either rural or urban areas, could not be compared or generally synthesized. Since 2000, continuous measures of Chinese social stratification have been supported by actual data from the increasing availability of nationally representative household survey data. Based on a survey on social change conducted by CASS in 2001 (a multistage, stratified national probability sample of more than 6193 adults), Li (2005) examined the prestige stratification of Chinese society using occupational prestige scale and socio-economic index. The prestige stratification scale provided by Li (2005) has been the basis for many subsequent empirical studies (Zhao & Bodovski, 2020; Zheng et al., 2019), and has been cited more than 800 times.
The Cambridge Social Stratification and Interaction Scale (CAMSIS) (Prandy, 1990, 1999) is another well-known and frequently used occupation-based continuous stratification measure. Stewart et al. (1973) presented a measure based on data on social interaction patterns known as the Cambridge Scale, which was subsequently expanded into a suite of measures known as the CAMSIS (Prandy, 1990, 1999). CAMSIS is now available for over 30 countries (CAMSIS National Versions, 2021), allowing for broader analysis and comparative work. An international CAMSIS (ICAM) is used for situations where only a small number of occupational categories are available (Meraviglia et al., 2018).
The Chinese General Social Survey (CGSS) is an annual or biennial cross-sectional survey of a nationally representative population sample from all provinces, except for Tibet. Based on the accumulated CGSS surveys since 2003, this study developed a social distance measure for contemporary Chinese society (CAMSIS-China scale) and validated it by comparing it with four typical variables (education, income, prestige, and self-identified class). Since the beginning of the new century, the impact of ongoing institutional transitions on social structure has manifested in that people are more aware of their civil and property rights and focus more on the social value of cultural and economic resources (Cai, 2005; Wu & Cheng, 2013). This emerging social structure has a cultural and an economic character, and CAMSIS is constructed on “social distance” as a concept that merges the two characters. Through analysis of marriage choice data, CAMSIS-China scale measures the social distance of occupations and highlights the hierarchical situation in the contemporary Chinese society. As a continuous gradational scale, CAMSIS-China scale has some pragmatic conveniences such as being easy to incorporate in a range of analytical methods and being suited to accessible devices of communication such as simple graphics. CAMSIS-China scale has provided not only a comprehensive picture of the social structure in contemporary China but also a solid basis for comparative research on social stratification and mobility. We proceed as follows. Section 2 provides an overview of the contribution of the CAMSIS scale to studying social inequality and statistical modeling techniques for its construction. Section 3 introduces the data from CGSS and explores the characteristics of marital interactions involving occupations. Following the procedures described for building a CAMSIS scale, Section 4 constructs the CAMSIS-China scale of contemporary Chinese society for males and females. The validity of the CAMSIS-China scale is verified in Section 5. Section 6 concludes the paper with comments on the consistent pattern of gradational inequality and particularity of the CAMSIS-China scale.
CAMSIS Scale and RCII Model
CAMSIS scales are also known as “Social Interaction Distance (SID)” scales. CAMSIS assumes that members of groups that are socially more similar are more likely to interact socially than are members of groups that are socially less similar. Differences between groups in the relative frequencies of social interaction can be treated as reflecting the social distance between them. The CAMSIS reflects the experiential social distance between occupations through the “voluntariness” of social interaction and can be calculated from any data on social linkages between occupations. In different contexts, data on occupations linked by friendship, marriage, parent-child combinations, and within-career intra-generational mobility have been used to derive SID scales. The Economic and Social Research Council (ESRC) is the UK’s largest funder in economic, social, behavioral, and human data science. On its 50th anniversary in 2015, the ESRC reviewed 50 major research contributions in the social sciences over the past half century; one of them was CAMSIS. Lambert and Griffiths (2018), Torssander and Erikson (2010), Goldthorpe (2010), and Prandy (1999) considered the CAMSIS scale of social interaction to show how social relations present social structures. They agreed that, compared with traditional scales, the CAMSIS measures the long-term position of occupations in the social structure more objectively.
Stewart et al. (1973, 1980) from the University of Cambridge developed the first SID scale using data from the UK, which became widely known as the “Cambridge scale”. The SID scale assumed that the existence of classes can be inferred from how people cluster in their everyday lives. The suite of measures involved in the “Cambridge scale” was applied more widely, and the name CAMSIS came to be used when similar scales were gradually constructed for other societies (e.g., Bergman et al., 2002; de Luca et al., 2010; Lambert et al., 2013; Meraviglia et al., 2018; Prandy & Lambert, 2003; Prandy & Jones, 2001). The ongoing CAMSIS project continues to generate scales based on the social interaction distance between occupations for a range of societies. The editorial in the 50th anniversary of the annual Cambridge Social Stratification Seminar presented two brief characterizations of the “Cambridge school” approach: one was the measurement and analysis of social connections and the other was advanced statistical modeling (Jarman et al., 2021). There have been several replications of and updates to the CAMSIS scale, in addition to an increasing number of national versions for several countries (A version is defined according to the country with which it is associated, the period of the data on which the CAMSIS analysis was performed, and the occupational units on which the measure is based. For CAMSIS versions see www.camsis.stir.ac.uk). CAMSIS scales have been successfully used to analyze social mobility, education, illness and mortality, political party identification, occupational aspirations, occupational aspirations, ethnic inequality, and occupational segregation (early empirical applications using CAMSIS scales can be found in the website, for empirical applications in recent years see Berrie et al., 2023; Blossfeld, 2019; Gedikli & Serido, 2020; Lambert & Rutherford, 2020; Mastekaasa & Birkelund, 2023; ‘Social Stratification Research Seminar’Series, 2021).
The CAMSIS scales are usually calculated based on pairs of occupations linked by marriage or cohabitation, because these data are obtained from various household surveys. CAMSIS scales have been deliberately specific in terms of countries, time periods, and gender (i.e., different scales exist for different countries, time periods, and males and females). Empirically highlighting an association of individuals’ marriage choice with the occupations they are situated in, CAMSIS scales plot occupations to determine whether occupations are socially close or distant in a social space and depict a hierarchy of occupations or the stratification structure. These pairs of occupations linked by marriage are represented by a two-dimensional contingency table, wherein the rows indicate the category of one partner’s occupations, the columns indicate the category of the other partner’s occupations, and the cell frequencies indicate the number of occurrences of each combination in the population.
The construction of the CAMSIS scales uses both statistical modeling techniques. Correspondence analysis (CA) models are familiar to many social science communities. However, Goodman’s class of Row-Column Association models II (RCII) can be readily adapted to incorporate several model constraints and evaluations; thus, RCII model has become the recommended modeling technology to construct CAMSIS scales (Prandy & Lambert, 2003).
Goodman’s class of RCII model for the scale construction process also known as log-multiplicative models, and log linear by linear models. A RCII model for a two-dimensional contingency table formed by the row variable R and column variable C is given as a subset of the family of log-linear models (Daniel & Xie, 1999):

where
The software packages LEM, SPSS, Stata, and R can be used to estimate the row and column scores of RCII model with the simple Iterative Proportional Fitting (IPF) algorithm to maximize fit between the actual number of cases in each cell and model-based predictions and scores, thus estimating the CAMSIS scale scores.
CGSS Data, Occupation Table, and Interaction Characteristics
Surveys Data and Occupations Variables
In recent years, numerous large micro-social surveys have provided valuable first-hand data for analyzing the developments and changes in Chinese society in this new era. Our purpose is to construct CAMSIS-China scale for contemporary China, which requires a survey project with a large and wide-coverage sample, and contains sufficient information on individual demographic, economic, and social characteristics. The CGSS is the earliest national, comprehensive, and continuous academic survey project. As the primary data source for sociological research in China, the CGSS aims to explore social changes in terms of culture, health, family, labor force, employment, education, psychology, personality, and so on. The CGSS project began in 2003 and covered 28 provinces and regions. To date, data of 2003, 2005, 2006, 2008, 2010, 2011, 2012, 2013, 2015, 2017 and 2018 have been published. The sample size varied in each wave, ranging from approximately 6,000 to 12,000 cases in different years. In this study, the CAMSIS-China scale was estimated using the data on husbands-wives couples’ occupation provided by all waves of the CGSS from 2003 to 2018 except 2005 (occupations were coded differently in 2005). The CGSS collected data on more than 90,000 married couples in 10 waves of surveys from 2003 to 2018. The couples who reported on both husband’s and wife’s occupation both in occupations were retained. This procedure resulted in a sample of 38975 couples for CAMSIS-China construction.
Occupation of respondents or spouses was coded according to ISCO-08 in 2017 and 2018 surveys of the CGSS, while to ISCO-88 in the other waves from 2003 to 2015. In this study, each occupation was assigned to an ISCO-08 (which is the latest international classification standard) occupational title, as the ISCO-88 occupational title has been transformed to ISCO-08 based on the corresponding table of the International Labor Organization website for all the waves from 2003 to 2015 (For the cases that an ISCO-88 title corresponds to multiple ISCO-08 titles in the transcoding process were randomly converted to one of the ISCO-08 occupational titles).
Occupation Table
ISCO-08 has a four-level hierarchical structure of occupations, which consists of 10 major groups at the top level of aggregation and is subdivided into 43 sub-major groups, 130 minor groups, and 436 unit groups. Despite the reasonably sample size, the observation frequency of some occupations may be very small or even 0. To avoid that the occupation table being too sparse, the CAMSIS-China scale was built on three aggregation levels (major, sub-major, and minor, ignored the unit groups). Refer to the international experience in building CAMSIS (Bessundov, 2012; Prandy & Lambert, 2003), the under-represented occupational groups whose observation frequency is less than 30 in the sample, were merged to neighboring ones. Once a score for each merged occupation group was estimated, the same score was assigned to the occupation groups that previously merged. However, this sample included 10 major groups, 40 sub-major groups, and 126 minor groups, and other occupational groups which were not present in the original CGSS data sets were excluded in the CAMSIS-China scale. In addition, major group 0 (“Armed Forces Occupations”) is excluded empirically. As a result, 9 major groups, 38 sub-major groups, and 91 minor groups was involved in the occupation tables.
A
Distribution of Occupation and the Characteristics of Marital Interaction
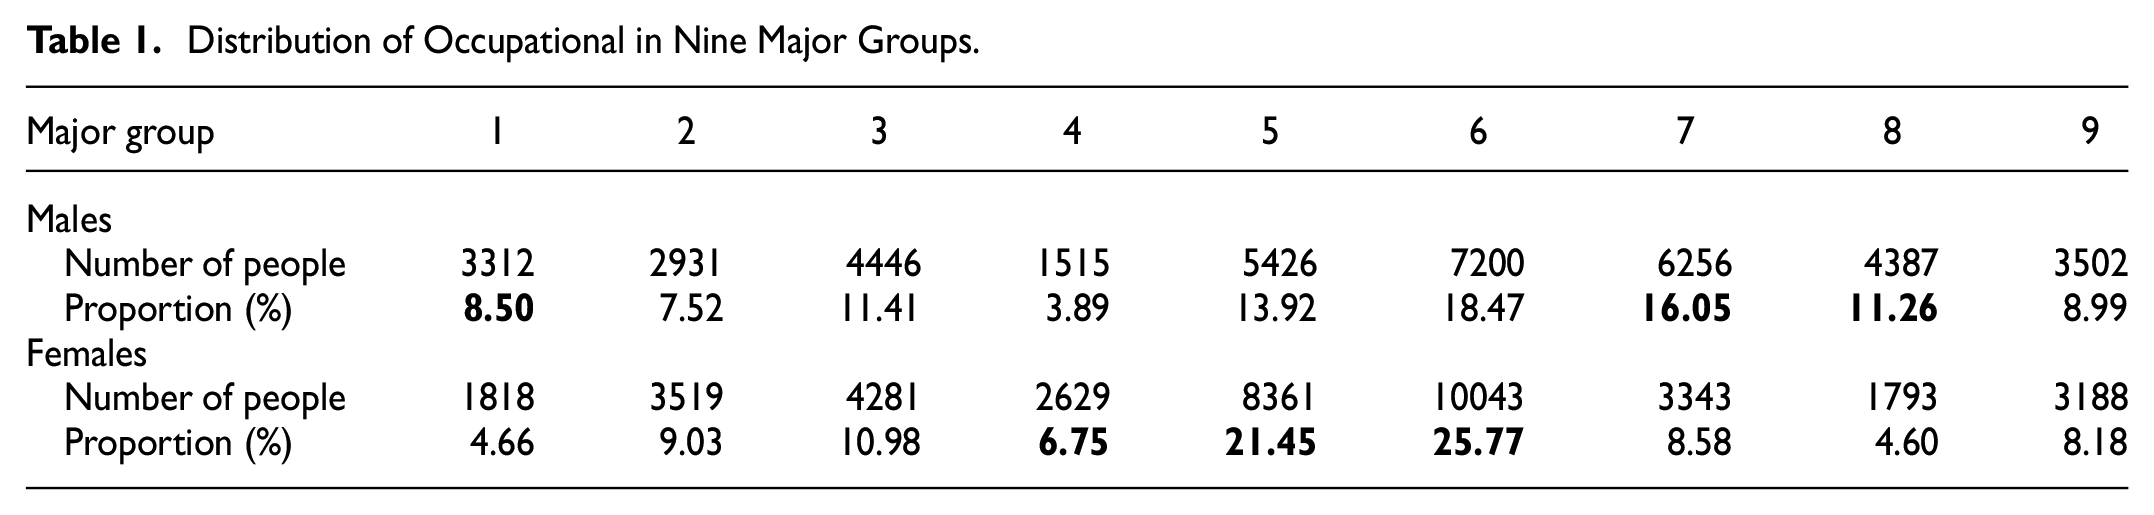
Table 1 shows the distribution of male and female occupations in the nine major groups, which reflects two obvious characteristics in contemporary Chinese society. First, the largest number of workers are engaged in major group 6, “Skilled Agricultural, Forestry and Fishery Workers,” implying that farmers remain the largest occupational group in China. China’s seventh national census adopted the domestic standard classification of occupations (GB/T6565-2009), in which occupational category 5, “Agriculture, forestry, animal husbandry, fishing and water conservancy staff,” has the same content as the major group 6 in ISCO-08. Census data show that category 5 is the occupation with the largest number of employed people, accounting for approximately 20.53%. The proportion of farmers in the current sample is 22.12%, which conforms to the actual situation of social development in China. Second, the distribution of occupation for males is significantly different from that of females; therefore, gander is an important factor affecting occupational structure. Table 1 shows that the proportion of males in major group 1, “Managers,” major group 7, “Craft and Related Trades Workers,” and major group 8, “Plant and Machine Operators and Assemblers,” is significantly higher than that of females. However, females account for a higher proportion in major group 4, “Clerical Support Workers,” major group 5, “Services and Sales Workers,” and major group 6, “Skilled Agricultural, Forestry and Fishery Workers.” Due to differences in gender characteristics and work tasks, males and females are usually suitable for different types of occupations, resulting in gender differences in occupational distribution.
Distribution of Occupational in Nine Major Groups.
The bubble chart can be used to visualize the occupation table and intuitively show the interactions between occupations. The horizontal axis in Figure 1 shows the occupations of wives (females), and the vertical axis represents the occupation of husbands (males). The size of the bubbles represents the frequency of the cross-combined occupations; a larger bubble indicates that the cross-combination is easier to observe in the sample. Figure 1 shows the distribution of cross-combination occupations in 9 major, 38 sub-major, and 91 minor groups.

Distribution of occupational-combinations: (a) on the major level, (b) on the sub-major level, and (c) on the minor level.
Two main features are shown in Figure 1. First, the bubbles on the diagonal are generally larger than those on the nondiagonal. The larger bubbles on the diagonal indicate that the frequency of couples in the same occupation is significantly higher than that of couples in different occupations, and the phenomenon of “occupational homogamy” is quite common. In fact, on the major level of occupation, the proportion of husbands and wives engaged in the same occupation is 38.07%. In particular, as high as 86.50% of male workers in major group 6, “Skilled Agricultural, Forestry and Fishery Workers” have wives in this group. On the sub-major level, the proportion of husbands and wives in the same occupation is 31.53%, of which sub-major group 61, “Market-oriented Skilled Agricultural Workers,” has the highest proportion of “occupational homogamy.” On the minor level, the proportion of husbands and wives in the same occupation is 29.42%, of which the minor group 611, “Market Gardeners and Crop Growers,” has the highest proportion of “occupational homogamy.” Numerically, as the level of occupational aggregation declines, the proportion of couples in the same occupation decreases. However, on the major level, there are only 81 kinds of cross-combination of occupations, of which the husbands and wives in the same occupation only account for 1/9. However, on sub-major and minor levels, the proportion of that husbands and wives in the same occupation is 1/38 and 1/91 of all cross-combinations, respectively. Thus, as the aggregation level of occupations declines, the tendency toward “occupational homogamy” becomes more pronounced, as shown in Figure 1. It is indeed a common phenomenon in society that husbands and wives are in the same occupation because the same work environment, tasks, and partners objectively contribute to the establishment of the marriage relationship between males and females. In the construction of the CAMSIS, the core idea is to reflect the social distance between occupations through social interactions established voluntarily between individuals.
Second, at major, sub-major, and minor levels of occupations, for all wives’ occupations, the bubbles on the diagonal are almost larger than those on the non-diagonal, but not for husbands. This shows that female employees are more restricted by objective factors in the process of establishing a marriage relationship and that marital interaction is relatively closed. The subjective will of male employees plays a greater role in the establishment of marriage relationships, and marital interaction is relatively open. Because of the different distributions of occupations for males and females and interaction patterns between occupations, it is necessary to construct CAMSIS-China scale for males and females separately. According to the international experience of CAMSIS, the construction of gender-specific scales is the distinguishing feature and advantage of CAMSIS compared with the Occupational Prestige Scale and Socioeconomic Index of Occupational Status (Prandy & Jones, 2001).
CAMSIS-China Scale for Males and Females
Because the cross-combinations on the diagonal are influenced by the objective environment, we removed diagonal cross-combinations in the construction of the CAMSIS scale. We used model (1) to fit the occupation tables on the major, sub-major, and minor levels for the occupation table with diagonal and non-diagonal cross-combinations. The fitting results of the models are listed in Table 2.
Fitting Results on the Major, Sub-major, and Minor Levels.

To facilitate the comparison of CAMSIS with other occupational scales, according to international experience, we performed a linear transformation from the estimated values of
Table 3 presents the CAMSIS-China scores and rankings of males and females at the major level. According to the estimation results of the
CAMSIS-China Scores at Each Major Group.
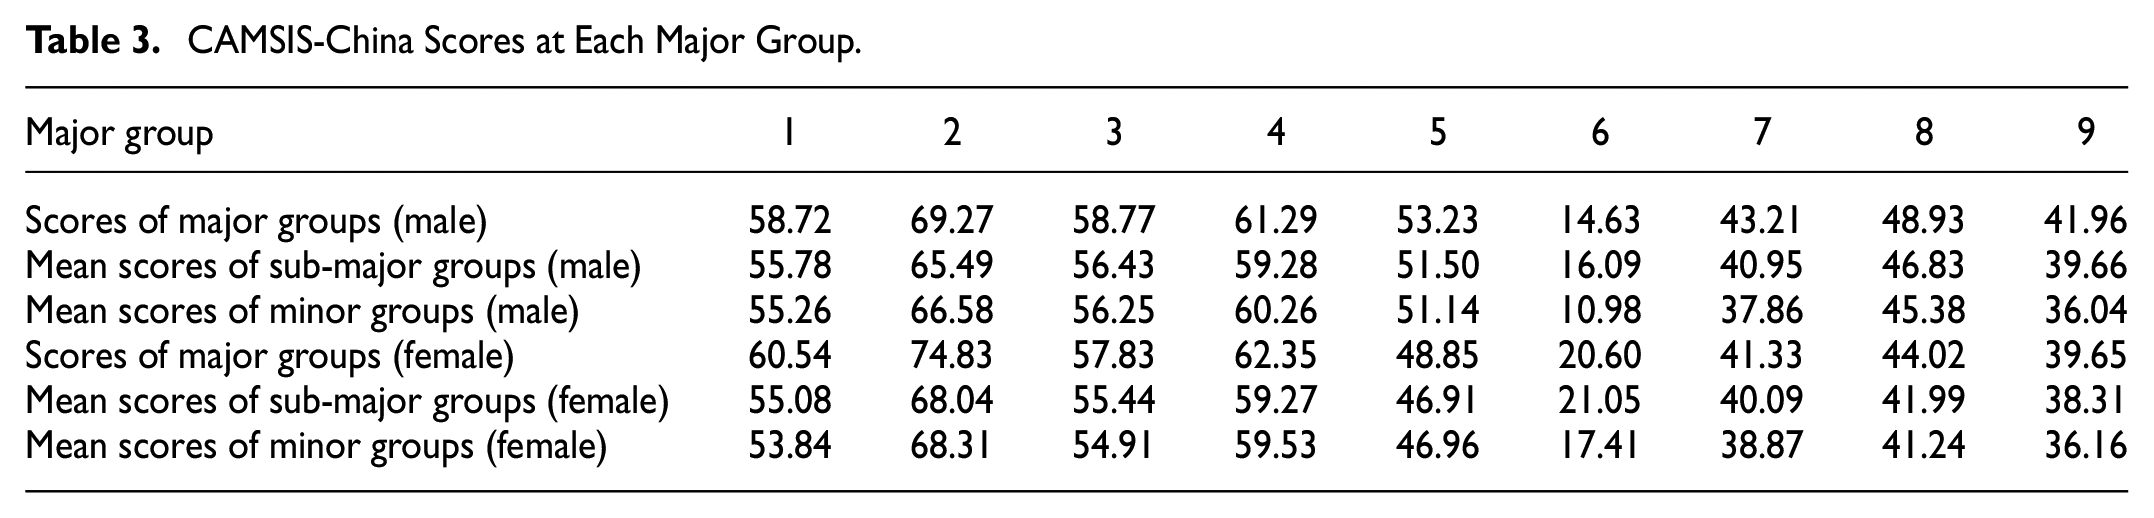
The CAMSIS-China scale listed in Table 4 reflects some basic characteristics and changing trends of the occupational hierarchy. Senior professionals and managers have the highest CAMSIS-China scores, as these occupational groups occupy the most power and cultural capital and are at the upper level of the social class. Although several previous investigations have reached the same conclusion, in the CAMSIS-China scale, the scores of senior professionals are higher than those of senior managers, which is contrary to the conclusion of the 2005 Occupational Prestige Survey (Li, 2005). This reflects the increasing trend of cultural capital in contemporary society. Intellectuals, especially functional intellectuals, such as teaching professionals in universities and vocational education, legal and business professionals, scientific and engineering professionals, authors, journalists, linguists, and creative and performing artists, have high scores in these groups, reflecting society’s recognition of the value of their professional knowledge and skills.
CAMSIS-China Scale for Males and Females at Minor Level.

Note. Minor groups marked with * are merged-occupation groups and occupational groups in parentheses share the same score. Merged minor groups 132*(131, 132), 134*(133, 134), 214*(211, 212, 213, 214, 215), 221*(221, 222, 223, 224), 226*(225, 226), 241*(241, 242), 251*(251, 252), 261*(261, 262), 264*(263, 264), 314*(314, 315), 325*(321, 322, 323, 324, 325), 343*(342, 343), 351*(351, 352), 411*(411, 412), 524*(523, 524), 541*(531, 532, 541), 612*(612, 613), 622*(621, 622, 631, 633, 634), 712*(712, 713), 832*(831, 832), 833*(833, 834, 835), 952*(951, 952).
The occupational groups whose scores are slightly lower than senior professionals and managers are technicians and associate professionals who work for government or finance and health, such as government regulatory associate professionals, administrative and specialized secretaries, financial and mathematical associate professionals, and medical and pharmaceutical technicians. These groups provide necessary government management and public services, with relevant practitioners obtaining high CAMSIS-China scores.
Subsequently, the CAMSIS-China scores decrease successively along groups of production and service managers, engineering technicians and controllers, services and sales workers, craft and elementary workers, market gardeners, and crop growers. The occupation scores are negatively correlated with occupational size. Market gardeners and crop growers, that is, the farmer groups with the largest occupational proportion in China, have the lowest CAMSIS-China scores, contrary to the survey results of Li (2005). Li’s survey found that farmers have higher prestige than urban elementary physical workers, such as nursemaid or refuse workers, and believed that urban–rural differences weakened in lower prestige groups. However, the CAMSIS-China scale shows that from the perspective of social interaction, farmers have the longest social distance from other occupational groups. This means that in marital interaction, there is an interactive isolation between farmers and other occupational groups. This phenomenon is more obvious among male farmers than among female farmers.
Validity Test of CAMSIS-China Scale
Empirical Scheme Design of CAMSIS-China Scale Validity Test
The validity of the scale is the most important indicator for evaluating it as a qualified measurement tool. The validity test refers to the degree of consistency between the measurement results of the scale and the measurement objectives. The more the measurement results are in line with the measurement objectives, the higher is the validity. The evidence for the validity test includes the criterion and construct validity tests. Criterion validity refers to the association between measurement results and calibration criteria; in empirical testing, it is quantified as the correlation between scale scores and selected calibration variables. Construct validity aims to test, explain, and analyze the meaning of scale scores with psychological theory; in empirical testing, it is quantified as the correlation between scale scores and individual subjective evaluation indicators.
In the construction of occupational hierarchy scales, the variables of education and income are closely related to measure social stratification, and Blau and Duncan’s socioeconomic index of occupational status is also constructed based on education and income. Therefore, we selected the education and income of occupational practitioners as calibration variables to test the criterion validity of the CAMSIS-China scale. In the CGSS survey, respondents’ educational status was divided into 13 levels. We defined respondents with university, vocational education, and higher education as “high-educated” earners, and calculated the proportion of “high-educated” earners in each occupational group in the sample. The validity of CAMSIS-China scale is reflected through the correlation coefficient between CAMSIS scores and the proportion of “high-educated” of various occupations. The CGSS collected the respondents’ occupational income during the previous year. We calculated the median income of males and females in each wave of the survey separately, and divided all respondents into “high-income” earners and “low-income” earners according to gender and median income. We calculated the proportion of “high-income” earners in each occupational group in the sample, reflecting the possession of economic assets by each occupational group. We used the proportion of “high-income” earners instead of the average income to eliminate the interference of abnormal income data and maintain the same evaluation standard as education.
Li’s (2005) Occupational Prestige Scale is a comprehensive and scientific measurement for contemporary China, which is considered as another important variable in the validity criterion test. Li used the survey data of 12 provinces in 2001 to measure the prestige of 81 occupations and then standardized the prestige scores twice to obtain an occupational prestige scale with scores ranging from [9.73 to 90.75]. Based on the similarity of occupational content, we converted the 81 occupations in Li’s prestige scale into ISCO-08 minor groups, and generated weighted average prestige scores in each major and sub-major group. Then we calculated the correlation coefficient between prestige scores and CAMSIS-China scores. The CGSS surveyed respondent’s self-identified class, which divided the social class into 1 to 10 layers, with 1 point representing the lowest layer and 10 points representing the highest layer. Self-identified class is an individual’s perception of one’s social position and is a stratified indicator advocated by “real” class theory. We used the self-identified class, a psychological cognitive variable, to test the construct validity of the CAMSIS-China scale. We took 5 points as the standard to calculate the proportion of respondents with scores above 5 points in each occupational group. The construct validity of CAMSIS-China scale is reflected by the correlation coefficient between CAMSIS-China scores and the proportion of “high self-identification” in occupational groups.
CAMSIS Scale Validity Test Results
The Pearson correlation coefficient measures the degree of linear correlation between two continuous variables, and is calculated using the original values of the variables. The Pearson correlation coefficient between CAMSIS-China scores and the validity test variable reflects the consistency of the direction and quantity of CAMSIS-China scale and the value change of the validity test variable. The Spearman correlation coefficient measures the consistency of rank changes between two variables, and is calculated using the rank of values between two variables. The Spearman correlation coefficient is a nonparametric statistic that can be considered as the Pearson correlation coefficient between two arranged variables. The CAMSIS-China scale is measure of both the social distance between occupations and the ranking of occupational hierarchy. Therefore, the calculation of the Pearson correlation coefficient focuses on the effectiveness of CAMSIS-China scale in reflecting the social distance between occupations, and the calculation of the Spearman correlation coefficient is more inclined toward the effectiveness of the CAMSIS-China scale in reflecting the occupational hierarchy.
The calculation results of the correlation coefficient between the CAMSIS-China scale and the validity test variables are listed in Table 5. Figure 2 shows the scatter plot between CAMSIS-China scale (males and females separately) and the validity test variables at a minor level. The CAMSIS-China Scores and Four Typical Variables of the Major Groups shown as the Appendix B.
Correlation Coefficients Between CAMSIS-China Scale and the Validity Test Variables on Major Groups, Sub-major Groups, and Minor Groups.
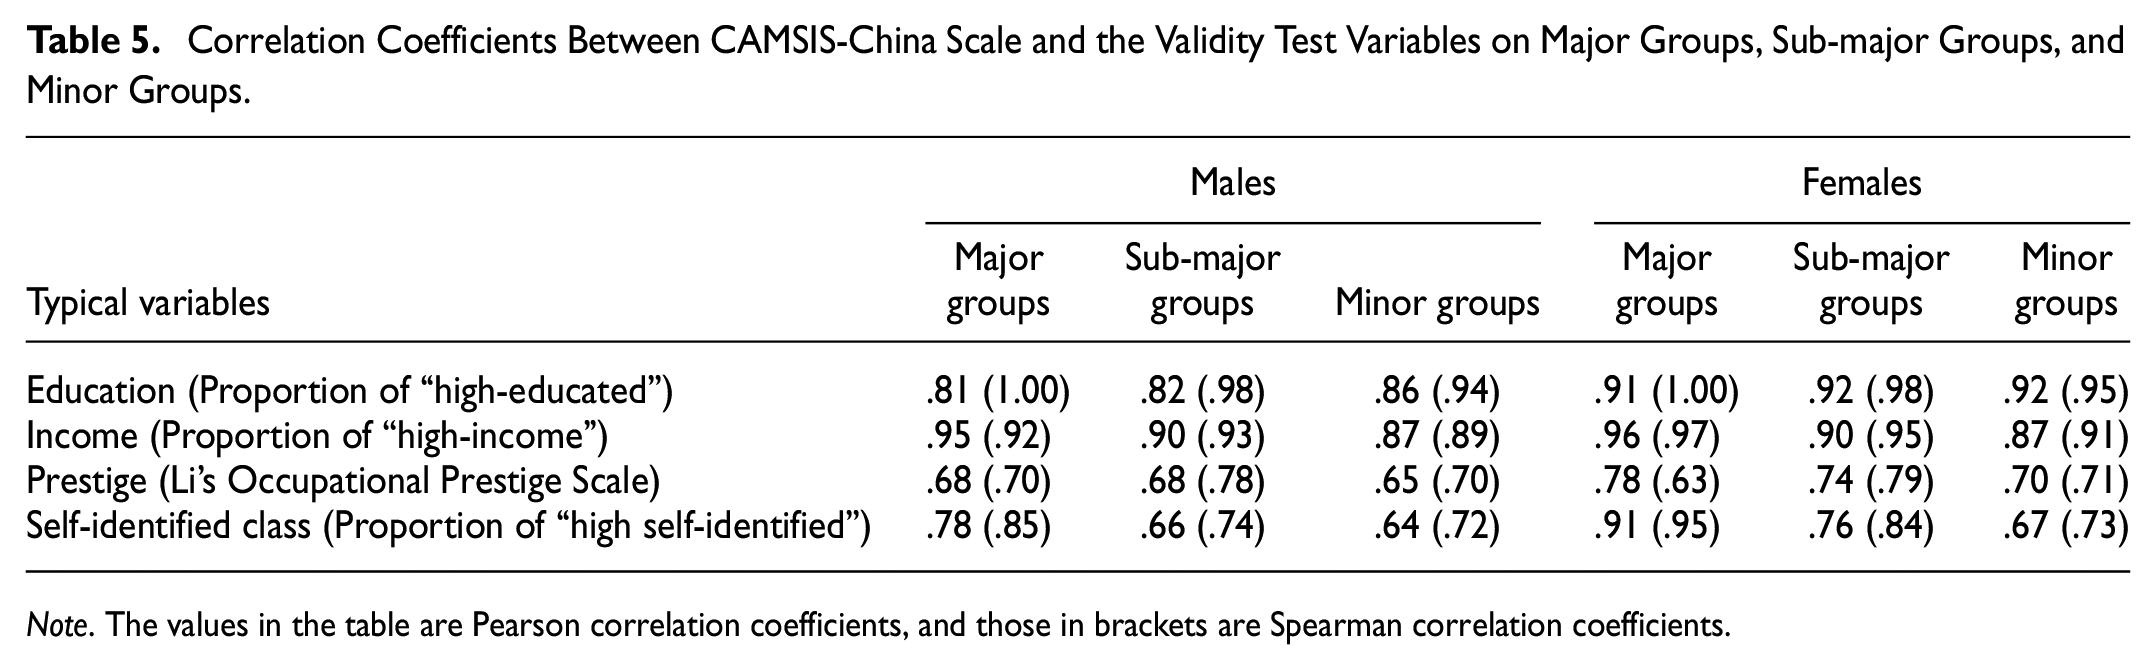
Note. The values in the table are Pearson correlation coefficients, and those in brackets are Spearman correlation coefficients.

The correlation of CAMSIS-China scores with the typical variables on the minor level: (a) CAMSIS-China and Education, (b) CAMSIS-China and Income, (c) CAMSIS-China and Prestige, and (d) CAMSIS-China and Self-identified Class.
Table 5 and Figure 2 shows that regardless of gender and occupational aggregation level, the CAMSIS-China scale is positively correlated with education, income, prestige, and self-identified class. The Pearson correlation coefficients are above .64, and the Spearman correlation coefficients are above .70. This shows that using traditional scales and typical variables as calibration standards, the CAMSIS-China scale has validity as a scale for measuring social distance and hierarchy of occupations. Specifically, the values of the Pearson correlation coefficient and Spearman correlation coefficient show a very strong correlation between the CAMSIS-China scale and education and income, indicating that these three variables, as measures of absolute and relative social positions of occupations, are highly similar. The correlation between the CAMSIS-China scale and prestige is slightly lower than that between education and income. It also reflects that although the CAMSIS-China scale and prestige scale are quite different in their theoretical basis and statistical methods of construction, the measurement results of social distance and hierarchy of occupations are highly consistent. There are also large correlation coefficient values between CAMSIS-China scale and the self-identified class, indicating that the occupational hierarchy advocated by the “real” class theory, CAMSIS-China scale, can indeed reflect an individual’s perception of their social position.
There are no significant gender differences in the correlation between the CAMSIS and the validity test variables. Comparing the correlation coefficients, it can be found that for both males and females, CAMSIS-China scale and income show high consistency. In terms of education, prestige, and self-identified class, the measurement results of the CAMSIS-China scale are more consistent in female groups than in males. If we use CAMSIS-China scale as a criterion, income is appropriate as a measure of social interaction distance and social position for both males and females, while assets other than economic assets are more appropriate for females. Moreover, the correlation between the CAMSIS and the validity variables is also affected by occupational aggregation level. Generally, as occupational aggregation is refined, the correlation between the CAMSIS and validity test variables decreased. This shows that, as the aggregation is refined, there are more variations in the social interaction distance and hierarchy of occupations, which affects the consistency between scales.
Conclusion and Discussion
In this study, based on the full absorption of theory and practice of constructing the CAMSIS scale, we used the RCII model to fit the data of CGSS from 2003 to 2018 and constructed the CAMSIS of contemporary China for males and females, which measures the social interaction distance and hierarchy of ISCO-08 occupations. Furthermore, by analyzing the correlation between the CAMSIS-China scores and typical variables such as education, income, prestige, and self-identified class, the validity of the CAMSIS-China scale was verified.
At the higher end of the CAMSIS-China scale, occupations such as Legal Professionals (261), University Professors (231), and Software and Applications Developers and Analysts (251) are characterized by high levels of skill and educational requirements, high incomes, and high levels of economic security. Slightly lower but still in the upper quartiles are occupations that tend to be advantaged in some but not necessarily in all these features (e.g., Financial and Mathematical Associate Professionals [331], Sales, Marketing, and Development Managers [122], Medical Doctors [221]). Some highly skilled manual jobs, such as Electronics and Telecommunications Installers and Repairers (742), Machinery Mechanics and Repairers (423), and some jobs that combine favorable economic rewards with very demanding working conditions, such as Blacksmiths, Toolmakers and Related Trades Workers (722), and Heavy Truck and Bus Drivers (833), are in the mid-range of the CAMSIS-China scale. The lowest quartile of the CAMSIS-China scale, consists of occupations characterized by relatively low pay, lack of academic educational requirements, and menial and demanding tasks, such as Refuse Workers (961), Vehicle, Window, Laundry and Other Hand Cleaning Workers (912), Street Vendors (excluding food) (952), and Market Gardeners and Crop Growers (611). Overall, we can report that CAMSIS-China scale is generally consistent with other versions across countries and time periods of the social structure depicted by a social interaction distance scale for occupations.
When the CAMSIS-China scale shows a consistent pattern of gradational inequality, it also shows a particularity. The most outstanding feature is that farm laborers are at the lowest end, and their scores are separated from other occupations with clear boundaries, whether in male/female scale at the major, sub-major, and minor levels. Second, occupations characterized by government and public institutions, such as Government Regulatory Associate Professionals (335) and General Office Clerks (411), have unusually high scores. Patterns of specificity in the CAMSIS-China scale reflect that the hukou and danwei sector/ownership, as key institutions to facilitate the redistribution of resources and life chances among Chinese citizens, affect social interaction patterns.
Chinese hukou system requires all households to be registered in the locale where they reside and categorized as either agricultural or non-agricultural status since the 1950s. The system differentiates the agricultural and the non-agricultural registered permanent residence strictly, resulting in the forming of the dual structure in Chinese urban and rural economy. The majority of the population with agricultural hukou confined in the countryside, their occupation is “Agriculture, forestry, animal husbandry, fishing and water conservancy staff (5).”Wu (2011) found that agricultural hukou origin significantly decreased one’s educational attainment and chances of joining the Communist Party. Large disparities in schooling and income between agricultural and non-agricultural hukou holders remain even in the late reform period. (Hao et al., 2014). Farmer laborers live in the countryside and entitle to few of the rights and benefits that the socialist state conferred on urban residents, thus creating not only a spatial stratification between the countryside and the cities but also two unequal classes of Chinese citizens (Wu & Treiman, 2004).
In urban areas, the danwei give unequal socioeconomic status and life chances on workers in accordance (Walder, 1992; Whyte & Parish, 1984). Bian (1994) documented individuals’danwei attainment and associated socioeconomic benefits in urban China. Since the mid-1980s, because economic reform pushed state-owned enterprises into the market to compete, the gap in income and welfare between state-owned enterprises, collective enterprises and private enterprises has been decreasing. Wu (2013) showed that inequality persisted primarily between government agencies/public institutions and enterprises, even after taking individuals’ selectivity into account. It has made the job of the government agencies or public institutions have outstanding advantages in social stratification.
We also found that the scores and orders of some occupations differ greatly between the CAMSIS-China scale and other CAMSIS scales, such as Medical Doctors (221). It is possible that there are no unified standards and regulations for Medical Doctors from one society to another, and that Medical Doctors’ jobs have relatively more incumbents in China, with direct implications for the distribution of positions.
As measures that capture gradational inequality, CAMSIS-China scores offer a basic measure of social stratification for contemporary Chinese society. The CAMSIS-China scale measure performs quite reliably as a measurement option. Theoretically, the CAMSIS-China scale seems to offer a useful way to understand social inequality. At the time of writing this paper, the scales for the 34 countries were published on the CAMSIS project webpages. Empirically, the CAMSIS is among the most powerful occupation-based measures. The CAMSIS-China scale is expected to become the basis for research on changes in inequality in Chinese society.
Supplemental Material
sj-xlsx-1-sgo-10.1177_21582440231219064 – Supplemental material for Construction and Validation of a Social Stratification Scale: Cambridge Social Interaction and Stratification (CAMSIS) Scale for China in the 21st Century
Supplemental material, sj-xlsx-1-sgo-10.1177_21582440231219064 for Construction and Validation of a Social Stratification Scale: Cambridge Social Interaction and Stratification (CAMSIS) Scale for China in the 21st Century by Wangshu Sun and Xu Sun in SAGE Open
Footnotes
Appendices
The CAMSIS-China Scores and Four Typical Variables of the Major Groups.

| Major group | 1 | 2 | 3 | 4 | 5 | 6 | 7 | 8 | 9 |
|---|---|---|---|---|---|---|---|---|---|
| Males | |||||||||
| CAMSIS-China score | 58.72 | 69.27 | 58.77 | 61.29 | 53.23 | 14.63 | 43.21 | 48.93 | 41.96 |
| Education (%) | 42.84 | 74.86 | 43.63 | 52.40 | 18.10 | 0.64 | 6.57 | 6.67 | 3.76 |
| Income (%) | 78.17 | 82.93 | 71.80 | 69.77 | 56.10 | 17.00 | 49.81 | 58.58 | 32.10 |
| Prestige | 76.52 | 73.33 | 66.56 | 58.29 | 32.32 | 36.70 | 37.47 | 39.90 | 35.72 |
| Self-identified class (%) | 39.69 | 34.92 | 27.59 | 29.08 | 24.38 | 14.54 | 14.53 | 19.44 | 15.87 |
| Females | |||||||||
| CAMSIS-China score | 60.54 | 74.83 | 57.83 | 62.35 | 48.85 | 20.60 | 41.33 | 44.02 | 39.65 |
| Education (%) | 35.82 | 67.02 | 35.74 | 47.16 | 9.30 | 0.28 | 3.53 | 3.93 | 2.46 |
| Income (%) | 82.65 | 86.53 | 77.05 | 81.17 | 60.25 | 18.72 | 55.43 | 49.51 | 36.80 |
| Prestige | 73.54 | 68.51 | 64.76 | 58.42 | 31.20 | 36.55 | 34.65 | 33.72 | 32.92 |
| Self-identified class (%) | 33.38 | 37.27 | 27.83 | 27.83 | 19.86 | 14.73 | 18.94 | 17.74 | 15.00 |
Declaration of Conflicting Interests
The author(s) declared no potential conflicts of interest with respect to the research, authorship, and/or publication of this article.
Funding
The author(s) disclosed receipt of the following financial support for the research, authorship, and/or publication of this article: This work was supported by National Social Sciences Foundation (grant numbers: 22BTJ032); Social Science Planning Office of Liaoning Province (grant numbers: L21ZD039).
Supplemental Material
Supplemental material for this article is available online.
References
Supplementary Material
Please find the following supplemental material available below.
For Open Access articles published under a Creative Commons License, all supplemental material carries the same license as the article it is associated with.
For non-Open Access articles published, all supplemental material carries a non-exclusive license, and permission requests for re-use of supplemental material or any part of supplemental material shall be sent directly to the copyright owner as specified in the copyright notice associated with the article.