
Abstract
With the e-Government, the state-stakeholder relationship has gained a different dimension. This opened the door for public services that are participatory, affordable, transparent, efficient, quick, and flexible. The factors that affect the adoption and utilization of e-Government projects, which are implemented at significant expense, must be identified. Differences in acceptance and use of e-Government projects depend on country factors. Thus, this study aims to determine the factors affecting the acceptance and use of the Northern Cyprus E-Government Project by survey method. The study has a distinctive quality because there hasn’t been a thorough investigation in this area in Northern Cyprus. In addition, the data obtained at the end of the study will contribute to the literature on e-government applications and use in developing countries. The study was based on UTAUT and LISREL and SPSS package programs were used for data analysis. Structural equation models were used to analyze the findings in the study. The findings showed that every component had a positive impact on the participants’ intention to utilize. The major factors were found to be performance expectancy, effort expectancy, and trust in the Internet.
Plain Language Summary
With the e-Government, the state-stakeholder relationship has gained a different dimension. This opened the door for public services that are participatory, affordable, transparent, efficient, quick, and flexible. The factors that affect the adoption and utilization of e-Government projects, which are implemented at significant expense, must be identified. Differences in acceptance and use of e-Government projects depend on country factors. Thus, this study aims to determine the factors affecting the acceptance and use of the Northern Cyprus E-Government Project by survey method. The study has a distinctive quality because there hasn’t been a thorough investigation in this area in Northern Cyprus. In addition, the data obtained at the end of the study will contribute to the literature on e-government applications and use in developing countries. The study was based on UTAUT and LISREL and SPSS package programs were used for data analysis. Structural equation models were used to analyze the findings in the study. The findings showed that every component had a positive impact on the participants’ intention to utilize. The major factors were found to be performance expectancy, effort expectancy, and trust in the Internet.
Introduction
With the developments in information and communication technologies, change and transformation have become inevitable in every aspect of human life. As Postman said, technological changes are “Ecological” (Özçetin, 2019). Therefore, these changes have created a domino effect and occur in the form of changes in every field (political, social, economic and cultural) that make up the society. The idea of digital transformation, which is present in literature across a variety of fields—from business to international relations, from education to health, and even from literature to communication—serves to facilitate the coexistence of these different disciplines.
The increase in digital applications and the areas of use day by day has opened the doors of digital transformation. The fact that the current age is the information age and the society’s transformation into a digital society has necessitated the transfer of public services to the electronic environment. In order to ensure their sustainability, states have had to change their inefficient, bureaucratic, nepotistic, and excessively expensive (Tosun, 2014) structures. Essentially, the electronic state is the product of a new understanding of state, in which information and communication technologies are used, arising from increasing needs (Can & Eke, 2020). In the public administration literature, e-Government is shown as the concrete form of the digital transformation in the delivery of public services (Göçoğlu, 2020, p. 619). Financial investments are important in the development of e-Government systems. Therefore, it is necessary to take measures that may prevent its success. There are potential internal and external benefits from using e-Government. Along with these benefits, it is foreseen that there may be improvements in more efficient and transparent functioning and internal business processes (United Nations, 2008).
A number of problems are encountered in the implementation of e-Government. The Organization for Economic Cooperation and Development (OECD) identifies external barriers to e-Government adoption as legal and regulatory barriers, financial barriers, technological barriers and digital divide. Internal obstacles are stated as lack of cooperation, lack of plan and vision for uninterrupted services (Organisation for Economic Co-operation and Development, 2003). The factors necessary for the success of e-Government are development, management, institutional structure, technical infrastructure, human infrastructure and e-Government portal (S. Demir, 2019; Naralan, 2010; Yürük & Öztaş, 2017). There are many studies in the literature to determine the acceptance and use of the e-Government system (Azamela et al., 2022; Bhuasiri et al., 2016; Carter & Bélanger, 2005; Hammad et al., 2019; Khasawneh et al., 2013; Kurfalı et al., 2017; Lallmahomed et al., 2017; Lin et al., 2011; Lu & Nguyen, 2016; Mensah et al., 2017, 2018, 2020; Verkijika & De Wet, 2018; Zhao et al., 2019). In addition, considering the unique structure and cultural elements of each country, it is thought that every study made in this direction will contribute to the literature.
The problematic of this study is the examination of the E-Government Project implemented within the framework of digital transformation in Northern Cyprus. The study has a distinctive character because there hasn’t been a comprehensive study on the adoption and use of e-Government in Northern Cyprus. Therefore, it is thought that it will contribute to the literature on e-government applications and use in developing countries. In addition, the findings obtained at the end of the study are of great importance in terms of guiding the government officials and project managers who direct the Northern Cyprus e-Government policies, as well as informative publications about the project. In the light of all this information, within the framework of the aforementioned problematic and importance, this study aims to examine the acceptance and use of the large data-based e-Government project, which has many examples in the world and was created by making use of digital technologies, through Northern Cyprus case.
There are many theories and models in determining the factors affecting the adoption, acceptance and use of e-Government. However, with Venkatesh et al.’s creation of the Unified Theory of Acceptance and Use of Technology in 2003, which aims to determine the acceptance and use of information and communication technologies, UTAUT has begun to be preferred over the previously used theories and models in studies on the acceptance and use of e-Government (Çınar et al., 2018, p. 349). As Kurfalı et al. (2017) stated, the reason why this model is preferred among other theories is that it has a high percentage of behavioral variance (R2 of 70%) (p. 172). Therefore, in the study, UTAUT was used to determine the acceptance and use of Northern Cyprus e-Government applications.
According to the information obtained as a result of the meeting with the Chairman of the Northern Cyprus E-Government Executive Board, The Northern Cyprus E-Government Project and the development of the digital age understanding in the public sector started in 1999 to 2000 with small projects carried out by the Northern Cyprus government with its own budget. The Northern Cyprus E-Government Project’s gaining a corporate structure and the implementation of the Northern Cyprus E-Government Project were made possible by the protocol signed between the Republic of Turkey and Northern Cyprus in 2012. When the transition to e-Government started in 2012, the projects to be carried out within the scope of the Northern Cyprus E-Government Project were determined as three phases. Phase 1 includes the current situation and needs analysis, electronic document management system, electronic identity and electronic population projects were implemented. Phase 2 includes the electronic customs, electronic legal, electronic Ministry of National Education and spatial address registration system projects. Finally, in Phase 3, electronic health, electronic insurance, electronic government gateway and Northern Cyprus Joint Data Center projects were implemented (Yeldener, 2022).
In the following sections of the study, under the conceptual background section there are digital transformation and e-Government and Unified Theory of Acceptance and Use of Technology, the method of the study, the analysis methods used in the study, findings obtained as a result of the study, the discussion and the conclusion sections.
Although the study holds all limitations due to the nature of scientific research, it has the quality of contributing the gap arising from the absence of a comprehensive study at the state level in North Cyprus. As can be understood from that, it has been limited with data specific to Northern Cyprus. Accordingly, the analysis unit of the study consists of the e-Government Project, which is an (single) application that the country of Northern Cyprus has implemented within the framework of digital transformation, and an answer to the question of “At what stage is the acceptance and use of the Northern Cyprus E-Government Project by the citizens?” has been sought for.
Conceptual Background
Digital Transformation and E-government
Digital transformation is one of the leading and dominant concepts of recent years. Siebel (2022) defines digital transformation as the application of digital technologies to all areas of institutions, establishments or organizations. The most well-known name of digital transformation, which is known by many different names, is the fourth Industrial Revolution. The main elements of Industry 4.0 consist of big data, cloud computing, artificial intelligence and internet of things. On the other hand, digital transformation refers in part to large-scale disruption and constant change (pp. 31–39).
Significant changes and developments in ICT, which forms the basis of digital transformation, have brought radical changes in human life, both socially, politically, and economically. At the end of the 20th century, societies connected by networks with the important developments in ICT began to be called “Information Society” (Tosun, 2014, p. 47). The main element that draws attention in the concept of information society, which started to be used after the second half of the 20th century, is information (Çelik, 1998, p. 54). It is important that the information obtained here is used in a way that creates added value. Again, at the end of the 20th century, with the widespread use of information and communication technologies, the concepts of space and distance disappeared and a global convergence and communication began to be achieved. As Georgiadou (1995) stated, Marshall McLuhan foresaw the realities of today and introduced the “Global Village” theory in the mid-1960s. Digital transformation has brought about changes in the political field as well as in every field, and the formation of an information society, the flexibility of production, the globalization of the world, the transition to post-modernist thought, the conditions of being feasible and legitimacy of the administration have been eroded (Özer, 2006). The development of the new public administration approach, the introduction of the internet to the service of humanity, the formation of the information society, the emergence of the concept of governance are the most important developments that took place at the end of the 20th century, which had a great impact on the restructuring process of the state. One of the main elements of these developments is the e-Government phenomenon, as A. Yılmaz and Bozkurt (2014, p. 295) have stated. Although electronic government projects, whose purpose is to provide electronic information and services to citizens and businesses, started to be used in the late 1990s (Chen & Gant, 2001, pp. 343–344), the concept of e-Government was first used in the National Performance Survey held in the USA in 1993 (Maraş, 2011, p. 122). In other words, e-Government is a restructuring model that can meet the needs of the information society and provide transparency, development and efficiency with the strategic use of ICT in government administration (Kuran, 2005). The basic elements of e-Government are listed as e-citizen, e-company/business and e-institution (Demirel, 2006, p. 85). There are three components required for government services to be carried out electronically: communication devices, communication channels and websites (Naralan, 2014, p. 6). When the e-Government interaction areas are examined, studies that gather under three headings (Erdal, 2004; Kahraman, 2014; Yıldız, 2011) gives these areas as Government-Government (G2G), Government-Citizen (G2C), and Government-Business (G2B). On the other hand, studies that gather the interaction areas of e-Government under four headings (Acar, 2018; Pourmousa, 2017; Şataf et al., 2014; Yıldırım, 2018) gives these areas as Government-Government (G2G), Government-Citizen (G2C), Government-Business (G2B), and Government-Employee (G2E).
In the “E-Government Development Index (EGDI)” report published by the United Nations (2020), the three most important dimensions of e-Government, scope and quality of online services as Online Services Index (OSI), state of development of telecommunications infrastructure or Telecommunications Infrastructure Index (TII), and natural human capital or Human Capital Index (HCI) were assessed and the top 14 leading countries in e-Government development are presented (Önal, 2020). Accordingly, the top 14 EGDI rankings of 2020 are; Denmark, Republic of Korea, Estonia, Finland, Australia, Sweden, United Kingdom, New Zealand, USA, Netherlands, Singapore, Iceland, Norway, and Japan (United Nations, 2020, pp. 11–12).
The studies based on UTAUT in the acceptance and use of e-government are given in Table 1 below.
Studies Based on UTAUT in E-Government Acceptance and Use.

Considering the other models utilized in e-Government acceptance and use other than UTAUT, it is seen that, generally, Technology Acceptance Model-TAM is preferred (Çabuk et al., 2017; Lin et al., 2011; Mensah et al., 2017, 2018), and in some studies, TAM and Diffusion of Innovation–DOI’nin (Carter & Bélanger, 2005) or TAM and Theory of Planned Behavior–TPB’nin (Hammad et al., 2019) are unified and used. However, in some studies, on the other hand, it is seen that only Social Cognitive Theory-SCT (Zhao et al., 2019), Theory of Planned Behavior-TPB (Azamela et al., 2022) or Unified Model of Electronic Government Adoption–UMEGA, which is an extension of Unified Theory of Acceptance and Use of Technology-UTAUT (Mensah et al., 2020; Verkijika & De Wet, 2018) is preferred.
Unified Theory of Acceptance and Use of Technology
The Unified Theory of Acceptance and Use of Technology was created by Venkatesh et al. (2003) to identify and analyze the adoption and use of new systems (Venkatesh et al., 2003). In the survey conducted on UTAUT, it was determined that the studies (Avcı & Çakır, 2020; Bozhüyük, 2020; Çark & Marşap, 2019; Czerwinska, 2020; E. B. K. Demir & Akbulut, 2017; Kandemir, 2020; Kurfalı et al., 2017; Kurtagıć & Altuna, 2019; Liebenberg et al., 2018; M. B. Yılmaz & Kavanoz, 2017) generally aimed to explain the evolution of technology adoption models and theories or to analyze and measure the behavior of individuals toward technological innovations in different fields. While creating this theory, Venkatesh et al. (2003) utilized eight different models and theories: Theory of Reasoned Action (Fishbein & Ajzen, 1977), Theory of Planned Behavior (Ajzen, 1991), Diffusion of Innovation (Rogers, 2003) and Technology Acceptance Model (Davis et al., 1989), in addition Social Cognitive Theory (Compeau & Higgins, 1995), Model of PC Utilization (Thompson et al., 1991), Motivational Model (Davis et al., 1992) and Combined TAM and TPB (Taylor & Todd, 1995). Venkatesh et al., to formulate UTAUT, formulated a unified model based on the conceptual and empirical similarities between the models (F. Gürses, 2017; Im et al., 2011; Venkatesh et al., 2003; M. B. Yılmaz & Kavanoz, 2017). The Unified Theory of Acceptance and Use of Technology has a more inclusive feature than all previous theories. A visualized version of the Unified Theory of Acceptance and Use of Technology is presented in Figure 1 below.

Unified theory of acceptance and use of technology.
Factors in UTAUT that are claimed to affect intention and behavior are effort expectation, performance expectation, facilitating conditions, and social impact. Accordingly, performance expectation is defined as the degree to which people believe that there are gains (job performance) that they will obtain when they use the system. Effort expectation is expressed as the degree of perceived ease of use of the system by individuals. Social impact, on the other hand, indicates the perception of other individuals that is important to an individual about their use of the new system. Finally, the facilitating factors describes the state of believing that institutions, organizations or groups from which people can get help while using the system, technically or organizationally, and are represented in other models as perceived behavioral control, facilitating conditions and compliance (Venkatesh et al., 2003).
Method
The government of Northern Cyprus aims to provide its services to citizens through e-Government in an easy and effective, fast, uninterrupted and safe way, with high quality. In line with this, with e-Government understanding, which has started to replace the bureaucratic and classical government understanding, it is aimed to provide easy access to every government institution and to the systems that use each individual’s information technologies and government institutions and organizations and the services that are provided by these institutions. Starting from this, the following hypotheses have been tested in the research.
Khasawneh et al. (2013) and Carter and Bélanger (2005), in their studies, argue that the factors of trust in the Internet and trust in the government are significantly effective in the intention of using e-Government services. In this context, the first and second hypotheses of the study have been determined as follows; H1: The level of trust of the participants to the Internet positively affects their intention to use it, and H2: The level of trust of the participants in the government positively affects their intention to use e-Government. In addition, Kurfalı et al. (2017) thinks that the factor of performance expectation is effective in the intention of using e-Government services. Thus, after the first two hypotheses the following five hypotheses have been determined as follows.
H3: The level of trust of the participants in the internet positively affects their performance expectation.
H4: The level of trust of the participants in the government positively affects the performance expectation.
H5: The performance expectation levels of the participants positively affect their intention to use e-Government.
H6: Performance expectation has a mediating role in the effect of participants’ trust in the internet levels on their intention to use e-Government.
H7: Performance expectation has a mediating role in the effect of participants’ trust in the government on their intention to use e-Government.
In the study of A. G. D. F. Gürses and Çınar (2017), it is emphasized that effort expectancy and social impact factors positively affect the intention to use e-Government. In line with this, the eighth and ninth hypotheses of the study have been determined as follows; H8: The effort expectancy levels of the participants positively affect their intention to use e-Government and H9: The social impact levels of the participants positively affect their intention to use e-Government. Bhuasiri et al. (2016), on the other hand, focuses on the facilitating condition factor, which is thought to affect the intention to use e-Government. Accordingly, hypothesis 10 has been determined as follows; H10: Facilitating condition perceptions of the participants positively affect their intention to use e-Government.
Science and Technology Studies Approaches to Internet Research (Monberg, 2005), which is among the Modern Methods, discusses the relationship of micro and macro-scale rapid changes and new regulations related to power class and culture with new communication technologies. Although the main scope of the study consists of e-Government portal, which can be considered as a new communication technology, since Northern Cyprus has been addressed as the study area, UTAUT was preferred in the light of the acceptance of innovation paradigm instead of rapid change. Table 2 and Table 3 summarizes ranges of criteria credibility and distiribution of participants’ demographic variables.
Ranges of Fit Criteria Used in the Study.

Distribution of Participants’ Demographic Variables.

In this study, which aims to examine the acceptance and use of the Northern Cyprus E-Government Project, which was implemented within the framework of digital transformation in Northern Cyprus, the questionnaire, which is one of the quantitative research methods, was used as a data collection tool. Factors that are claimed to affect intention and behavior in e-Government acceptance and use, and which will be tested with a questionnaire are facilitating conditions (n = 4), trust in the internet (n = 5), intention to use (n = 4), social impact (n = 4), trust in the state (n = 4), performance expectation (n = 4) and effort expectation (n = 3). In the study, UTAUT, which is frequently used in determining the acceptance and use of ICT and created by Venkatesh et al. (2003), was taken as a basis. In addition, the questionnaires used in the studies of Kurfalı et al. (2017) and Khasawneh et al. (2013) about e-Government acceptance factors, which used UTAUT by adapting it to their studies and adopted e-Government services in Turkey, were also used while creating the questionnaire. There are 34 questions in total in the questionnaire. While six of these questions were about the demographic information of the participants, 28 of them were arranged for the e-Government acceptance and use scale. In addition, a 5-point Likert scale was used in the study and the survey data were collected between April 01 and July 31, 2022.
In the study, while the population was determined as those who use e-Government living in Northern Cyprus between the ages of 18 and 75, the sample was determined as the people who use the EBYS (electronic document management system), E-Health, E-Insurance, E-Tax, E-Vehicle Registration, and E-MEB (electronic portal of Ministry of National Education) applications of the Northern Cyprus E-Government Project in a way that serves the purpose. A questionnaire was applied to the people determined by random sampling method among these people. The sample number was determined as 400, but 392 questionnaires were included in the study. Considering the current development stage of the Northern Cyprus e-Government Project, a large part of the survey participants are public servants who are obliged to use e-Government applications, as they are the most likely users of e-Government services and the most appropriate sources to get immediate feedback. Although public employees who are obliged to use e-Government applications are limited in terms of representing the findings of the study, users who already use the e-Government application in the light of the information obtained from the Northern Cyprus e-Government Executive Board are the public employees in question. Therefore, the sample of the study is representative due to the power of preliminary information to both the authorities and researchers in terms of acceptance and use of e-Government by the citizens. Therefore, the voluntariness factor in UTAUT was removed from the scale. The survey was collected face-to-face and online between April 13th and July 31st, 2022.
Analysis Methods
LISREL and SPSS package programs were used for the analysis of the data obtained in the study. Significance levels were accepted as p = .05 and .01 in the analyses and the reliability and validity of the scales used in the research were examined first. The reliability levels of the scale used in the research were calculated with the internal consistency method and the Cronbach Alpha reliability criterion was used. Then, the item-total correlation was determined and the change in Cronbach Alpha values in case of deletion of any scale item was examined. In order to test the validity of the scale, exploratory and confirmatory factor analyzes were performed, respectively. There are various fit indices used to determine the fit of the model in CFA. In this study, along with the Chi-square goodness of fit index, fit criteria such as IFI, CFI, RMSEA, GFI, RMR were taken into account (Schermelleh-Engel & Moosbrugger, 2003). Structural equation models were used to analyze the results of the research hypotheses. Normal distribution analyses and central tendency measurements were used to examine the distribution of the data obtained within the scope of the research, and the participation levels of the participants in each measurement were examined with the mean and standard deviation values. In order to examine the demographic and diversity characteristics of the participants, in addition to frequency and percentage analysis, independent sample t-test for groups of 2 and one-way ANOVA analysis for groups of more than two were used to compare the diversity characteristics with measurement tools.
Findings
In this part of the study, the demographic findings obtained from the participants, the results of the reliability and validity analysis of the scale used in the research, the descriptive statistics of the variables and the results of the research hypotheses are included.
Findings on Demographic Characteristics
The findings regarding the demographic characteristics of the participants are presented in the tables below.
When the demographic characteristics of the participants included in the study are examined, while it was determined that 58.9% of the participants were female, 41.1% were male, 26.5% were in the 25 to 34 age range, 38.8% were 35 to 44, 28.8% were 45 to 54, 5.9 of them were 55 years old or over, the majority of the participants were undergraduate graduates with a rate of 53.8% (n = 211). It was determined that 42.1% of the participants lived in Nicosia, 12.5% in Famagusta, 36.5% in Kyrenia, and 8.9% in other districts such as Güzelyurt, Iskele, Lefke. It was determined that 14.5% of the participants used the internet between 3 and 10 year, 85.5% of them used the internet for >10 year, 12% of them used a computer between 3 and 10 year and 88% of them used a computer for >10 year.
Findings on the Validity and Reliability of the Acceptance and Use of E-government Scale
The results of item analysis, reliability levels and explanatory factor analysis results regarding the validity and reliability of the scale for acceptance and use of e-Government are given in Table 4. It is expected that the relationship between the items in the scale and the other items should not be <0.30 (Büyüköztürk, 2009).
Reliability, Explanatory Factor Analysis and Item Analysis Results of the Acceptance and Use of E-Government Scale.

As it is seen in Table 4, it was decided that there was no need to remove an item from the scale, since the correlation value of the items in the scale with the other items was <.30. The reliability level of the scale was determined high (C.Alpha = .973). Prerequisites for factor analysis were examined. In the first of these conditions, Barlett Sphericity tests were used to examine the existence of the relationship between KMO and variables in order to decide whether the number in the data is sufficient for factor analysis (Tabachnick & Fidel, 2014). In Table 4, the KMO value was found to be >0.60 and the Barlett sphericity test was significant (p < .01). According to these results, it is proved that the sample data is suitable for factor analysis and that the data obtained comes from a multivariate normal distribution (Kan & Akbaş, 2005).
In order to decide whether to leave an item in the scale, the criterion of having a factor load value of >0.45 was used (Büyüköztürk, 2009). Items 11, 12, and 20 in the scale were excluded from the scale because their factor loads were low and item-scale correlations were below .30. As a result of the factor analysis, it was determined that the scale had a structure with seven factors and the total variance value it explained was 90.042% and this value was quite high. Because the scale was more than a single factor, “varimax” vertical rotation was performed.
According to Table 4, when the items/statements collected under the factors examined, the factors have been named “Facilitating Conditions,”“Trust in the Internet,”“Intention to Use,”“Social Impact,”“Trust in the State,”“Performance Expectation,” and “Effort Expectation,” respectively. When the reliability levels of the factors were examined, it was determined that the reliability coefficient (α = .959) of the facilitating conditions dimension was high, and this factor alone explains 18.288% of the scale. The reliability coefficient (α = .954) of the trust in the internet dimension was determined to be at a high level, and this factor alone explains 16.941% of the scale. The reliability coefficient (α = .988) result of the intention to use dimension was determined to be at a high level, and this factor alone explains 15.324% of the scale. The reliability coefficient (α = .949) result of the social impact dimension was determined to be high, and this factor alone explains 15.024% of the scale. The reliability coefficient (α = .933) result of the trust in the state dimension was determined to be at a high level, and this factor alone explains 13,240% of the scale. The reliability coefficient (α = .952) result of the performance expectation dimension was determined to be at a high level, and this factor alone explains 6.706% of the scale. The reliability coefficient (α = .972) result of the effort expectation dimension was determined to be at a high level, and this factor alone explains 4.519% of the scale.
Confirmatory Factor Analysis Results of the Acceptance and Use of E-government Scale
Confirmatory factor analysis was performed to determine whether the explained factor structure of the scale was confirmed or not. The path diagram of the CFA of the scale is presented in Figure 2.
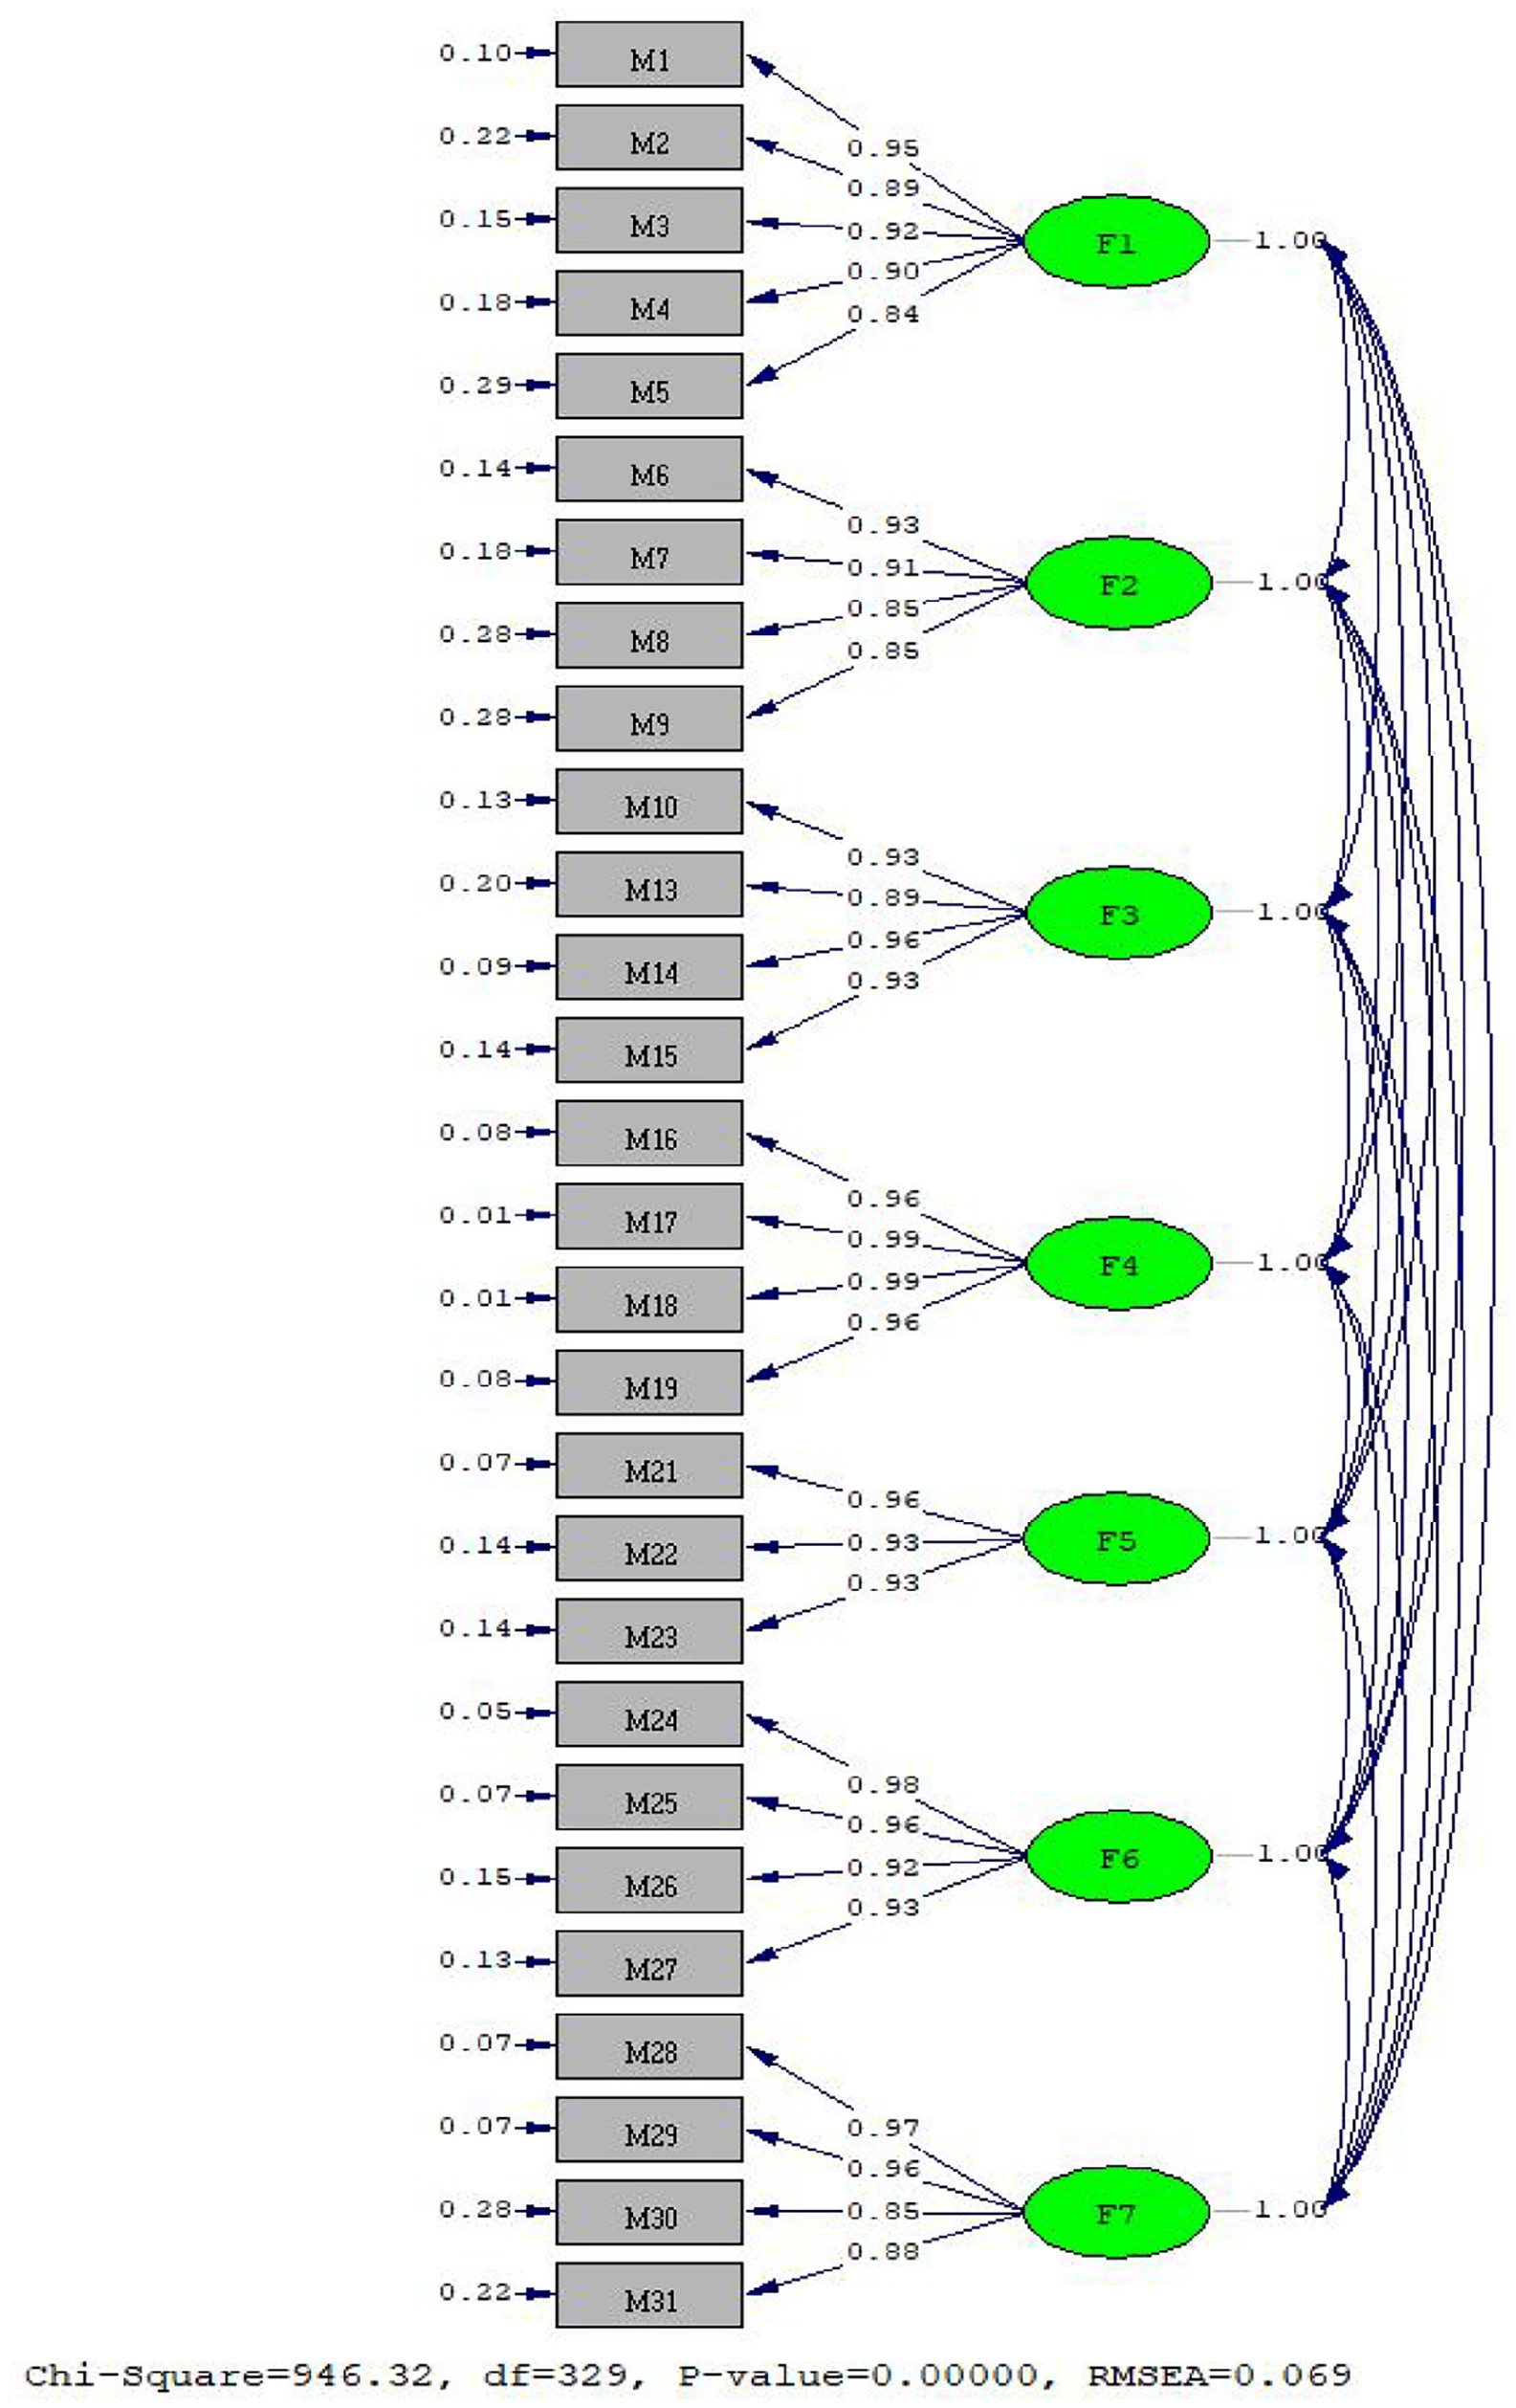
CFA path diagram of e-government acceptance and use scale.
When Figure 2 is examined, it is seen that the factor load values of the items are between 0.84 and 0.99 according to the CFA findings of the measurement tool. These values are the accepted values for the factor load limits. It was determined that the correlations between the items and latent variables were significant (t > 2.58). The t-values of the path diagram are given in Figure 3.
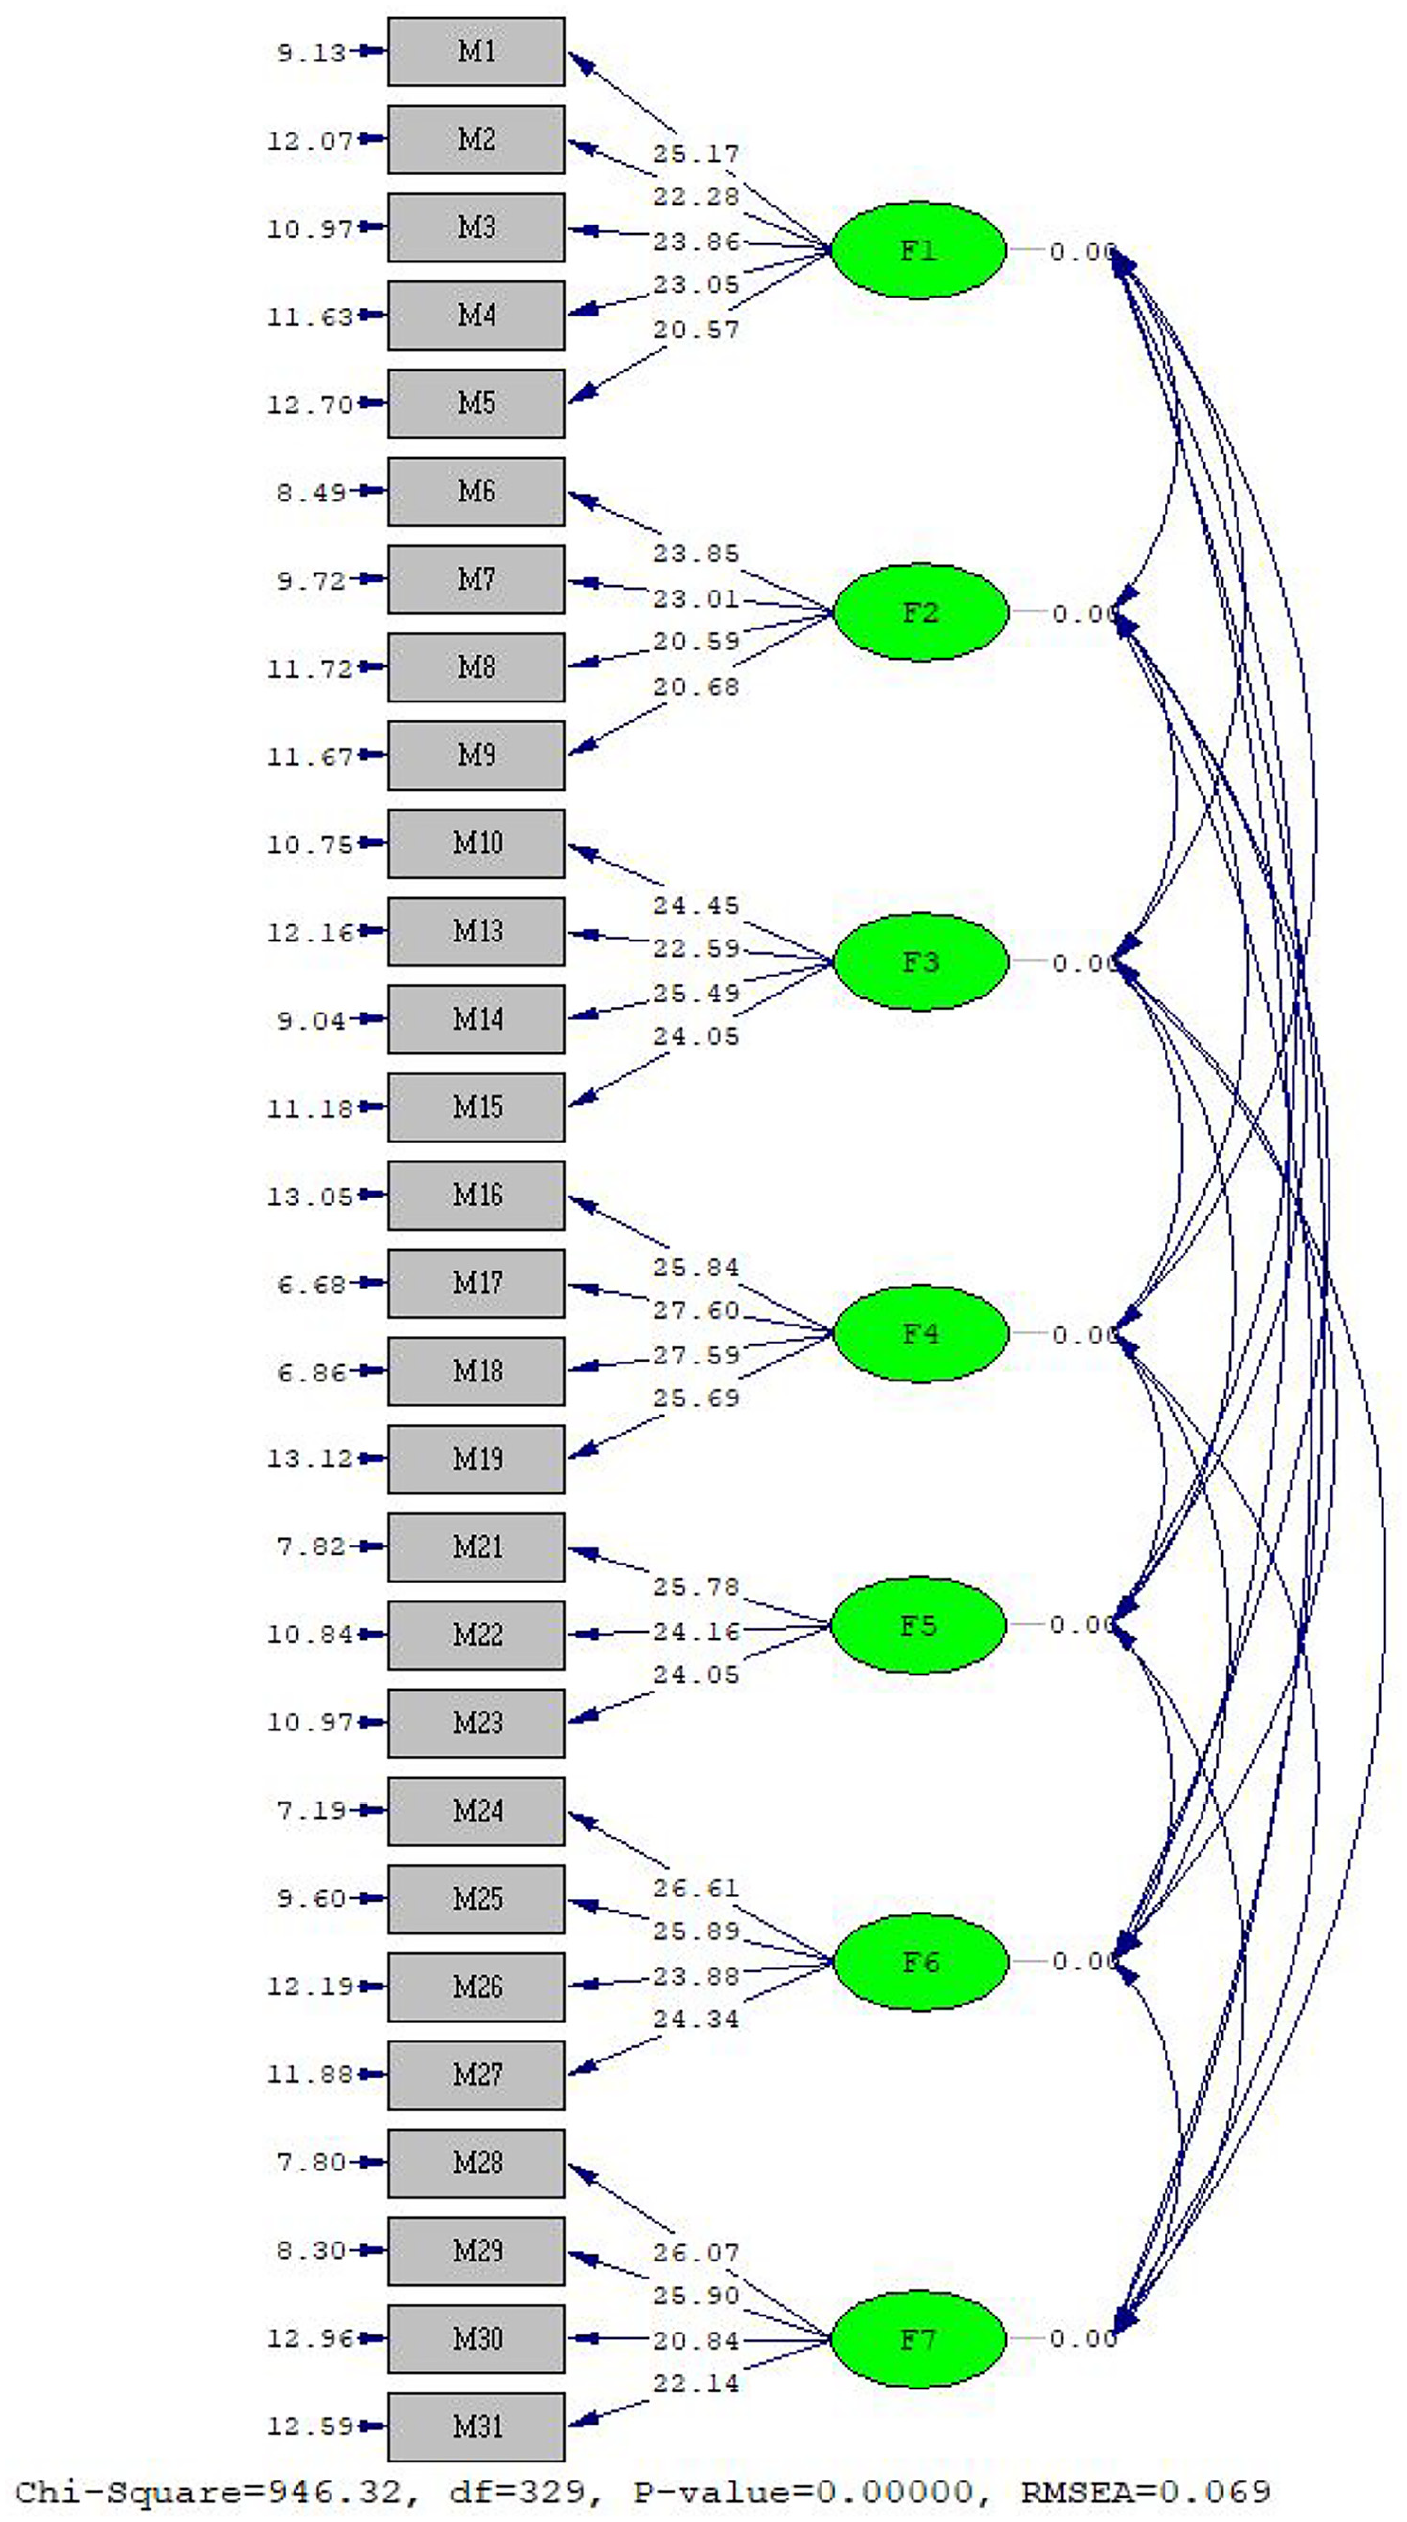
T-values of CFA path diagram of acceptance and use of e-government scale.
When the path diagrams were examined, it was not necessary to make any modifications between the items. It was determined that the t-value of all items in the scale was >2.58, therefore, the effects of factor loadings of all items on the scale dimensions were significant at the 99% confidence level. The results of the fit indices obtained as a result of CFA are shown in Table 5.
Acceptance and Use of E-Government Scale Goodness-of-Fit Values.

In the study, firstly, Root Mean Square Error of Approximation (RMSEA) was examined for e-Government acceptance and use scale goodness of fit values. Then, Comparative Fit Index (CFI), Goodness-of-fit Index (GFI), Adjusted Goodness of Fit Index (AGFI), Non-Normed Fit Index (NNFI), Normed Fit Index (NFI), Rock Mass Rating (RMR), and Standardized Root Mean Squared Residual (SRMR) was examined.
For a model to be acceptable as a whole, the reported goodness-of-fit indices must be within acceptable or excellent fit limits. When the fit criteria values obtained as a result of CFA were examined, it was determined that the ratio of the X2 value to the df value was at the perfect fit level with 2.876, the RMSEA value with 0.069 at the acceptable fit level, and the other fit values were included in the perfect and acceptable fit values. This result shows that the explained factor structure is confirmed.
The reliability of the measurement model was tested by looking at the average variance explained (AVE) and combined reliability (CR) values. Since the CR value in Table 6 was determined above the threshold value of 0.70 and the AVE value above the threshold value of 0.50, it was determined that the reliability and convergent validity of the measurement model were ensured.
AVE and CR Values of the Dimensions of the Acceptance and Use of E-Government Scale.

Results of the Research Model and Hypotheses
The model established in accordance with the purpose of the research and the hypotheses related to the model are given below.
The hypotheses established in accordance with the research model examined in Figure 4 are given below. Structural equation modeling was used to test the hypotheses. The hypotheses tested in the study are as follows:

Research model.
When Table 7 is examined, it was determined that the relations between the dimensions of E-Government acceptance and use of the participants included in the study were positive and significant (p < .01). It was determined that the highest relationship was between performance expectation and effort expectation with 0.876 (r = .876), while the lowest relationship was found between trust in the government and social impact with 0.292.
Relationship Results Between Research Variables.

p < .01.
Findings of the First Model of the Study
The SEM analysis path diagram of the model, in which the first and second hypotheses of the research, the levels of trust in the internet and the state of the participants, have a positive and significant effect on their intention to use, are given in Figure 5, and the statistical values of the analysis results are given in Table 8.
Path diagram of the effect of trust in internet and trust on government on intention to use.
SEM Results of the First and Second Hypotheses of the Study.

p < .01.
When the first model of the study was examined, it was determined that the first model had acceptable fit with X2/df = 4.588 and acceptable fit with RMSEA = 0.083. When the other fit indices of the model were examined, it was determined that these fit values, which were determined as CFI = 0.99, GFI = 0.92, AGFI = 0.90, NNFI = 0.98, NFI = 0.98, RMR = 0.067, SRMR = 0.057, were also within the limits of acceptance and perfect fit. The results of the research hypothesis are given in Table 8.
When Table 8 is examined; the effect of trust in the internet, which is the first hypothesis of the research, on the intention to use was found to be statistically significant (t = 12.46 > 2.58). This result indicates that when there is a 1 unit increase in the participants’ levels of trust in the Internet, there will be an increase of 0.54 in their intention to use.
The effect of trust in the state, which is the second hypothesis of the research, on intention to use was found to be statistically significant (t = 6.42 > 2.58). This result indicates that when there is a 1 unit increase in the participants’ level of trust in the state, there will be an increase of 0.28 in their intention to use.
Findings of the Third, Fourth, and Fifth Hypotheses of the Study
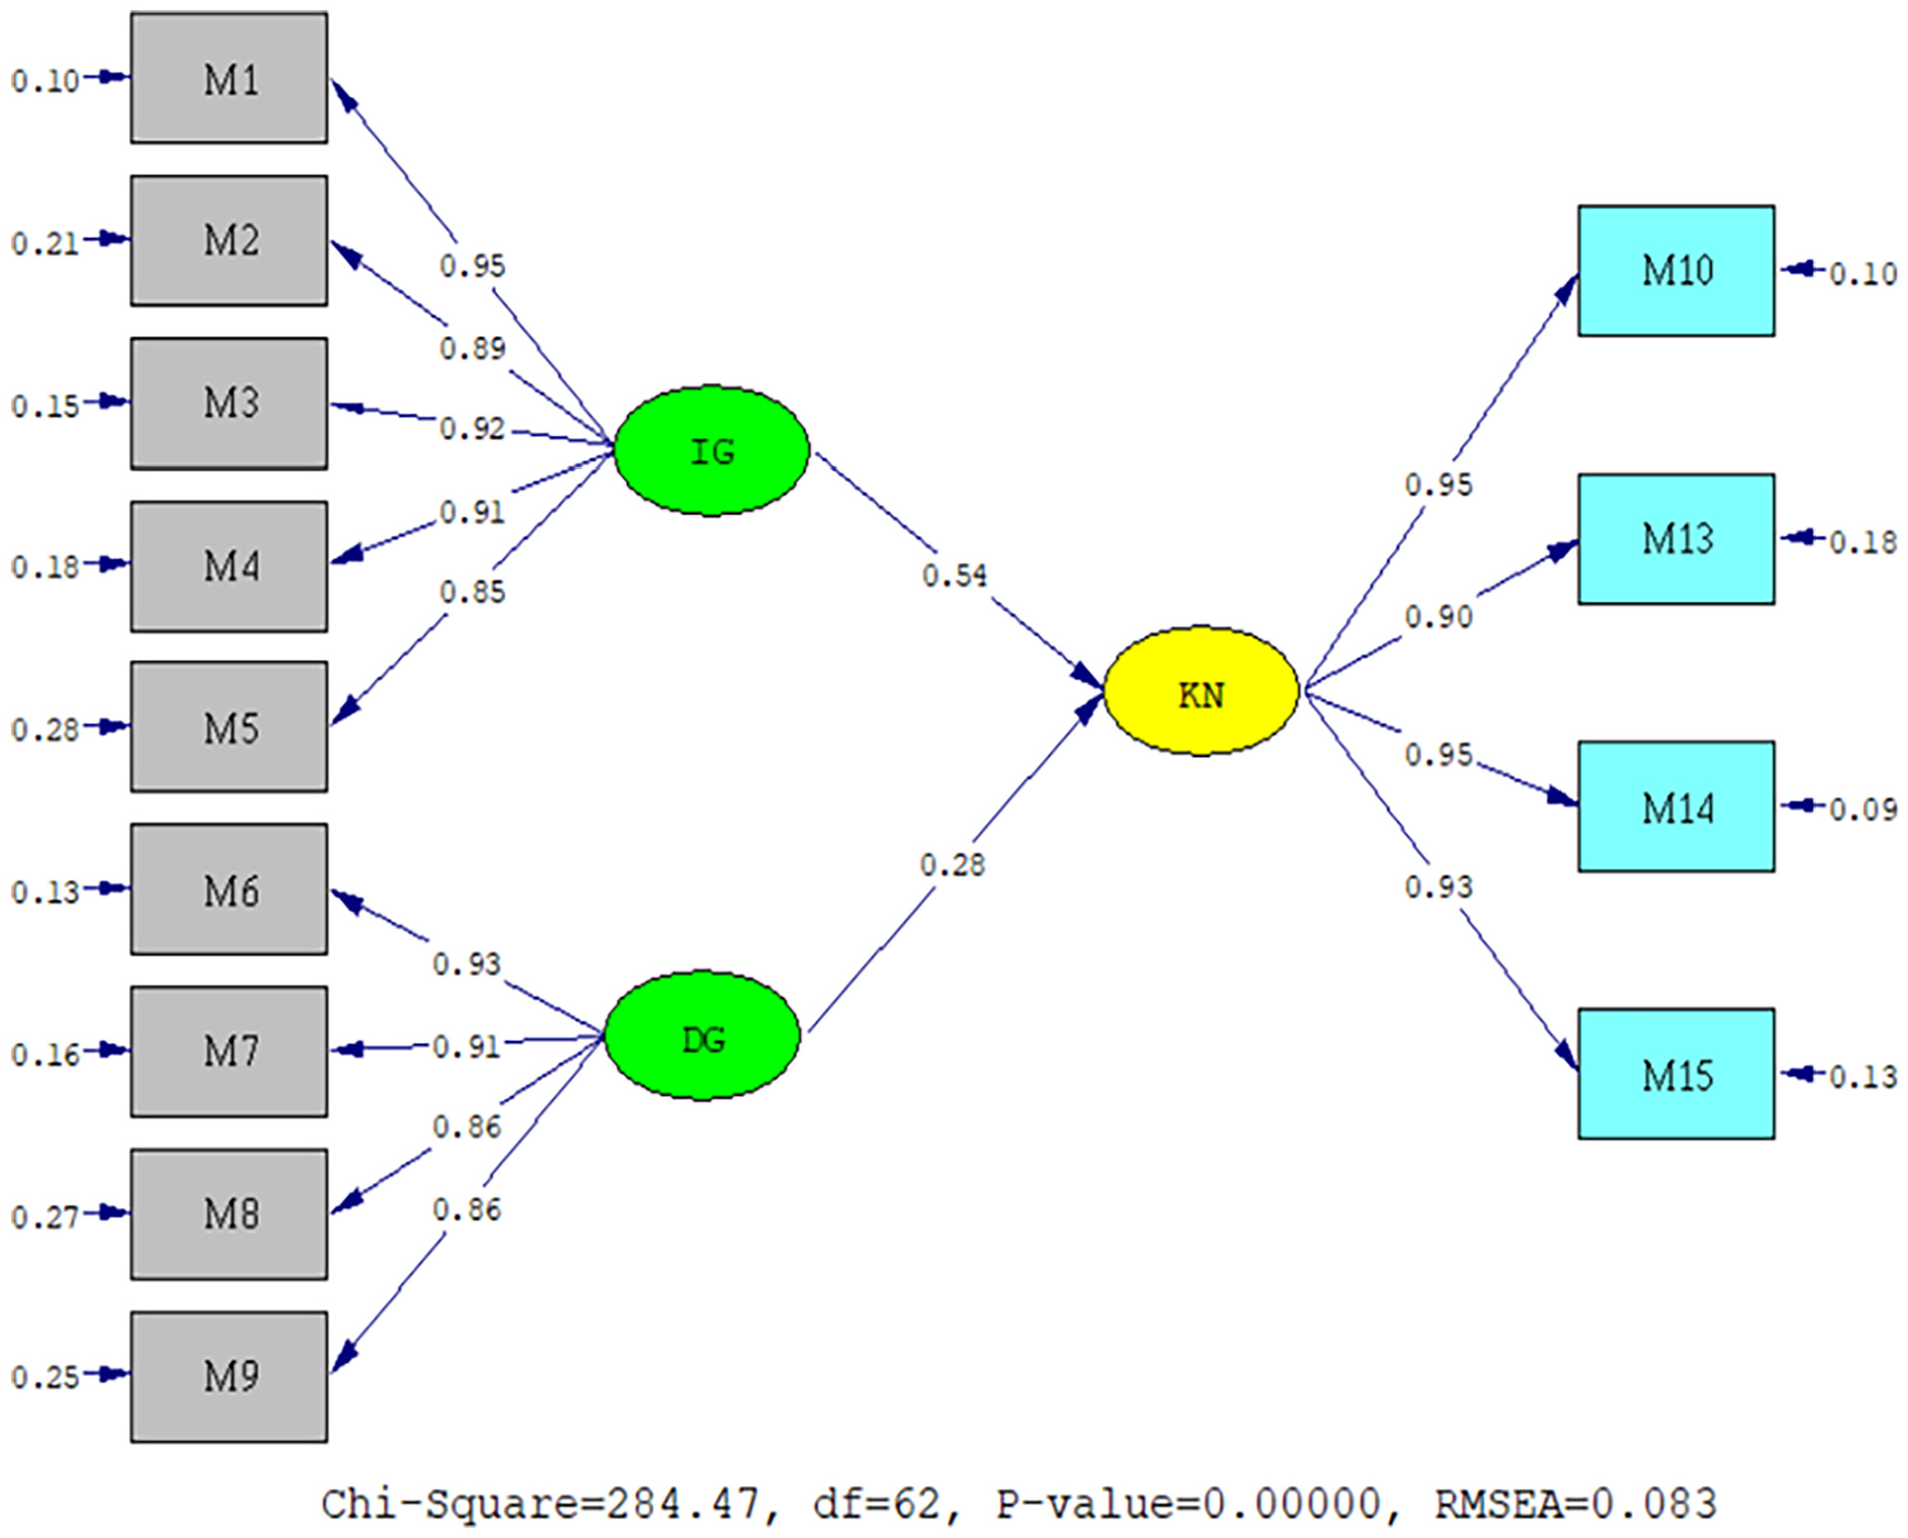
The SEM analysis path diagram of the model in which the third hypothesis of the research, whether the levels of trust in the internet have a positive and significant effect on the performance expectation, the fourth hypothesis, which is the level of trust in the state, has a positive effect on performance expectation, the positive effect of performance expectation levels and intention to use, which is the fifth hypothesis were determined is given in Figure 6, and the statistical values of the analysis results are given in Table 9.

Path diagram of the third, fourth, and fifth hypotheses of the research.
SEM Results of the Third, Fourth, and Fifth Hypotheses of the Research.

p < .01.
When the second model of the study was examined, it was determined that the second model had acceptable fit with X2/df = 3.763 and acceptable fit with RMSEA = 0.080. When the other fit indices of the model were examined, it was determined that CFI = 0.99, GFI = 0.92, AGFI = 0.91, NNFI = 0.98, NFI = 0.98, RMR = 0.079, SRMR = 0.065, and these fit values were found to be within the limits of acceptance and perfect fit. The results of the research hypothesis are given in Table 9.
When Table 9 is examined; The effect of trust in the internet, which is the third hypothesis of the research, on performance expectation was found to be statistically significant (t = 12.36 > 2.58). This result indicates that when there is a 1 unit increase in participants’ levels of trust in the internet, it will cause an increase of 0.52 in their performance expectation levels.
The effect of trust in the state, the fourth hypothesis of the study, on performance expectation was found to be statistically significant (t = 6.72 > 2.58). This result indicates that when there is a 1 unit increase in the trust levels of the participants in the government, it will cause an increase of 0.29 in their performance expectations.
The effect of performance expectation, which is the fifth hypothesis of the research, on intention to use was found to be statistically significant (t = 27.21 > 2.58). This result indicates that when there is a 1 unit increase in the performance expectations of the participants, it will cause an increase of 0.88 in their intention to use.
Findings on the Mediation Effect
The sixth and seventh hypotheses of the research are “Performance expectation has a mediating role in the effect of participants’ trust in the internet levels on their intention to use” and “Performance expectation has a mediating role in the effect of participants’ trust in the state on their intention to use.”
When the mediation model of the research was examined, it was determined that the first model had acceptable fit with X2/df = 3.350 and acceptable fit with RMSEA = 0.079. When the other fit indices of the model were examined, it was determined that CFI = 0.99, GFI = 0.92, AGFI = 0.90, NNFI = 0.98, NFI = 0.99, RMR = 0.064, SRMR = 0.054, and these fit values were also found to be within the limits of acceptance and perfect fit. The results of the mediation hypotheses of the research are given in Table 10.
Effect Coefficients of the Mediation Hypothesis of the Research.

p < .01.
When Figure 7 and Table 10 are examined, it was determined that the effect of trust on the internet on the effect of performance expectation continues to be significant (t = 12.60 > 2.58) in order to examine the mediating role in the sixth hypothesis (t = 12.60 > 2.58) and at the same time, it was determined that the effect of performance expectation on intention to use continued to be significant (t = 17.03 > 2.58).

Path diagram of the mediator role of performance expectation in the effect of trust in the internet and trust in the state on intention to use.
It was determined that the effect on the effect of trust in the state on performance expectation continued to be significant (t = 7.06 > 2.58) in order to examine the mediating role in the seventh hypothesis, and at the same time, it was determined that the effect of performance expectation on intention to use continued to be significant (t = 17.03 > 2.58).
According to Baron and Kenny (1986), since, in order to talk about mediation, it is necessary to look at the first model in which the effect of the independent variable, in which there is no mediating variable, on the dependent variable, as a result of model 1 given in Figure 5, it was determined that the effect of trust in the internet on intention to use was 0.54 (t = 12.46 > 2.58), and the effect of trust in the state on intention to use was 0.28 (t = 6.42 > 2.58).
As a result of the inclusion of the mediator variable in the model, when the model in Figure 7 was examined, it was determined that the effect of internet trust on the intention to use was 0.11 (t = 3.06 > 2.58). Normally, the effect of trust in the internet on intention to use is 0.54, whereas when the mediator variable is included in the model, this effect continues to be significant, but decreases to 0.11, so partial mediation exists and the sixth hypothesis of the study was accepted.
As a result of the inclusion of the mediator variable in the model, when the model in Figure 7 was examined, it was determined that the effect of trust in the state on the intention to use was 0.19 (t = 5.26 > 2.58). Normally, the effect of trust in the state on intention to use was 0.28, whereas when the mediator variable is included in the model, this effect continues to be significant, but decreases to 0.19, so partial mediation exists and the seventh hypothesis of the study was accepted.
Findings of the Eight, Nine, and Tenth Hypotheses of the Research
The SEM analysis path diagram of the model in which it was determined whether the effort expectation levels have a positive and significant effect on the intention to use, which is the eighth hypothesis of the research, whether the social impact has a positive effect on the intention to use, which is the ninth hypothesis, and positive effect of facilitating conditions levels on the intention to use, which is the tenth hypothesis, is given in Figure 8, and the statistical values of the analysis results are given in Table 11.

Path diagram of the third, fourth, and fifth hypotheses of the research.
SEM Results of the Eighth, Ninth, and Tenth Hypotheses of the Research.

p < .01.
When the fourth model of the study was examined, it was determined that the fourth model had acceptable fit with X2/df = 3.648 and acceptable fit with RMSEA = 0.082. When the other fit indices of the model were examined, it was determined that CFI = 0.99, GFI = 0.91, AGFI = 0.90, NNFI = 0.98, NFI = 0.98, RMR = 0.045, SRMR = 0.031 and it was determined that these fit values were within the limits of acceptance and perfect fit. The results of the research hypothesis are given in Table 11.
When Table 11 was examined, the effect of effort expectations, which is the eighth hypothesis of the research, on intention to use was found to be statistically significant (t = 8.69 > 2.58). This result indicates that when there is a 1 unit increase in the effort expectation levels of the participants, it will cause an increase of 0.57 in their intention to use.
The effect of social impact, which is the ninth hypothesis of the research, on intention to use was found to be statistically significant (t = 3.09 > 2.58). This result indicates that when there is a 1 unit increase in social impact levels, it will cause an increase of 0.10 in the levels of intention to use.
The effect of facilitating condition perceptions, which is the tenth hypothesis of the study, on intention to use was found to be statistically significant (t = 4.48 > 2.58). This result indicates that when there is a 1 unit increase in social facilitating conditions, it will cause an increase of 0.26 in the levels of intention to use.
Discussion
Carter and Bélanger (2005) in their study concluded that the factors of trust in the internet and the government have a positive effect on the adoption of e-Government. This result is consistent with the findings obtained as a result of our study. Accordingly, trust in the internet and trust in the government factors have a positive effect on the intention to use it. Therefore, Northern Cyprus government officials or project managers should take measures to ensure the reliability of the internet and inform users of the measures taken in this direction. In addition, the perception that the government has the ability to provide effective public services through e-Government is considered important in terms of trust in the government.
Kurfalı et al. (2017), in their study, determined that performance expectation is effective on the intention to use e-Government. They also concluded that the factors of trust in the internet and trust in the government have a positive effect on performance expectation. These results are in line with the findings obtained as a result of our study. However, in our study, the performance expectation factor was found to be the factor with the most impact on the intention to use e-Government. As it can be understood from here, the benefit that e-Government will provide for users is an important element in ensuring acceptance and use, that is, the intention to use e-Government. In addition, performance expectation has a mediating role in the effect of participants’ trust levels on the internet and the government on their intention to use e-Government.
In the study carried out by A. G. D. F. Gürses and Çınar (2017), no significant effect of social impact and effort expectancy factors on intention to use e-Government was found. On the other hand, in our study, it was found that both factors were effective on the intention to use e-Government, although they had different degrees of impact. The effort expectancy factor, that is, the degree of perceived ease of the system by the people, was determined as the second factor that plays an important role in the intention of the participants to use e-Government after the performance expectation factor. Accordingly, making the e-Government easy and understandable and designing it in this direction is another important step toward success in the use of e-Government. On the other hand, the factor that has an impact but is less important is the social impact factor. The answers given by the participants to the questions about the social impact factor underline the importance of individual experience in acceptance and use of e-Government in the Northern Cyprus society, unlike research conducted in other societies.
Bhuasiri et al. (2016) concluded that the facilitating conditions factor had an effect on the intention to use e-Government. In addition, this result supports the findings obtained as a result of our study. Accordingly, it is important for the Northern Cyprus government officials or project managers to create agencies where users can get help (support) for the difficulties they encounter while using the system.
Conclusion
This study aims to determine the factors that affect the acceptance and use of e-Government by e-Government users in Northern Cyprus. As in all studies conducted in this direction, determining the priority factors for the acceptance and use of users in this study is of great importance in creating the roadmap to be followed for the success of e-Government.
It was also seen in the survey study that users have awareness and positive thoughts about the TRNC e-Government Project. However, the studies on the awareness and promotion of e-Government services are insufficient and the communication channels that will provide communication with the citizens do not work properly. It is thought that the biggest factor for this is the low e-service volume in the e-Government project and the lack of a communication strategy. However, as stated in the literature, Rogers (2003) showed communication channels as one of the necessary elements for the diffusion of an innovation. Considering the hypothesis results of the survey study, it has been seen that the level of trust of the participants to the internet and the government, performance expectation (the benefits that people will gain when they use the system), effort expectation (the degree of ease of system use perceived by people), social impact levels (other individuals’ thoughts about using the new system, which is important for an individual) and perceptions of facilitating conditions (the state of believing that there are places where people can get help while using the system) have an effect on the intention to use. Although these factors have different effect rates in acceptance and use e-Government, they are all factors that affect acceptance and use of it. Therefore, it is considered important to take these factors into account and to prepare introductory and informative publications about the e-Government project. In addition, the level of trust of the participants in the internet and the government affects the performance expectation (benefit) positively, while performance expectation has a mediating role in the effect of participants’ trust levels on the internet and the government on their intention to use e-Government.
In conclusion, as a result of the findings obtained at the end of the study, it is considered necessary for the success of the Northern Cyprus e-Government project to take the necessary measures by the state authorities or project managers in the areas represented by the priority factors. This study is the first to determine the factors that affect the acceptance and use of the e-Government project in Northern Cyprus. In future studies, it is thought that a different model can be based on e-Government acceptance and use, the factors whose effects are measured can be diversified, or the power of the study to represent the universe can be further increased by increasing the number of samples.
Footnotes
Declaration of Conflicting Interests
The author(s) declared no potential conflicts of interest with respect to the research, authorship, and/or publication of this article.
Funding
The author(s) received no financial support for the research, authorship, and/or publication of this article.