
Abstract
The COVID-19 pandemic required adaptation to a new learning environment creating challenges for students and instructors. A reduction in student-teacher contact and the lack of supervision should have led to a decline in students’ academic performance. Nonetheless, studies report increases in grades during the pandemic. Yet, limited information is available regarding the persistence of this impact. This study utilizes a hierarchical mixed effect model to estimate the impact of the COVID-19 pandemic on university grades. Using unique class-level data containing chronological variables and institutional, instructor, and student characteristics, spanning Fall 2010 to Spring 2021 of 7,852 undergraduate classes, it is shown class average grade point averages (GPAs) in the College of Agriculture at Texas A&M University increased for the three semesters most impacted by COVID-19. Average class GPAs increased by 0.22 points in Spring 2020 because of COVID-19 and then approximately 0.18 points in the subsequent next two semesters. The negative effect of class size decreased during COVID-19, implying online classes have different size effects than traditional classes. Additionally, the positive effect of SAT scores on grades decreased. One implication of this study is that COVID-19 may not only have a direct, significant, impact on GPAs but may also indirectly affect GPAs through altering the effects of variables on GPAs. The causal mechanisms by which the changes occurred are an area for further research.
Introduction
The COVID-19 pandemic and resulting lockdown had broad societal impacts and disrupted the educational process worldwide (Usndg, 2020). Closures of schools and shifting from in-person to online learning created immense challenges for both students and educators (Pokhrel & Chhetri, 2021). Students had to adapt to independent learning, without in-person interactions and support from instructors. At the same time, instructors had to learn to effectively use online teaching tools to deliver class content. Not surprisingly, teachers’ creativity has been identified as a significant factor in overcoming the limitations of digital education (Subedi et al., 2020). Sintema (2020) argued that students’ performance is likely to decrease in an online environment due to limited instructor-student contact. Such challenges suggest student learning may have decreased, at least early in the pandemic. While grades are often thought of as a measure of the quality of a student’s learning, studies such as Supriya et al. (2021) have counter-intuitively shown that during COVID-19 lockdowns average grades increased.
Technological problems, academic dishonesty, and other issues may raise concerns about whether grades during the pandemic accurately measured students’ quality of work. As such, grading practices during the pandemic may contribute to endemic grade inflation, undermining the usefulness of grades as a means of evaluating students’ performance. Unanswered questions remain such as did grades increase during the lockdown, can factors be identified that caused grade changes, and do grades return to pre-pandemic levels after traditional instruction resumes?
Increased grades may be caused by grade inflation, which is defined by Kostal et al. (2016) as an increase in grades without a corresponding increase in students’ learning. Being an empirical issue (Yeritsyan et al., 2022), grade inflation may vary by institution. Grade inflation has long been an area of concern (Bejar & Blew, 1981; Kamber & Biggs, 2004; Yeritsyan et al., 2022). One important use of grades is the evaluation of students by potential employers and graduate schools (Fossati et al., 2020). Jephcote et al. (2021) suggested grade increases may give mixed signals to labor markets. If increases are attributable to increased learning, then there is a clear signal of increasing quality of education. However, if increases are the result of grade inflation, then grades provide an inaccurate signal. Grade inflation, therefore, has the potential of distorting the choices made by the labor market as employers attempt to hire the best graduates by allowing low-performing students to disguise themselves as high performers. A similar argument holds for students applying to graduate schools. This study contributes to the literature on grade inflation by examining the effect of different variables on grade point averages (GPAs) before, during, and after the pandemic. Addressing why pedagogically the variables had the effects they did is not the focus of this study.
Specifically, the objective is to evaluate the impact COVID-19 (henceforth shortened to COVID) and the resulting lockdown had on class average GPAs in the College of Agriculture (COALS) at Texas A&M University (TAMU). To achieve this objective the following questions are addressed: Is there evidence GPAs changed during and after COVID induced changes to the education system? Did the impact of other factors affecting GPAs differ in the presence of COVID relative to pre-COVID?
Although there are many studies discussing grade inflation and studies discussing the impact of COVID on grades, there are a limited number of studies examining how COVID may have affected the phenomena of grade inflation. In addition, there is an absence of robust empirical studies discussing the impact of COVID on grades. The uniqueness of the dataset used to address these concerns allows for stronger inferences.
Literature Review
As expected, literature addressing COVID impacts on education ranges from pre-K to advanced degrees from many countries. Tan (2021), for example, conducted a meta-analysis and concluded that school closures had a negative effect on K-12 students. Mseleku (2020) noted a lack of evidence on the impact of COVID on learning outcomes and the need for research on the long and short-term impacts on students in a higher education context. Pokhrel and Chhetri (2021) discussed how COVID has paved the way for introducing digital learning, but the reopening of the schools presented additional or different challenges. Because of the numerous studies in a variety of disciplines on the impact of COVID on education—this brief review focuses on outcomes as measured by grades, with the acknowledgment that grades may not be the best measure of learning, but at a large scale may be the only reliable metric available.
Online Learning
Studies and reviews of online learning versus traditional learning formats conducted before the pandemic (Bernard et al., 2004; Means et al., 2009) provide insights into how online learning may impact learning. The general conclusion of these studies was students in online classes performed the same or better than students in traditional face-to-face classes; these conclusions need to be taken critically. Bernard et al. (2004) found a wide variability in study outcomes and conclude distance education works well in some cases and poorly in others. One potential reason for this outcome is provided in a statement made by Means et al. (2009, p. xiv), “Interpretations of this result, however, should take into consideration the fact that online and face-to-face conditions generally differed on multiple dimensions, including the amount of time that learners spent on task.” The inclusion of studies Bernard et al. (2004) included 238 studies and Means et al. (2009) included only 50 studies and different definitions of outcomes by the studies included affect inference from meta-analyses. Another caveat is these studies may suffer from selection bias by both students and instructors. Online classes taught before the pandemic were generally taught by instructors and enrolled students who wanted to use such a platform. Such selection into online learning was not present in the mass transition to online learning associated with the pandemic. Kauffman (2015) in reviewing the literature found many factors play a role in the success of students in online learning, online platforms may not be appropriate for all students, and courses must be designed to effectively integrate technology and content. But general inferences from these reviews are online classes are a viable form of education especially when no alternative is available and students’ performance may increase.
Grades and COVID
It is possible COVID itself directly caused changes to grades and student behavior; however, a more plausible explanation is COVID indirectly impacted grades and students through school closures, changes in learning environments, and societal lockdowns. As expected, changes in grades and/or GPAs were reported during COVID (Engelhardt et al., 2021; Supriya et al., 2021). Johnson et al. (2020), in surveying collegiate professionals, found a third or more of faculty and administrators changed assignments or exams, let students change to pass/fail instead of a letter grade, and lowered expectations on the amount of work and quality expected of students. Changes in expectations may lead to increases in GPAs without commensurate increases in learning or worse decreases in learning. Rodríguez-Planas (2021) reasoned that increases in grades may be associated with learning improvement due to improved learning strategies, fewer employment opportunities thus lowering opportunity costs of studying, availability of relief funds which lowered financial stress, and poorer performing students leaving universities. Chan (2023, p. 1) identified five key themes “… covid-19 binary grading system, revised regulations governing the final degree award, relaxed academic progression policies, revised extension, deferral and exceptional circumstances policies, and mark adjustments.” She concluded universities made changes in good faith to attempt to maintain their standard of education while at the same time considering the health and well-being of students. An example of a policy change potentially impacting the present study is the policy enacted at TAMU that affects how F (failure) and U (unsatisfactory) grades from Spring 2020 are handled. Such grades are excluded from calculating individual student GPAs to adjust for the first COVID semester (Texas A&M University, n.d.) but not class average GPAs. Such a policy decreases incentives for students to study and/or drop classes in which they are poorly performing. These decreased incentives should lead to decreased class GPAs.
The transition from traditional, face-to-face learning to online learning associated with COVID relied on technology which may have been unfamiliar to many students and instructors. Digital skills, ideally a prerequisite for online teaching, require training and preparation, but a lack of experience with the technologies was frustrating for instructors (Pokhrel & Chhetri, 2021). Classes with lab components were resistant to digitization to preserve valuable hands-on, practical exposure (Gamage et al., 2020). In addition, computers provide opportunities for distraction (Aguilar-Roca et al., 2012; Patterson & Patterson, 2017), thus potentially limiting learning effectiveness. These technological challenges, coupled with reduced student-teacher contact and lack of supervision may lead to a decline in the academic performance of students (Sintema, 2020).
During COVID, the authenticity of the student work was difficult to evaluate with most of the work being completed remotely—an issue with online work (Pokhrel & Chhetri, 2021). Evidence from Bilen and Matros (2020) indicated that cheating took place during the lockdown. Such evidence suggests an increase in grades may have come about through dishonest means. Further, Al-Jarf (2022) suggested myriad other ways to evaluate student performance besides traditional written exams which might help alleviate the incentive to cheat.
With this background, the issue becomes: what do empirical studies find at the university level? Engelhardt et al. (2021, p. 10) found in an introductory level economics “Students demonstrated only small losses on standardized post-tests; despite this, in many cases, students earned higher grades in the COVID-19 affected semester.” Further, they found grades for females increased in the course during COVID relative to before COVID and there was no evidence of negative impacts on population subgroups. Bulman and Fairlie (2022) indicated GPA increases during COVID were largely concentrated among students in the bottom quartile of GPAs. Because grades are bounded between zero and four, bottom quartile students can numerically improve their grades more, therefore, having more to gain from grade increases than students in the top quartile. Using self-reported data from RateMyProfessors.com, Cavanaugh et al. (2023) found a 0.1 increase in GPAs. They calculated GPAs as course grades post May 2020 minus course grade pre-March 2020. Hodds (2023) results suggested students entering universities in the UK in 2021 were less prepared mathematically than pre-pandemic students, but they had a higher probability of being awarded the highest grades (A*/A). Findings of no pandemic impact on grades can also be found. For example, using data from only one course, El Said (2021) found there is no difference between grades in spring 2020 and spring 2021. In a financial economics class, the findings of Nazempour et al. (2022) suggested subgroups of students were affected heterogeneously. Average to good students were negatively impacted, whereas the results for other students were not conclusive but they may have increased grades. The uniqueness of this study is using university, not survey reported data for many classes in different departments.
Methods
Data
Class level data for COALS at TAMU for the semesters of Fall 2010 through Spring 2019 from Yeritsyan et al. (2022) are updated to include Fall 2019 through Spring 2021. Thirteen departments and one program in which classes are taught in different departments are included in the data. The program is treated as a department. Classes excluded from the dataset are summer courses, individual projects, study abroad, internships, classes with fewer than five students, classes with variable credit hours, and classes that used a pass/fail grading system. Grading at TAMU is based on a four-point system that does not use plus and minus grade modifiers. Students can also receive no grades. These no grades are aggregated into the percent of the class receiving a no grade but do not impact class average GPAs. The updated dataset has 7,852 class level observations. Because the data use all classes meeting the above criteria, no sampling procedure was used.
Model
A multivariate analysis is performed so the effects of individual variables and their interactions with COVID variables can be examined. The methodology is a mixed effects, hierarchical model, following previous studies on grade inflation (Beenstock & Feldman, 2018; Hernández-Julián & Looney, 2016; Kokkelenberg et al., 2008; Yeritsyan et al., 2022). If a hierarchical structure exists, the assumption made in statistical estimation, that the observations are independent, may be violated. This may be the case as the same instructor has multiple courses in the dataset. Different departments may also lead to non-independence of observations. Hierarchical models help account for such nonindependence (Leyland & Groenewegen, 2020). The model used here accounts for both instructor and department level fixed effects. Idiosyncratic instructor effects are important (Rivkin et al., 2005), but are difficult to quantify due to the inability to collect unobservable data. Therefore, instructors are included as a level to account for unobservable instructor characteristics. Using a similar argument, departments are considered a level. Instructor levels are nested within the department level effects. This allows for the correcting of excess variance coming from individuals’ and departments’ differences in grade outcomes. Therefore, the model is a three-stage hierarchical model, where the first stage measures the fixed effect or within-individual variation, while the second and third stages measure the random effect or the between individual variations for instructors and departments. These yields separate sets of regressions nested within each other (Greene, 2012).
To examine class GPAs, the model specification is

where,
COVID1 is a 0 to 1 variable for the Spring semester of 2020,
COVID2 is a 0 to 1 variable for the Fall semester of 2020,
COVID3 is a 0 to 1 variable for the Spring semester of 2021,
The level 2 equation is

where
Level 3 equation is

where
It is assumed the error terms or deviations are distributed with mean zero and constant variance within a stage, but the variance can differ between the stages.
Independent Variables
In the middle of the Spring 2020 semester, TAMU moved from a primarily face-to-face mode of instruction to an online format. Instructors had approximately a week to migrate their courses to an online format. The change occurred during spring break. Classes during Fall 2020 were primarily online with only a few face-to-face courses, whereas by Spring 2021 most courses had migrated back to a traditional face-to-face format. To account for potential differences between the semesters, three zero-one quantitative variables are included representing each semester’s different teaching styles and student reactions to the changes. These COVID semester variables are then interacted with the other variables along with entering the model without interactions.
Yeritsyan et al. (2022) included 32 independent variables in their model. It would be unruly to interact each of their variables with the three COVID variables. As such, to keep the model parsimonious only the most important variables from their study are included in the analysis. The independent variables fall into three general categories: chronological, instructor and institutional, and student specific characteristics (Table 1). The chronological category includes a time trend (coded as integers with a step of one each semester in the dataset) along with the three COVID semester variables. Besides Yeritsyan et al. (2022), many studies have found grade inflation (Kostal et al., 2016; Kuh & Hu, 1999; Rojstaczer & Healy, 2012) although not all studies found inflation (Adelman, 2008; Brighouse, 2008; Pattison et al., 2013). Grade inflation leads to a shift in grade distributions or the proportion of each letter grade. The time trend is used to capture any grade changes over time not associated with other variables.
Variable Descriptions and Mean Values by Period.

Institutional and instructor characteristics include class meeting time, number of students in the class, and instructor gender. Yeritsyan et al. (2022) found morning classes have lower GPAs which is in line with Skinner (1985). McElroy and Mosteller (2006) found students’ circadian rhythm influences learning. Class size has been found to negatively influence grades (Kedagni et al., 2021; Kokkelenberg et al., 2008; Yeritsyan et al., 2022). Jewell et al. (2013) postulated instructors in smaller classes can devote more time to individual students. Class size enters the model as the number of students enrolled in the class. Previous results on instructor gender are mixed some studies found an effect (Kezim et al., 2005; Moore & Trahan, 1998) and others no effect (Figlio et al., 2015; Ronco & Cahill, 2004). Instructor gender enters the model as one for male and zero for female instructors.
Student characteristics included are SAT math score, high school rank (HS rank), and percentage of male students in the class. HS rank is coded as the average high school rank of students in the class, calculated as the percentile of students in the school that rank below the given student. SAT score is a proxy for students’ innate abilities. HS rank is influenced by both a student’s motivation and ability, similar to other studies HS rank is used as a proxy for ability and motivation (Allen & Robbins, 2010). Both HS rank and SAT scores have been found to positively influence grades (Kobrin et al., 2008; Mattern et al., 2015; Yeritsyan et al., 2022). Studies tend to have found that male students have lower grades than female students (Fortin et al., 2015; Kuh & Hu, 1999; Sonnert & Fox, 2012; Voyer & Voyer, 2014; Yeritsyan et al., 2022). All three variables enter the model as quantitative values.
Results
Grade Distribution Changes Over Time
Increasing average class GPAs are seen throughout the time frame of the study (Figure 1) which suggests there is evidence GPAs changed during and after COVID, the first research question. Increasing GPAs are a result of increasing the percentage of As and a decrease in the other letter grades as shown by letter grade distributions presented in Table 2. The average increase in As between semesters before COVID was 0.3% points each semester. Because of grade increases, different bases are presented in Table 2. Increases in As for Spring 2020 over Fall 2019 is 4.5 percentage points. Over 10 times larger than the average change over pre-COVID years. Change in As decreases after Spring 2020 for Fall 2020 and Spring 2021. Increases in As are accompanied by a decrease in other letter grades, especially Bs and Cs. The percentage of students with no grade in a class decreased in Spring 2020 and returned to normalcy in Fall 2020. For Spring 2021, the no grade rate increased by about 2% points over what had been experienced in previous years and GPAs had nearly returned to pre-COVID levels.
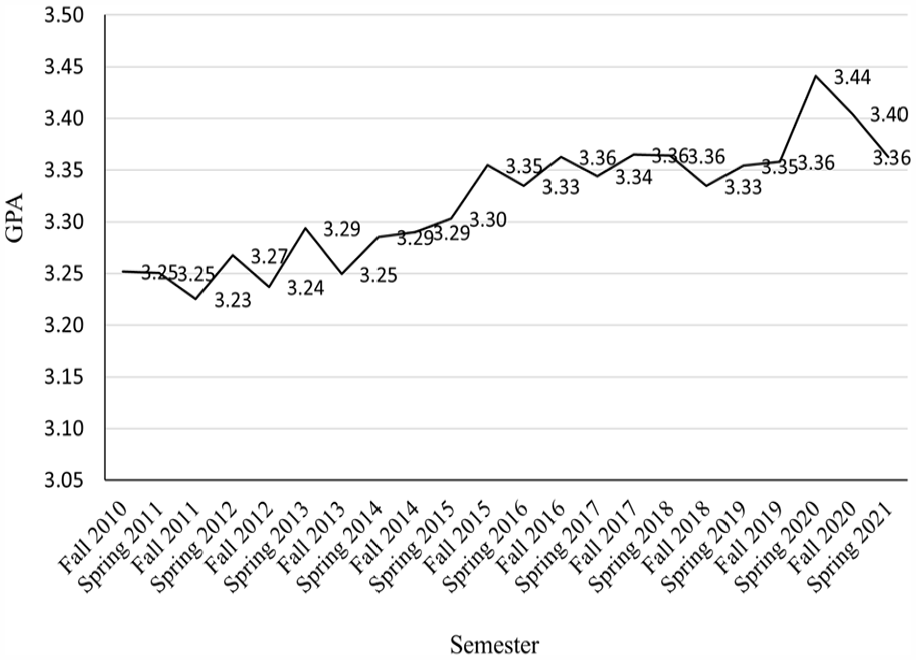
Weighted average by student enrollment class GPAs in COALS by semester, fall 2010 to spring 2021.
Percentages of Letter Grades for Various Times and Percentage Changes Based on Different Bases due to Grade Increases.

Note. Distributions of letter grades, A, B, C, D, and F, are based on students receiving these grades. Percentages of students who dropped a class are based on total students, those receiving a letter grade plus drops.
Mixed Estimation
Estimation results from the estimated mixed model are used to address the second research question, did the impact of other factors affecting GPAs differ in the presence of COVID relative to pre-COVID.
Overall Model Fit
Likelihood ratio tests reject the hypothesis that models including random effects are equivalent to a linear regression model (Table 3), because there is evidence of clusterization (similarities in grading patterns observed for departments and instructors). Interclass Correlation Coefficient (ICC), the proportion of a GPA’s total variance that is shared among members of defined clusters, indicates substantial clusterization for instructors (ICC = .14) and departments (ICC = .57). Clusterization is present if this measure is above zero (Park & Lake, 2005). The appropriateness of the model presented here is also supported by examining information loss criteria, minimum values were attained including both levels when compared to including only one level or no level.
Estimation Results From the Mixed Effect Model of Mean Class GPA.
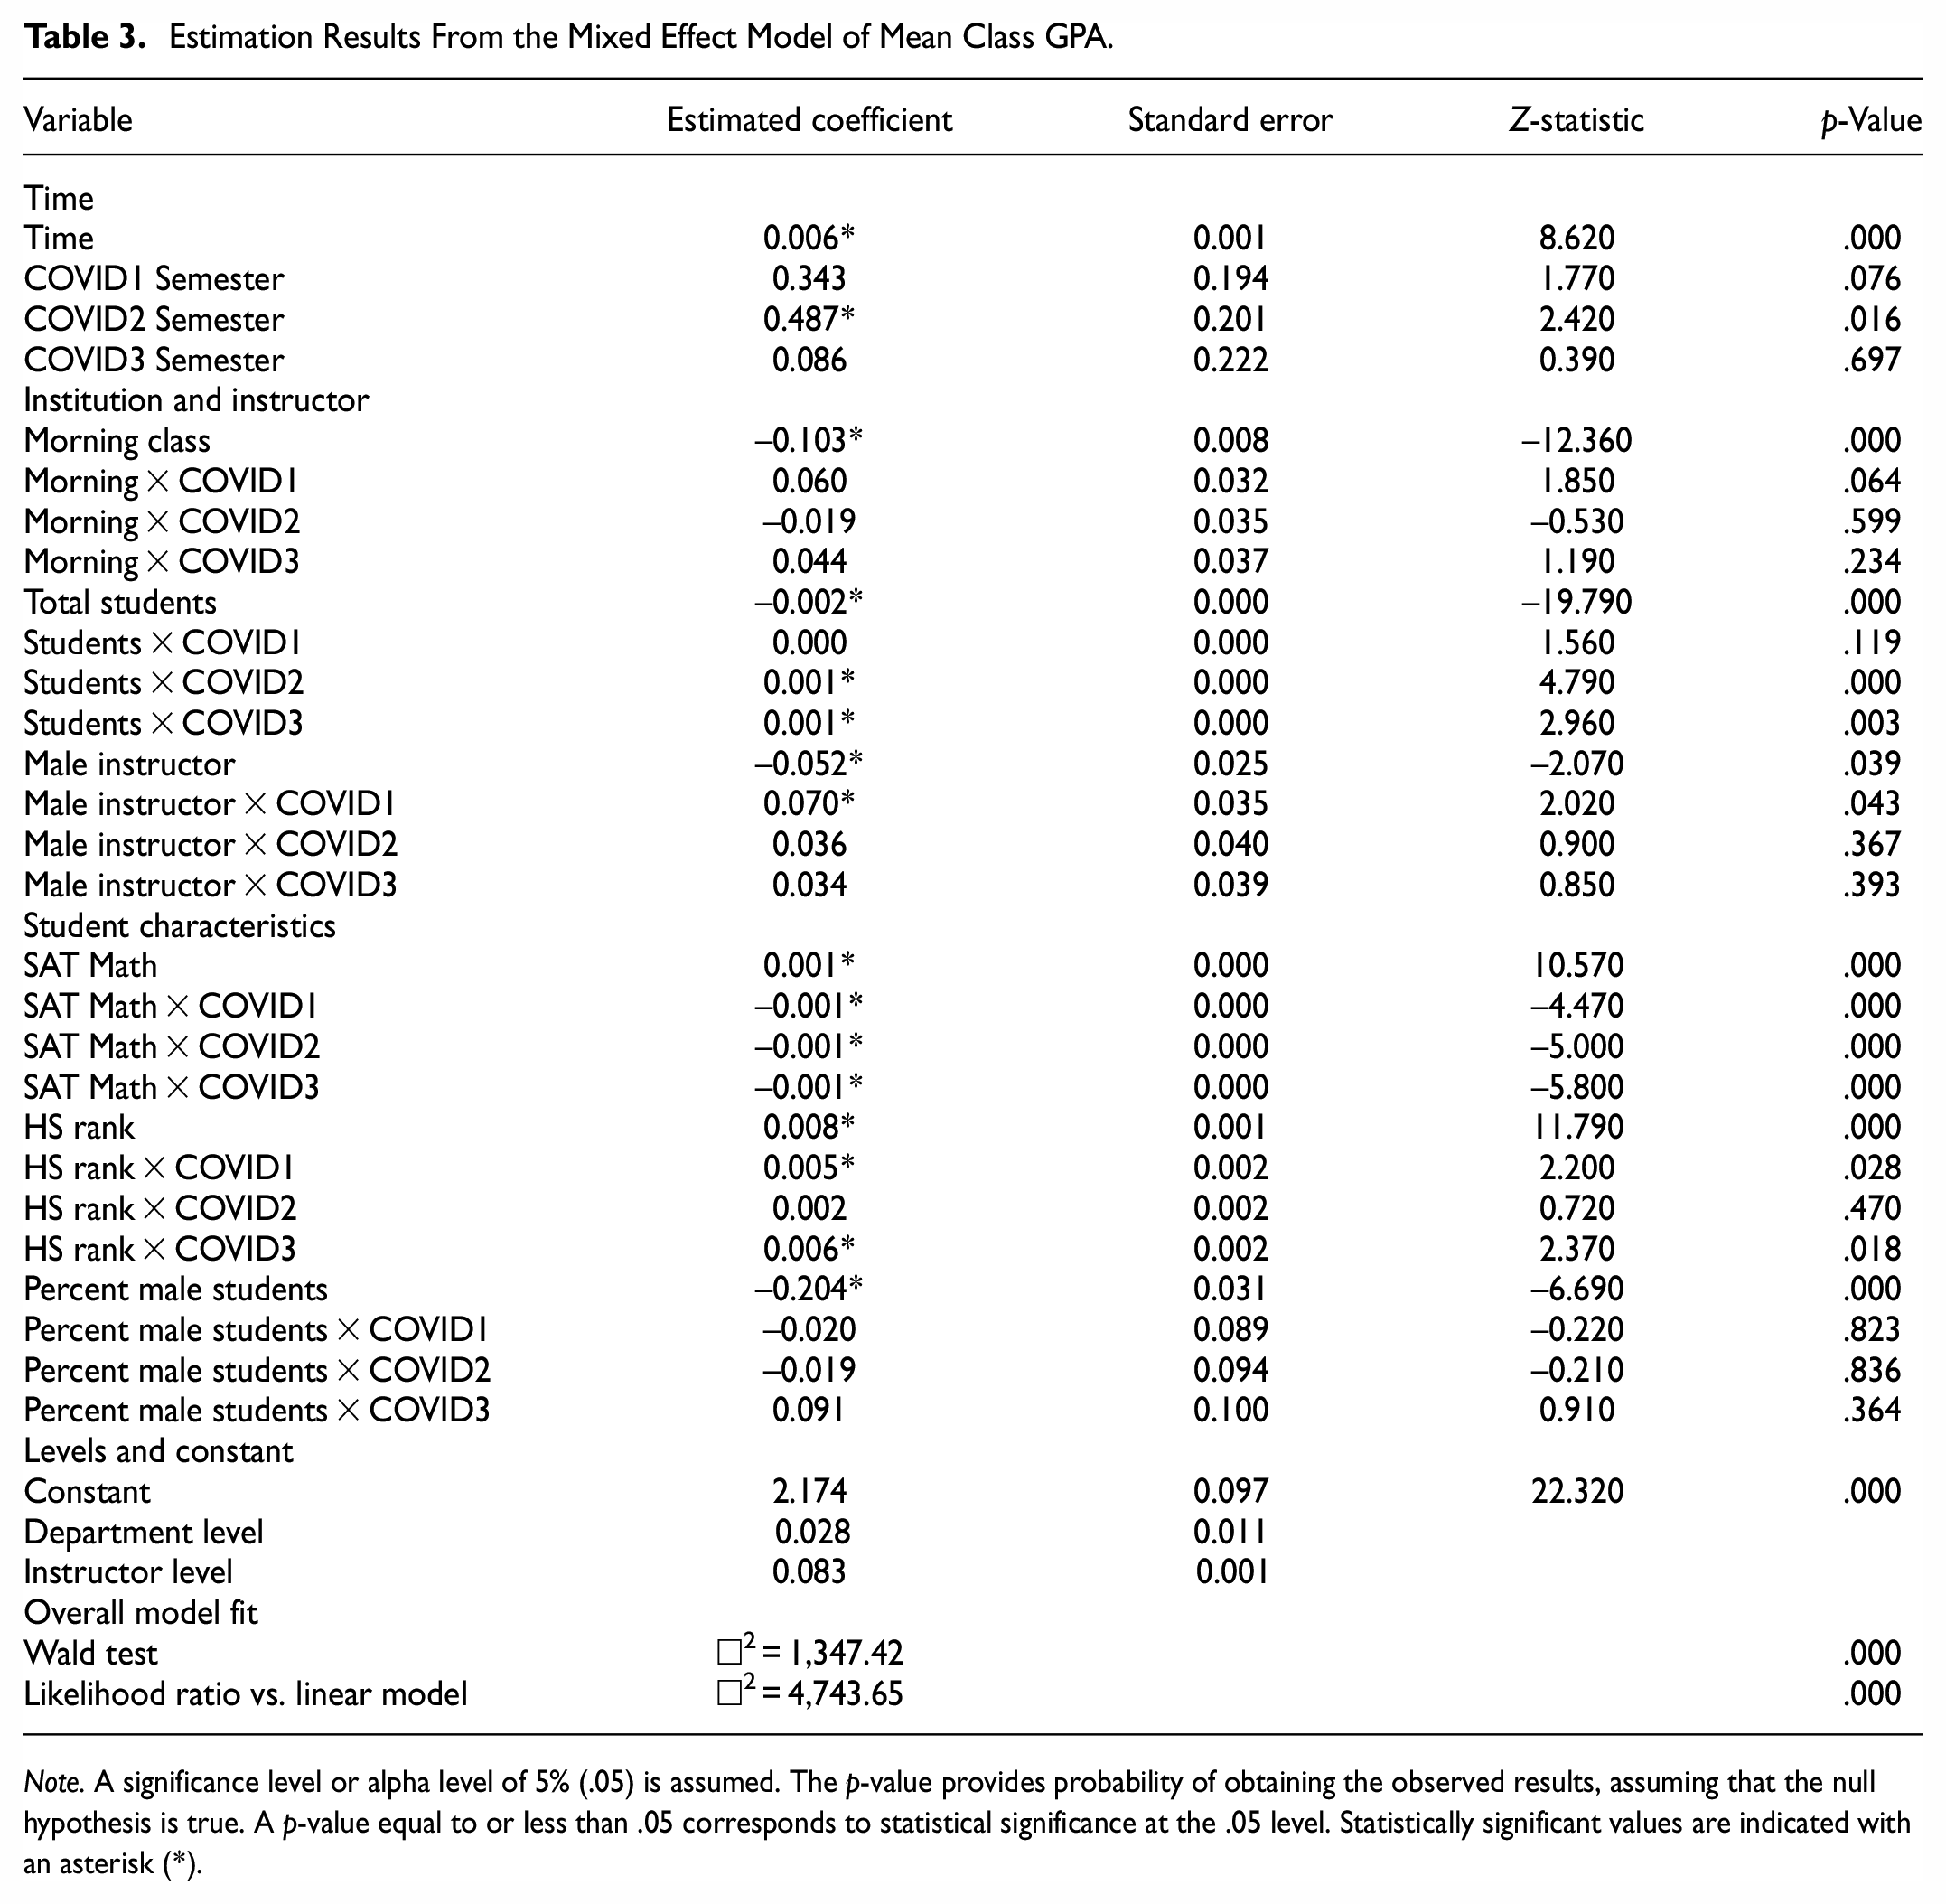
Note. A significance level or alpha level of 5% (.05) is assumed. The p-value provides probability of obtaining the observed results, assuming that the null hypothesis is true. A p-value equal to or less than .05 corresponds to statistical significance at the .05 level. Statistically significant values are indicated with an asterisk (*).
GPAs are limited to values between zero and four, as such it is unlikely the error terms will be normally distributed. Normality tests indicated nonnormal error terms. However, the methodology does not require normality to produce unbiased parameter estimates and the use of student t-tests (Li et al., 2012). Further, because the model contains many interaction terms some degree of collinearity is inevitable. However, using interaction terms is necessary for capturing the joint impact of COVID and the independent variables. It is believed the benefit of capturing joint impacts outweighs the loss in efficiency caused by any collinearity.
Estimated coefficients are provided in Table 3. As expected, both instructor and department fixed effects have statistically significant impacts on GPAs at the 5% level. (For brevity, henceforth, the word statistically will be dropped with significant referring to significance at an alpha level of .05 or 5%). Estimated coefficients without interactions provide a baseline as they are associated with effects before COVID. All variables are significant before interacting with COVID. Time trend, SAT scores, and HS rank positively influence GPAs. Morning class time, class size, male instructors, and percent male students negatively influence GPAs. These influences are in line with many previous studies as discussed earlier, but it should be noted analyses of GPAs remain an empirical issue and influences can vary between studies.
Chronological Variables
The positive coefficient for time indicates a systematic increase in class GPAs. COVID only had a significant effect on GPAs in the second COVID semester (Fall 2020). In that semester, GPAs increased by almost one-half of a letter grade due to COVID alone though this effect is moderated by other interactions. The first COVID semester, Spring 2020, has a positive coefficient and is marginally significant at an alpha level of .08. This result may be because of approximately one-half the semester was conducted under pre-COVID conditions. There is no significant relationship between the third semester of COVID and GPA indicating a possible return to normalcy.
Institutional Variables
Classes held in the morning are associated with lower GPAs compared to classes held in the afternoon and evening in line with previous literature (Aldaghir, 2018; Diette & Raghav, 2017). None of the interactions between COVID semesters and morning classes are significant. This lack of significance indicates that the effect of a morning class is invariant with respect to the changing circumstances associated with COVID. Although the first semester interaction term with morning classes is marginally significant at an alpha level of .064.
In line with previous studies (Guder et al., 2009; Kokkelenberg et al., 2008), increasing the number of students in a class decreases class GPAs. During each of the COVID semesters, the negative marginal impact of a larger class is moderated relative to pre-COVID semesters. This interaction, however, is insignificant in the first COVID semester which again may be because part of the semester was held before COVID impacted academics. The marginal effect of an additional student on GPA is about half during the second and third COVID semesters relative to pre-COVID. Such a moderation may partially be explained by Bettinger et al. (2017) who found the effect of being in a large class disappears for online classes.
Instructor Variables
As previously noted, male instructors tend to have lower GPAs than female instructors. This effect was moderated in Spring 2020, the first COVID semester, in which the interaction term with COVID is positive and significant. There is no lasting impact of instructor gender interacting with COVID after the first COVID semester.
Student Variables
As expected, increases in class average SAT scores are associated with an increase in GPAs pre-COVID. In each of the COVID semesters, the interaction terms between COVID and SAT scores are significant and negative with the coefficient being approximately the same magnitude but opposite in sign of the pre-COVID coefficient. This may be explained in the second and third COVID semesters by the fact that during COVID TAMU temporarily waived SAT score requirement for applicants, therefore, potentially impacting student’s SAT scores by reducing the incentive to score high on this test for incoming students. No reasons are postulated for the decrease in impact in the first COVID semester. A decrease in scores is seen in the data for the COVID semesters. Another potential explanation for a decrease in SAT scores follows Hodds (2023) incoming students were not as prepared after COVID as before.
More motivated students, as given by higher HS rank, are significantly associated with an increase in GPAs (Orhan Özen, 2017) similar to previous studies (Kobrin et al., 2008; Mattern et al., 2015; Yeritsyan et al., 2022). In the COVID semesters, motivation, as measured by HS rank, increases in importance in explaining GPAs, as measured by the positive and significant relationship seen between GPAs for the first and third COVID semesters. The interaction term is insignificant for the second COVID semester. A possible explanation is less motivated students dropped out of the university to reenroll in subsequent semesters as TAMU allowed students to drop and reenroll. This policy may have caused the most motivated students to remain enrolled with less motivated students leaving the university; therefore, motivation is not a distinguishing factor in the second COVID semester.
Males generally are associated with lower GPAs. COVID had no significant impact on how males versus females performed. This finding contrasts with some previous studies that suggest women suffered more than men during the pandemic (Prowse et al., 2021) and women improved their grades more with the return to face-to-face instruction (Ferrer et al., 2023).
Total COVID Impacts
To understand the broader picture of COVID’s impact on GPAs in addition to individual variable effects, one must consider the total effect of all variables on GPAs. Wald tests for the joint significance of COVID variables by COVID semester and their interactions are significant at an alpha level of .01 indicating strong evidence of the joint significance of the COVID variables. Overall, the mean impact of COVID (calculated at the mean of all variables) increased GPAs by 0.224, 0.182, and 0.191 points on a four-point scale in the first, second, and third COVID semesters.
Conclusions and Discussion
To achieve the objective of evaluating the impact COVID-and the resulting lockdown had on class average GPAs in COALS at TAMU two questions are addressed: Is there evidence GPAs changed during and after COVID induced changes to the education system? Did the impact of other factors affecting GPAs differ in the presence of COVID relative to pre-COVID?
Regarding the first question, there is evidence that grades changed—results indicate that for the three semesters most impacted by the COVID pandemic grades, at the means, increased on average between 0.18 and 0.22 points on a four-point scale due to COVID. The largest increase occurs in the first semester, Spring 2020. The distribution of grades shifted toward more As and fewer other letter grades. Weak evidence that some students struggled with returning to face-to-face from online instruction is seen in the increase in the percentage of students receiving a no grade for Spring 2021. Further, the influence of factors affecting grades is mixed. The influence of some factors may have changed during the COVID semesters relative to pre-COVID semesters while others did not change.
Regarding the second question: in line with many other studies (Jewell et al., 2013; Kedagni et al., 2021; Kokkelenberg et al., 2008) larger classes result in lower GPAs. However, the marginal effect of an additional student in class during COVID is about half of that for an additional student pre-COVID. Such a finding is consistent with Bettinger et al. (2017) who found the effect of increasing student numbers in a class may disappear for online classes. One implication is although reducing the number of students for in-person classes could enhance learning, its significance is comparatively diminished for online classes. Results suggest male instructors tend to have lower GPAs showing similar results from previous studies such as Jewell and McPherson (2012). However, this tendency faded away during the first semester of the pandemic with male instructors associated with higher GPAs. Additional research is necessary to gain a deeper understanding of grading patterns exhibited by male and female instructors during emergencies. SAT scores and students’ high school rank positively influence GPAs. During the COVID semesters, a negative influence is seen associated with SAT scores, which may be caused by the university suspending SAT requirements for incoming students. Students who are more motivated with higher levels of performance as measured by high school rank were associated with increased GPAs during COVID.
Two factors did not see a change in their impact during COVID, class time and percent males. Skinner (1985) noted sleep habits may be the reason for lower grades during morning classes. Pre-COVID followed along these lines in that morning classes resulted in significantly lower GPAs relative to other class times. COVID did not change this influence in a statistically significant manner. COVID did not statistically change the influence of percent males in a class on GPAs. This result is somewhat surprising because studies such as Prowse et al. (2021) indicate social isolation and stress caused by COVID was associated with a more pronounced negative effect on the academic performance of female students than male students. This result may arise because of a decrease in the percentage of female students during the COVID semesters.
Because of the nature of the data, the specific causal mechanism by which GPA changes occurred cannot be identified. This study is limited to discussing GPA changes and not causes. Further research is necessary to determine underlying the causal mechanisms of changes in GPAs with or without respect to COVID. Further, no claims are made concerning the quality and depth of learning.
We see that all variables, taken together, in each COVID semester accounted for increases in class GPA of around 0.2 points. An important implication of this result is that COVID may not only have a direct, significant impact on grades and grade inflation but also may impact grades indirectly by altering the effects of other variables on university grades. If this is the case, departments may consider changes to bring the grades back to pre-COVID levels. Research on the lasting effects is necessary as the data becomes available. However, department administrators and instructors may consider some other evaluation methods (such as continuous competency and assignment-based assessment for example) where students are assessed throughout the semester not based only on tests and projects, but also on specific skills and competencies.
Limitations
This study uses data from one college in one university. Implementing similar exercises in several universities would be beneficial for generalizing the results. Additionally, it is based on a comparison of online learning during COVID versus traditional learning modes using semester as an instrument for learning type. Assignments, tests, and lecture content given by the same instructor may be different between online and traditional teaching modes. While these variables are not incorporated into the model, they may influence student learning and grades. A further limitation of this study is GPAs may not be the best measure of student learning or quality of education. However, it is a broadly accepted measure and possibly the only measure available over time.
Footnotes
Author Contributions
Conceptualization, J.W.M., J.A.T., A.Y.; Methodology, J.W.M., A.Y., J.A.T.; Formal Analysis, J.A.T., J.W.M., A.Y.; Data Curation, J.W.M., A.Y.; Writing, Original Draft, J.A.T., J.W.M., A.Y.; Writing, Review and Editing, J.W.M., J.A.T., A.Y.; Supervision, J.W.M.; Funding Acquisition, NA.
Declaration of Conflicting Interests
The author(s) declared no potential conflicts of interest with respect to the research, authorship, and/or publication of this article.
Funding
The author(s) received no financial support for the research, authorship, and/or publication of this article.
Institution Review Board Number IRB 2017-0802M.
Availability of Data
Research data available on request.