
Abstract
This study examined the difference in expenditure behavior by age group through an empirical analysis of changes in card expenditure after the COVID-19 outbreak, using card transaction data in Korea. It also investigated whether changes in card spending reflecting changes in expenditure behavior occur because of the spread of infectious diseases. A panel analysis was employed using data from 2018 to 2020. After the outbreak, total expenditure decreased by 15.6%, with the spending of older, middle-aged, and young adults falling by 18%, 15.8%, and 14.1%, respectively. Spending on eating out declined by 24.3%, while that on eating in increased by 2.2%, a tendency that is more prominent for older adults. These findings suggest that the COVID-19 pandemic affected expenditure behavior, and the change varied by age group. This implies that the consumption-boosting effect of the COVID-19 relief fund may differ by age group with the different marginal propensity to consume.
Introduction
The spread and mutation of the coronavirus have been ongoing since the World Health Organization announced the outbreak of the severe acute respiratory syndrome coronavirus 2 (SARS-CoV-2) as a pandemic on March 11, 2020 (World Health Organization [WHO], 2020). With the advent of the COVID-19 era, two characteristics of the pandemic have emerged globally. First, like the Middle East respiratory syndrome (MERS) and severe acute respiratory syndrome (SARS), older adults are the most vulnerable. MERS patients aged 60 years and older are nine times more prone to fatalities than younger patients (Mizumoto et al., 2015). During the MERS outbreak, older workers suffered more severe impacts from the job loss than younger people, and the labor market for older workers was relatively more vulnerable than that for other age groups after the outbreak (Lee & Cho, 2016). With COVID-19, as with SARS and MERS, older patients are more likely to experience unfavorable results (Shahid et al., 2020). In Italy, the case fatality rate of COVID-19 for persons aged 80 or over exceeded 45% (Santesmasses et al., 2020). In England, the elderly’s excess death rate from COVID-19 was 17% above the expected rate without the outbreak, which is more than double the excess death rate for people aged between 15 and 44 years (Aburto et al., 2021). In the United States, 80% of deaths from COVID-19 were among patients aged 65 years and older (Akter, 2021). Given this vulnerability to COVID-19 infection, the U.S. Centers for Disease Control and Prevention (CDC) highlighted the risks for the elderly and stressed the importance of vaccination (Centers for Disease Control and Prevention [CDC], 2020a).
The second feature is a reduction in human mobility. To stem the spread of COVID-19, governments implemented policies to decrease the movement of people. China, starting with Wuhan, banned the use of all means of mobility and imposed a local lockdown (Liu et al., 2020). European countries closed borders and prohibited meetings, carried out lockdowns, and restricted movement by implementing a movement permit system (Goniewicz et al., 2020). In the United States, each state took various measures, including travel restrictions, stay-at-home orders, and school closures (Bergquist et al., 2020).
These diverse government-imposed measures reduced human mobility, as demonstrated by analyses of GPS, credit card transactions, and public transportation data. After the lockdown in France, the movement distance of cards decreased sharply, and the movement of card use between regions also decreased significantly compared with the same period last year (Bounie et al., 2023). The elasticity of Google and Apple mobility data and card spending was approximately 0.9, and both consumption and mobility drastically decreased after lockdowns (Campos-Vazquez & Esquivel, 2021).
Countries are tightening restrictions on movement because of the spread of COVID-19 infections, spurred by silent spreaders who show no symptoms after being infected, as well as infections by aerosols and droplets occurring everywhere (CDC, 2020b; Shukman, 2020). The difficulty of detecting asymptomatic cases and the nature of COVID-19 as an airborne virus have made anyone and any place potentially unsafe. Accordingly, the WHO and CDC strongly discourage meetings at crowded places with poor ventilation (CDC, 2021; WHO, 2021). In particular, restaurants that are usually packed with people staying for a longer time were highlighted as major routes of COVID-19 infection (Y. Li et al., 2021; S. Chang et al., 2021; Morawska et al., 2020; Tang et al., 2020).
Due to the widespread occurrence of infection and the government’s mobility restrictions, economic shocks were inevitable as consumer sentiment shrank. During the MERS outbreak, the accommodation, food service, and leisure sectors were severely affected by infection concerns (Lee & Cho, 2017). Similarly, after the COVID-19 outbreak, the dining, entertainment, and travel industries, which are characterized by high human contact, were hit hard, suggesting that reduced consumption is closely associated with the fear of COVID-19 infection (Chen et al., 2021; Immordino et al., 2022; Yang et al., 2020). Efforts to reduce the spread of infection have led to secondary economic damage.
Research on the drop in consumption focused on analyzing changes after a government’s restriction on mobility. In Portugal, private consumption expenditures decreased by about 25% after the government banned the movement, with the elderly group’s consumer spending being hit the most (Eichenbaum et al., 2020). In France, since the lockdown measures were established, credit card transaction values and volumes fell by 46% and 55%, respectively (Bounie et al., 2023). In the United States, when shelter-in-place orders were announced, private consumption of necessities rose, but the orders’ implementation led to a sharp downward trend in consumption (Baker et al., 2020).
The purpose of this study is to compare the changes in expenditure patterns of each age group after the COVID-19 pandemic. To analyze this, offline card transaction data was used for three reasons. First, offline spending is much more exposed to infection risk than online consumption. Online consumption is a service that can be used regardless of the presence or absence of infection, but a consumer’s visit to the store carries the risk of infection. In addition, since changes in offline consumption directly affect the income of offline stores, changes in offline consumption are key as reference materials for setting policies for small business owners. Second, credit cards are the most preferred and widely used payment method in Korea. According to data released by the Bank of Korea, the proportion of total payments made using cards is the highest at 69.1% in 2019 (Bank of Korea, 2020). Third, access to online consumption data is limited. The credit card company did not provide online spending history, so it was not included in the analysis.
This study identified differences in consumption through an empirical analysis of changes in credit card expenditure by age group after the COVID-19 outbreak. Using big data on offline credit card transactions in Seoul, South Korea, where there was no direct government regulation on mobility, we estimated the changes in consumption due to the spread of COVID-19. Furthermore, this study examined whether changes in card spending reflecting changes in expenditure behavior occur because of the COVID-19 pandemic. This was done by comparing the changes in spending on eating out and eating in, when infection was most likely to occur. To analyze the changes in dining venues after the outbreak, spending items were divided into eating-in and eating-out items, where the former comprised materials necessary to prepare for dining at home and the latter, spending at restaurants. Eating-out items included consumption at restaurants serving Korean, Japanese, Chinese, Western, and other types of food, while eating-in items included agricultural and fishery products and foods and beverages purchased at discount stores, supermarkets, convenience stores, other stores, and butcher shops. Changes in dining places can be interpreted as behavioral changes aimed at avoiding COVID-19 infections, suggesting that the risk of COVID-19 infection affects expenditure behaviors.
Background on the Spread of COVID-19 in South Korea
On 20 January, 2020, Korea had its first case of COVID-19, and cases have risen since then (M. C. Chang et al., 2020). Figure 1 shows the trend in confirmed cases and infection and fatality rates by age group. As in other countries, the data show that infections occurred in all age groups, but fatalities rose sharply among the elderly. Approximately 70% of those infected were under the age of 60 years. Meanwhile, the fatality rate for those under the age of 60 was less than 5%, but the fatality rate for older adults was 3% to 25%, indicating that the age group with the greatest risk of infection was the elderly.
(A) Trends in confirmed cases.
(B) Infection and fatality rates according to age.
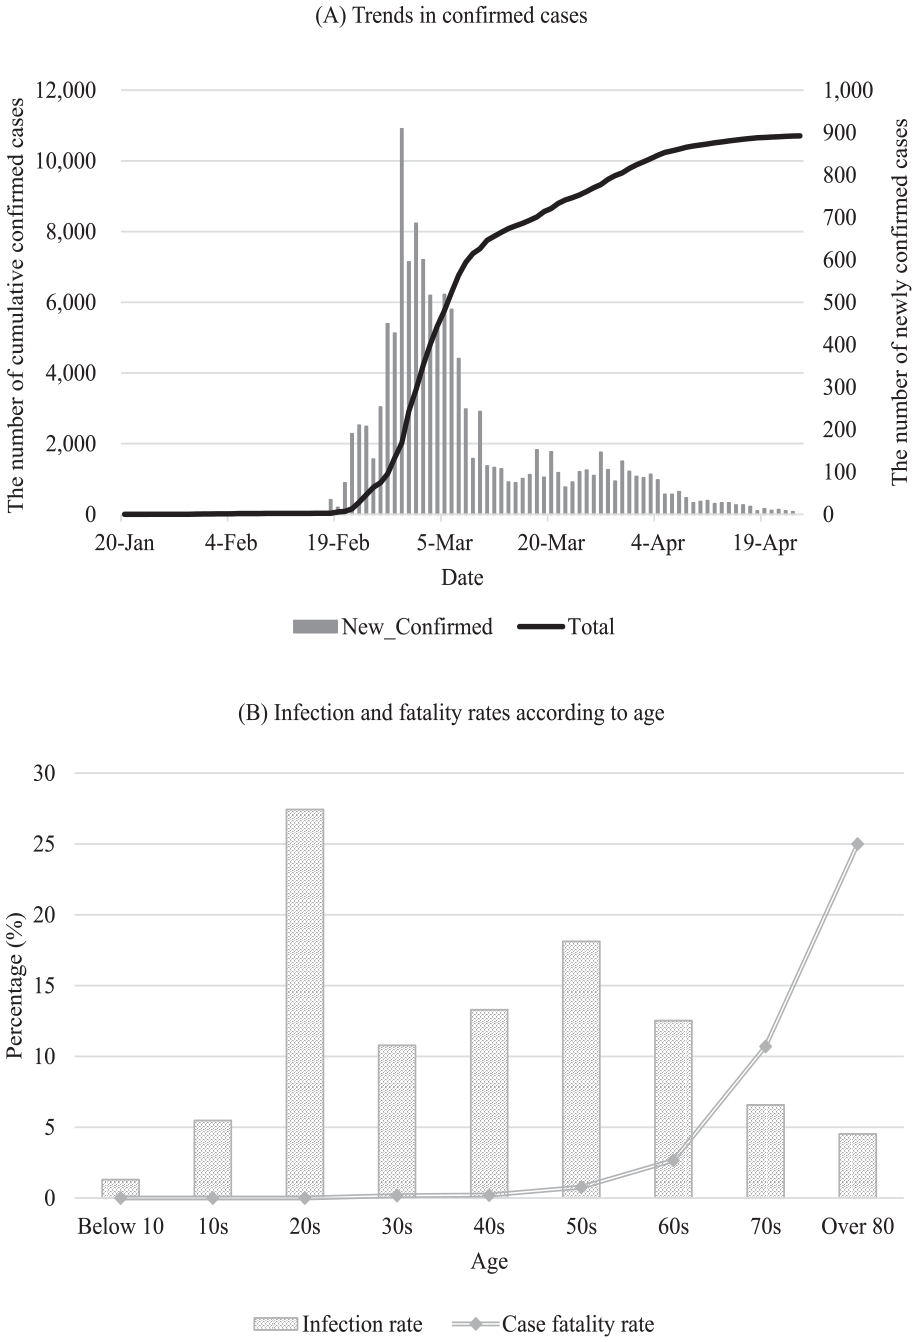
COVID-19 statistics in South Korea.
In Korea, direct mobility regulation policies due to the outbreak of COVID-19 have not been implemented. Instead, a campaign called social distancing was conducted to prevent the spread of infection through voluntary changes in people’s behavior. In the first enforced social distancing campaign, from March 22 to April 19, guidelines such as refraining from going out, canceling gatherings and eating out activities, visiting a medical institution, disinfection, and ventilation were recommended. Multi-use facilities were closed, and quarantine time was reduced. Since then, as the spread of COVID-19 decreased, distancing in daily life has been implemented. Distancing guidelines in daily life consist of simple guidelines, such as maintaining distance between people, washing hands, and wearing a mask. In June, social distancing was divided into one to three levels to control and manage the stages according to the number of confirmed cases. Social distancing continues to be supplemented and corrected according to the mutation and spread of the coronavirus. Figure A1 shows the geographical map of South Korea and the spread of COVID-19.
The decrease in movement due to the pandemic is evident in Korea. Figure 2 shows people’s average number of daily movements per week across the country, expressed by mobile data provided by telecommunication companies to Statistics Korea to analyze the spread of COVID-19. Except for the sixth week of Lunar New Year’s Day, in 2019, the number of movements in all weeks was higher than that in the first week. However, in 2020, the floating population dropped sharply, as COVID-19 confircmed cases occurred after the fourth and fifth weeks, including Lunar New Year’s Day. As the number of confirmed cases soared since the ninth week, population movement also decreased.

People movement in South Korea, 2019 and 2020.
The changes in consumption patterns are clearly seen in the amount of expenditure, although the number of confirmed cases in Seoul was less than 10% of the total number of confirmed cases in Korea. Figure 3 shows the changes in offline total expenditure in 2018, 2019, and 2020 in Seoul. Compared with 2018 and 2019, spending in 2020 was higher before the fifth week of the outbreak. Since the fifth week, although expenditures in 2018 and 2019 returned to the level of the first week, spending in 2020 had been much lower than in the first week. This can be seen more clearly in the difference between the expenditure in 2020 and the average expenditure in 2018 and 2019, indicating that with the outbreak’s impact in the fifth week the consumption pattern changed rapidly.
(A) Total expenditure pattern in 2018 to 2020.
(B) Difference between expenditure in 2020 and the average expenditure in 2018 and 2019.

Card expenditure pattern in Seoul, 2018 to 2020.
Even with the change in expenditure by age, a change in expenditure due to the occurrence of COVID-19 is evident. Figure 4 shows the relative change from baseline in the first week. In the fourth week since New Year’s Day, the level of expenditure still did not recover to the first-week level. Although there are differences in expenditure reduction by age group, the spending changed in a similar pattern. A comparison of this with the number of COVID-19 confirmed cases shows that expenditure decreased the most in the ninth and tenth weeks when the number of new confirmed cases increased the most.

Relative change in expenditure in 2020 by age group.
Literature Review and Hypothesis
Since the outbreak of the pandemic, the decrease in consumption has been analyzed to be primarily driven by two main factors. Firstly, the government’s mobility restrictions play a significant role. Measures such as lockdowns, stay-at-home orders, and border closures legally restrict people’s movement, effectively blocking routes to engage in consumption activities and resulting in a sharp decline in overall consumption (Andersen et al., 2022; Baker et al., 2020; Bounie et al., 2023). When a stay-at-home order was implemented in the United States, there was an immediate decrease in mobility for approximately 7% of the population nationwide, which resulted in a 16% decrease in revenue for small businesses (Alexander & Karger, 2023). With the implementation of the lockdown in the United Kingdom, there was a decrease in overall consumption, and it was observed that consumption patterns could vary based on income distribution (Hacıoğlu-Hoke et al., 2021). In the impoverished regions of India, the implementation of lockdown resulted in a decrease in remittance income, ultimately leading to a decline in consumption (Gupta et al., 2021). Secondly, psychological factors lead to a decrease in consumer behavior. Psychological factors mainly include concerns and fear regarding infection, as well as uncertainty about the future. Immordino et al. (2022) demonstrated that fear of infection related to outdoor activities had the strongest correlation among the reasons for reducing consumer behavior and increasing savings after the pandemic. Goolsbee and Syverson (2021) analyzed the changes in foot traffic using cellular phone records data. Among a 60% decrease in foot traffic, they found that only 7% could be explained by government mobility restrictions, while the majority of the impact was attributed to the fear of infection, which contributed to the decline in consumer activity. J. Li et al. (2020) and Lin et al. (2021) demonstrated that the increased economic uncertainty caused by COVID-19 can lead to a heightened perception of job insecurity and occupational instability, which in turn can increase people’s liquidity constraints and result in a decline in consumption behavior.
Previous studies have identified two main factors that contribute to a decrease in consumption. However, since these two factors simultaneously influence people’s consumption behavior, it is necessary to conduct distinct research based on each factor. Studying the effects of each factor can play a crucial role in determining the specific government interventions needed in the event of a disease-related pandemic recurrence. Therefore, the main objective of this study was to investigate changes in consumption patterns driven by psychological factors, excluding government regulatory factors. The objective is to confirm the following hypotheses.
With the onset of the pandemic, most countries implemented direct government control measures. In South Korea, however, there were no direct control measures imposed by the government. Instead, the government provided recommendations and guidelines to the public, without intervening in people’s movements. Therefore, this study aimed to analyze South Korea, where there was no government intervention, to separate the effects of government policies and provide evidence for Hypothesis 1.
Considering that psychological factors influence people’s consumption patterns, it was hypothesized that there would be differences in consumption patterns based on age groups. It is known that the fatality rate of the virus increases rapidly among the elderly population. Therefore, it can be assumed that the older age group, which faces a greater risk associated with life-threatening consequences, may experience a higher psychological burden regarding the risks. Thus, this study aimed to analyze the extent of changes in consumption patterns across different age groups to find evidence for Hypothesis 2.
Materials and Methods
Data
This study used big data of credit card transactions from the Seoul Bigdata Campus of the Seoul Metropolitan Government. The card company offers credit card transactions that account for approximately 20% of the market share in Korea. It provides estimated data on card transactions considering the market share, which can be taken as the total amount of card spending in Seoul. The data provided by the Seoul Bigdata Campus were divided into exportable and non-exportable data. In some cases, original data can be exported from the Seoul Bigdata Campus, but most data must be pre-processed before data export is permitted. Credit card transaction data, which are non-exportable data, are unusable outside the Seoul Bigdata Campus upon request from the credit card company. Consequently, data analysis was conducted in a computer lab at the Seoul Bigdata Campus.
The card transaction details provided by the credit card company had only the details of offline use. Online transactions via the Internet or mobile applications were not included. Offline consumption using credit cards refers to in-person visits to and payments in stores, which increase the risk of exposure due to movement to make payments. Hence, offline credit card spending can be regarded as a consumer behavior that reflects the risk of COVID-19 infection. Therefore, offline card transactions are appropriate for analyzing consumption changes due to infection concerns. The transaction details included transaction date, amount, number of transactions, items, gender of users, and place of card use.
The data provided by credit card companies are not personal card transactions, but data classifying the sales details of merchants located in Seoul according to the age of the consumer. Accordingly, the change in consumption patterns by group was analyzed by classifying the data as total expenditure according to the consumer’s age. In this study, young adults were classified into consumer groups aged 20 to 39, middle-aged adults aged 40 to 59, and older adults aged 60 years or older.
The data were used for the period from week 1 to week 16 based on the lunar calendar to control for the impact of New Year’s Day. In addition, to avoid including the consumption-boosting effect of the payment of relief funds, data after week 16 were not used in this study. A balanced panel was constructed for each age group and analyzed using expenditures for 16 weeks in 422 administrative dongs located in Seoul. The number of observations for each age groups is 20,256, and the statistics are provided in the appendix.
Empirical Model
In this study, the change in expenditure behavior of each age group after the coronavirus outbreak was analyzed. The analysis was conducted for 16 weeks, using balanced panel data on expenditures in 422 administrative dongs located in Seoul, and the STATA statistical package was used for the analysis using a fixed effect model. A fixed-effect model can control the heterogeneity of unobserved variables, making it efficient for adjusting the characteristics of regions and times (Wooldridge, 2010).
First, we analyzed the average expenditure change for the period after the outbreak. Unlike the other countries, in Korea, there was no national lockdown due to the spread of the COVID-19. Therefore, we had to assume the period of the COVID-19 outbreak. The first confirmed case occurred on January 20 (third week), and the country’s alert for infection was raised from caution to warning on January 27 (fourth week). All confirmed cases up to January 30 (fourth week) were those who entered Korea from abroad. From January 31 (last day of fourth week), the spread of infection among domestic residents began. The period was selected on the assumption that the spread of infection among residents in Korea had more influence on changes in expenditure behavior than cases of infection abroad. The period from the 5th to the 16th week of 2020 was defined as the period of card expenditure change due to the pandemic. Using the period of spread of infection among domestic residents (fifth week) as the start of outbreak, the fixed effect model was employed. The equation is as shown below:
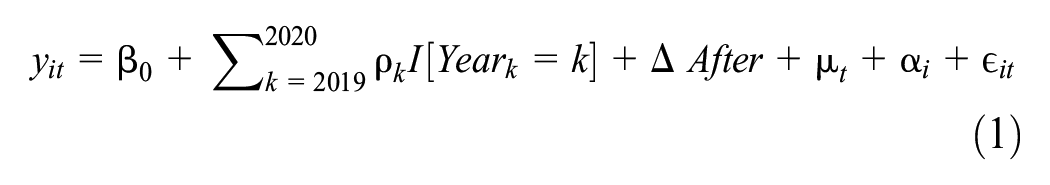
where
Second, we analyzed the weekly change in consumption patterns by adding a dummy variable for each week corresponding to the pandemic period to examine the change in expenditure behavior according to the spread of the coronavirus, using Equation 2 below:

In this formula, the change in
After examining the changes in the overall consumption pattern, we compared and analyzed the expenditure on eating out, which is recognized as the most dangerous activity during the pandemic period, and the expenditure on eating in. By comparing people’s spending by venue type, we can look at people’s perceptions of the virus and the changes in their expenditure behavior.
Results
Table 1 shows the impact of the COVID-19 outbreak on offline credit card expenditure by age group. Column (1) shows that total card spending has decreased by 15.6% since the COVID-19 outbreak. Figure 5 shows the dynamic change in total expenditure by week, analyzed using Equation 2. The changes in the number of new confirmed cases per week and in
Panel Results: Change in Card Expenditure by Age Group.
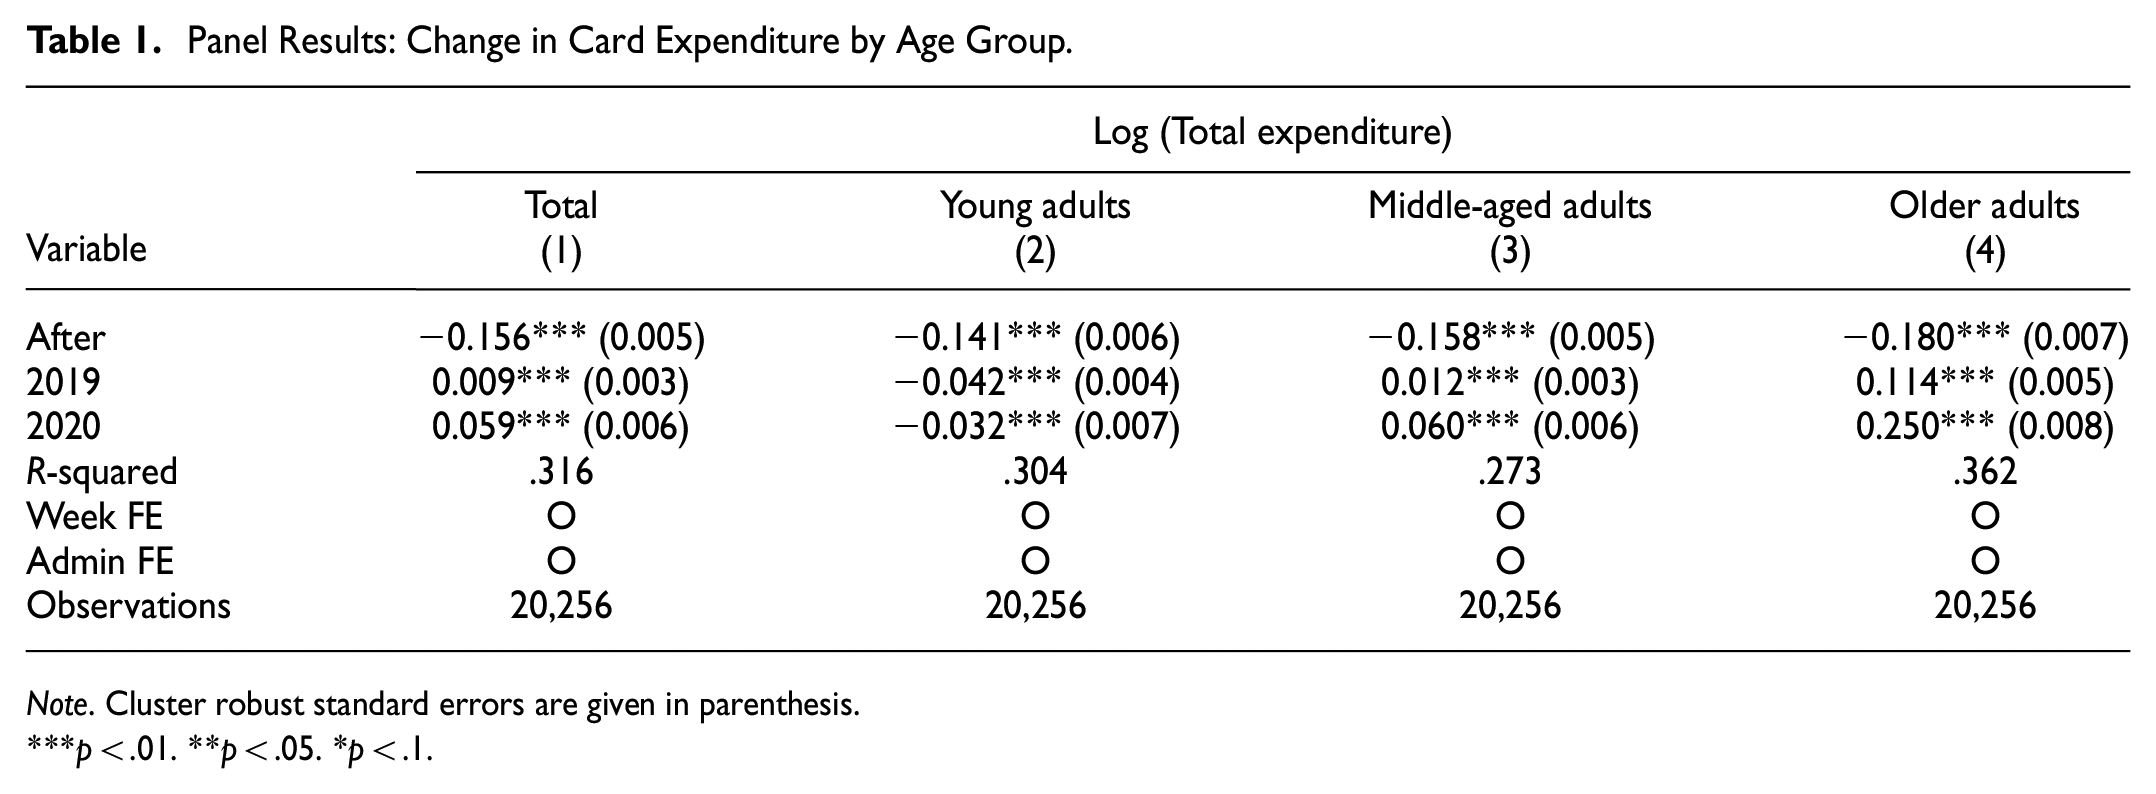
Note. Cluster robust standard errors are given in parenthesis.
p < .01. **p < .05. *p < .1.

Dynamic changes of total expenditure and COVID-19 cases.
Older adults, the group with the highest case fatality rate, showed the most prominent change in card expenditure. Compared with pre-pandemic spending, the consumption of older, middle-aged, and young adults fell by 18%, 15.8%, and 14.1%, respectively, suggesting that the level of consumption reduction was higher for the older age group. As with the total card expenditure, the coefficients of

Dynamic changes in expenditure and confirmed cases by age group.
The results in Table 2 show the effects of COVID-19′s spread on expenditure behavior by age group. In columns (1) and (5), total credit card spending for eating out decreased by 24.3% after the outbreak, while expenditure on eating in increased by 2.2%. These results suggest that to reduce exposure to infection, people reduced their visits to restaurants because of the difficulty of wearing masks and poor ventilation systems. Figure 7 shows that as the number of new confirmed cases increased, spending on eating out gradually decreased, and expenditure on eating in increased. It also shows that the gap between the two types of spending decreased as the number of confirmed cases dropped, indicating that people’s expenditure behavior was affected by the trend of confirmed cases. In other words, as the probability of infection increased, a type of expenditure behavior that lowers the possibility of infection became evident.
Panel Results: Change in Card Expenditure by Dining Venue by Age Group.

Note. Cluster robust standard errors are given in parenthesis.
p < .01. **p < .05. *p < .1.

Dynamic changes in expenditure by dining venue and the number of newly confirmed cases.
Columns (2)–(4) and (6)–(8) in Table 2 show the changes in spending on eating out and eating in by age group after the outbreak of COVID-19. Compared with pre-pandemic spending, the expenditure of older, middle-aged, and young adults on eating out (eating in) fell by 37.2%, 25.2%, and 19.5% (increased by 5.5%, 3.7%, and 0.2%), respectively. The results show that young adults did not reduce their spending on eating out as much as other age groups. These results suggest that some young adults were asymptomatic or had weaker symptoms; thus, the change in their expenditure behavior was insignificant compared with other groups. However, for the older the group, less spending on eating out and more spending on eating in indicate an attempt to protect their health from the virus. The middle-aged group is the age group which most likely lives with minor children or their parents. It is also the age group that bears the burden of the household’s livelihood. Therefore, people in this group need to consider the health of the entire household. Accordingly, they are obliged to reduce eating out and encourage household members to eat at home. Older adults are the most vulnerable to COVID-19 and in their view, personal health concerns supersede that of transmission to others through infection. This view seems to have reduced offline consumption the most.
In summary, as all results suggest, expenditure behavior has been affected by the spread of the virus. In addition, the change in expenditure behavior due to the pandemic was found to differ by age group. In particular, the age group in which expenditure behavior has changed the most since the outbreak of COVID-19 is that of the elderly. This is more evident in the spending on eating out, which is an activity that makes people highly susceptible to infection.
Discussion and Conclusion
Policy Discussion
COVID-19′s unprecedented, long-term epidemic contagion has adversely affected the global economy. In particular, amid various measures to reduce mobility, small merchants have suffered seriously. This is mainly due to the drop in the number of visiting consumers and the government’s operating hour guidelines. To minimize the economic shock, stimulus payments have been distributed according to the policies of each government. Table 3 shows the classification of the stimulus package policies by recipients. In the United States, under the Coronavirus Aid, Relief, and Economic Security Act (CARES Act), emergency relief funds were distributed to individuals depending on income. In Japan, financial support was provided to all individuals residing in the country (Kaneda et al., 2021; Wright et al., 2020). Other countries have provided relief funds according to their respective national regulations (Investopedia, 2021). The government’s stimulus package polices to help the economy recover from COVID-19 are similar, but there are differences in the target of payments. Most countries have implemented support policies to provide payments to underprivileged people. In some countries such as Korea, Japan, and the United States, relief funds were provided to all citizens to stimulate the demand side of consumption to help economic recovery.
Stimulus Package by Country.

In Korea, the relief fund provided to all citizens aimed to increase spending. Funds have been distributed to the heads of households according to the number of household members. By leveraging the existing payment system, this distribution method could allow for faster disbursement compared to the individual payment method, which entails the government making separate payments to each individual. 67.4% of households received relief funds by credit/debit card, cash 13.2%, prepaid card 11.8%, and gift certificate 7.2% (Ministry of the Interior and Safety, 2020). However, the payment to the head of household can weaken the consumption-boosting effect in two aspects. First, as the payment is made to the head of household, the middle-aged and older adults receive most of relief funds. The proportion of head of household is 22% for young adults, 44% for middle-aged adults, and 34% for older adults (Korean statistics information services, 2020). In the offline card expenditure data of this study, it was found that the older the age group, the lower the spending. This means that most of relief funds were given to the age group with significantly reduced expenditure behaviors. As those who have reacted sensitively to the spread of COVID-19 would not be exposed to infection to consume additional funds, the consumption stimulus effect of the fund is highly likely to be insignificant for the aged group during the COVID-19 pandemic. Second, the head of household chooses how to get relief funds. The relief fund can be received by selecting the desired payment method among cash, pre-paid card, gift certificate, and credit/debit card. However, as the choice was given to the head of household, relief funds was paid through the preferred payment method of the householder. According to a survey released by the Bank of Korea, in terms of the number of use cases, the most preferred payment method for each age group was check card for 20s, credit card for 30s to 50s, credit card and cash for 60s, and cash for over 70s (Bank of Korea, 2018). Although the preference of credit cards is increasing among all age groups compared to the past, it shows that preference for payment methods is still different by age. This suggests that household members may have difficulties in increasing expenditure due to unfamiliar payment methods when using relief funds. For example, if the head of household receives the funds with a credit card and gives it to a household member in their 70s, there may be difficulties in using the relief funds due to inconvenient payment method. The purpose of the first relief funds in Korea was to help small business owners and self-employed by boosting consumption. In other words, the objective was to maximize consumption-boosting. In this regard, it is a matter to be discussed whether the method of payment to the head of household is more suitable to achieve the policy objective than the individual payment method. For this, research using data on cash and other payment methods as well as card expenditure is essential.
With the unforeseen prolongation of the COVID-19 pandemic, governments worldwide are endeavoring to boost dampened consumer spending and assist those facing economic hardships due to disrupted economic activities. It is anticipated that government support will expand in diverse forms. In light of this situation, it becomes imperative to contemplate the optimal implementation of government aid. As demonstrated by the findings of this study, it is imperative to consider the recipients of relief funds. Moreover, the distribution methods should also be taken into account. In the face of abrupt and prolonged economic shocks, such as the COVID-19 pandemic, the disbursement of financial aid becomes a pressing issue for certain individuals. Hence, at times, government support through swift distribution methods utilizing existing systems can prove to be more effective in enhancing individuals’ well-being than policies solely aimed at maximizing consumption. Consequently, future research should analyze the impact of financial aid in the consumption sector, considering the recipients and methods, such as card-based, cash-based, or prepaid card-based assistance. Moreover, since each country has different circumstances and policy directions, conducting comparative analyses can provide insights into how government policies should be formulated. Therefore, future research is deemed necessary to conduct more detailed and contextually comparative analyses.
Conclusion
The results of this study show changes in expenditure behavior due to concerns over infection after the COVID-19 outbreak, as evidenced by the differing changes in credit card expenditure by age group. In all age groups, credit card spending fell sharply after the outbreak, while spending and the number of confirmed cases moved in opposite directions. Credit card expenditures fell further in age groups with a higher case fatality rate. After the COVID-19 outbreak, total card spending decreased by 15.6%, with the card spending of older, middle-aged, and young adults falling by 18%, 15.8%, and 14.1%, respectively. The older the age group is, the greater the change in expenditure behavior in terms of eating in and eating out. This finding suggests that the spread of COVID-19 reduced spending in varying degrees by age group. In addition, the further decrease in consumption among the elderly suggests that the fatality rate also affects expenditure behavior, along with the spread of infection.
The case fatality rate (which rapidly increases non-linearly for older adults) and the decrease in consumption seem to be related. The changes in expenditure behavior according to the spread of infection and drop in consumption by age group point to this relationship. However, as multiple factors affect people’s expenditure behavior, the results cannot sufficiently support the inference that consumption among older adults fell the most significantly because of a higher case fatality rate. Hence, additional studies on the causal relationship between case fatality rate and expenditure behavior by age group are necessary.
Our study has some limitations. It did not consider other factors such as income, social status, and changes in consumption preferences. People may reduce their consumption if they expect a decrease in their incomes after losing a job or seeing a change in their social status. Moreover, the ease of consumption change may vary according to the age group. For example, older retirees can change their behavior more flexibly than office workers can to avoid COVID-19 infection. Furthermore, the ease of online use may vary according to age group. As offline consumption decreases due to an increase in online services, the expenditure of older adults accustomed to offline consumption may have decreased more than that of other age groups because of a lack of online accessibility. In addition to the aforementioned factors, various other elements such as gender differences, disparities between urban and rural areas, and variations in household characteristics can also influence consumption patterns. Therefore, it is believed that future research should adopt a detailed perspective that takes these factors into account. Comparing the results of studies considering the influence of each factor will be helpful in establishing future polices.
Footnotes
Appendix
Authors’ Contributions
BJ contributed to data collection, statistical analyses, and the literature search strategy. JM contributed to the conceptual framework and writing of the paper. All authors contributed to the interpretation of the data, article revisions, and approved the final version of the manuscript.
Declaration of Conflicting Interests
The author(s) declared no potential conflicts of interest with respect to the research, authorship, and/or publication of this article.
Funding
The author(s) disclosed receipt of the following financial support for the research, authorship, and/or publication of this article: This paper was supported by the SKKU Excellence in Research Award Research Fund, Sungkyunkwan University, 2023.
Ethical Approval Statement
Not applicable.
Informed Consent Statement
Not applicable.
Institutional Review Board Statement
Not applicable.
Data Availability Statement
The credit card transaction data are available from the Seoul Bigdata Campus, although they are only available through an in-person visit at the institution. Other data were provided as open sources by the National Statistical Office and the Korea Centers for Disease Control and Prevention.