
Abstract
The increasing guidance requirement in choosing mutual funds contribute to the development of an abundant literature on approaches of ranking funds performance. However, all the commonly used single index and multi-indexes ranking methodologies have their own drawbacks and are in fact not suitable for a reasonable and practical mutual funds comprehensive ranking sometimes. More specifically, the single index measures are incomprehensive, controversial, or even ineffective sometimes, while the mostly used multi-indexes methods do not make full use of evaluation information and usually indirect and inflexible in reality. This paper proposes a paired competition based mutual fund multi-indexes comprehensive performance ranking method which could avoid most of the shortcomings of existing approaches with six good characteristics: it is a comprehensive ranking method that reflects different performance aspects; it provides both cardinal and ordinal information for various practical applications; it integrates both individual evaluation information and joint comparison information for obtaining a more accurate and robust ranking scheme; it has a flexible framework to process complicated data situation; it reveals true strength of fund without distortion; it is convenient to operate in practice. In addition, a more reasonable objective weighted method is proposed to deal with the indexes correlation problems.
Introduction
The size of the trade round the world has created the selection of funds analysis and ranking ways of key importance (Almeida et al., 2020; Fulkerson & Hong, 2021; Kutan, 2018). For example, mutual funds were of key importance to the USA capitalist and three-fourths people families closely held mutual funds (Elton & Gruber, 2020). However, investors are faced with difficulties in choosing a mutual fund among hundreds and thousands of equity funds or bond funds. The guiding need in making this important decision has led to the development of an abundant work on how to measure and rank mutual fund performance (Durán Santomil et al., 2022; Grau-Carles et al., 2019; Mateus et al., 2019; Parida & Teo, 2018; Venkataraman & Rao, 2021; Yu et al., 2022).
The Sharpe ratio, the well known performance measure for mutual fund industry, which measures the relationship between the standard deviation of the returns and the mean excess return of the funds under the normally distributed returns assumption (Sharpe, 1966). It has several drawbacks, as pointed out by Ornelas et al. (2012). The effectiveness of some other classical measures, such as the Treynor ratio and the Jensen’s alpha depend heavily on the validity of the CAPM model. However, a large number of subsequent studies show that CAPM model is not a reasonable description of the real asset price. For example, the Fama-French 3-factor model and the Carhart 4-factor models are more critical and effective than the CAPM model for describing assets price (Carhart, 1997; Fama & French, 1993). There is a growing work of metrics that exceeds the mean-variance and CAPM model aspect and try to overcome the problems of Sharpe ratio or reflect the ability of other aspects (e.g., market timing and persistence ability) of mutual fund (Adcock et al., 2020; Cogneau & Hübner, 2009; Cuthbertson et al., 2022; Hassouni & Pirotte, 2022). In addition to these classic indicators, in recent years, scholars have also studied the mutual fund performance from other new aspects. These aspects include optionable stocks (Chung et al., 2018), portfolio concentration (Fulkerson & Riley, 2019), gross profitability (Kenchington et al., 2019), recession managers (Chen et al., 2021), beta anomaly (Irvine et al., 2022), fund size (Farid & Wahba, 2022), benchmark discrepancies (Cremers et al., 2022), Offshore concentration (Bai et al., 2022), and so on.
All the above mentioned methods are single index evaluation methods, which can evaluate for sure and thus rank the funds well to some extent from different performance aspects. However, these single index measures have the following three common drawbacks: (a) incomprehensive. These indexes reflect either return or timing ability or performance persistence. Each index can only reflect some performance aspect of mutual fund. If only one of the measures is chosen, the funds ranks are quite arbitrary because of its arbitrary selection; (b) controversial. For example, only when investors believe that risk can be properly measured by standard deviation, or in a world where returns have a nice symmetrical distribution (e.g., normal distribution), Sharp ratio is an appropriate measure of performance evaluation. However, in reality, we can find many categories of returns with non-normal shapes. Take another example, the Jensen’s alpha requires the assumptions of the famous CAPM model, which is controversial in the academic literature since the real market is quite complex to describe it well. (c) ineffective. For instance, the interpretation is also difficult when Sharpe ratio is negative: if risk increases, the Sharpe ratio also increases.
Due to these inherent shortcomings of the single index incomprehensive measures, it is meaningful to consider multi-indexes comprehensive evaluation or ranking methods to integrate different performance aspects. Compared with the large number of single index methods, there are only few literature using multi-indexes approaches to evaluate or rank mutual funds. These little literature can be divided into four typologies: operational research methods such as data envelopment analysis (Basso & Funari, 2001; Charnes et al., 1985; Gouveia et al., 2018); those based on principal component analysis (Pearson, 1901); those based on intelligent analysis such as neural network (Indro, 1999; Li & Qu, 2022) or genetic algorithm (Wang & Li, 2002); those based on multi-criteria decision making (MCDM) method such as simple scoring method, the ideal solution TOPSIS method (Alptekin, 2009; Chang et al., 2010), and other MCDM methods (Alimi et al., 2012; Lee et al., 2009). One of the advantages of these comprehensive methods is that various aspects of fund performance are considered, although many approaches may not easy to operate in practice. However, these existing multi-index ranking methods have the following three common shortcomings: (a) only using individual information. To develop a good comprehensive ranking method, we should to consider both marginal (individual) information and joint (comparison) information. Individual information is provided by measurement of each single index and thus considered as a kind of marginal information. Comparison information reflects the mutual relationships of those single index measures and thus is a kind of joint information. One way of using the joint information is to let the funds compete with each other under those different single evaluation indexes. Unfortunately, all above mentioned multi-index ranking methods only use the individual evaluation information without considering the joint comparison information. In short, the existing multi-index approaches depend only on the marginal distribution of each fund, while it is more reasonable to use information contained in the joint distribution of the pair of funds; (b) indirect scheme: borrow a evaluation method for ranking. The existing multi-index ranking methods indeed use a single ruler (integrate many indexes) to measure mutual fund performance and then rank them, which can be viewed as borrowing a metric from evaluation approach for performance ranking. Actually, evaluation and ranking have significant differences. First, performance evaluation is for an individual fund, while performance ranking is for two or more funds. Second, the results of evaluation are cardinal, while the results of ranking are ordinal (sometimes cardinal). For a ranking problem, cardinal information should be considered less because it is less important than the ordinal information. Third, performance evaluation is absolute that reflects how fine the fund is, while performance ranking is relative that reveals which fund is better. In addition, borrowing an evaluation method to rank will naturally make the comparison information waste since evaluation has nothing to do with comparison; (c) inflexible framework. The existing multi-index methods cannot solve the problems of data type and data missing well in practice. When the data types of index values are different, the common way is to unify different data types into one type, which may lead to distortion of the original data information. When some index values of some funds are missing, it is usually filled with some typical values (e.g., mean or median), which is arbitrary and actually introduces untrue data.
Through the previous literature review and analysis, we believe that a scientific mutual fund ranking method should have the following six good characteristics: (a) it should be a comprehensive ranking method which can reflect different mutual fund performance aspects; (b) it can provide both cardinal and ordinal information for various practical applications; (c) it uses both individual information and comparison information for the purpose of obtaining a more accurate and effective ranking scheme; (d) it has a flexible framework to process complicated data situation reasonably; (e) it can reflect the true strength of fund without distortion (ranking score value should proportional to the strength value of the funds); and (f) it is convenient to operate in reality. Fortunately, a paired competition based ranking scheme which was firstly introduced by mathematician Keener (1993) for football team ranking problem satisfies all the six advantages we mentioned earlier and has been applied to many other sport games, universities ranking, pages ranking, estimators ranking, etc. (Yin et al., 2018). However, it has not been applied to mutual fund ranking so far. Therefore, this paper mainly considers the combination of the paired competition based ranking scheme and the mutual fund ranking problem to obtain a more scientific comprehensive ranking approach.
Paired Competition Based Comprehensive Ranking Method
Motivation
As discussed in the introduction part, although there is a close relationship between fund evaluation and ranking, but in fact, they are two different scientific problems essentially. In this paper, we will focus on fund ranking. Obviously, fund ranking methods can also be classified into single index ranking and multi-indexes ranking. In the existing literature and practice applications, the single index mutual fund ranking directly uses the single index funds measure value to sort, which is natural and reasonable, because we can only use the scalar measurement in the single index ranking method. However, when considering the use of multi-indexes for fund ranking, the existing literature still takes the scalar comprehensive evaluation result of each fund to rank them directly, which is indeed unreasonable. It is believed that this method actually borrows an evaluation method to deal with a ranking problem, or in other words, in dealing with the mutual fund ranking problem, it introduces the sub problem of mutual fund performance evaluation. This “evaluation and then ranking” scheme will bring three obvious drawbacks in the case of multi-indexes fund ranking: (a) evaluation first and then followed by ranking procedure only uses the (marginal) individual evaluation information of each index, which naturally does not need to use the (joint) comparison information among the evaluation results (measurements) of different measures, consequently causing waste of a lot of accessible information; (b) we only need to solve the fund ranking problem, but the introduction of the sub problem of performance evaluation may bring much more new difficulties. For example, data standardization needs to be solved first in multi-indexes fund comprehensive evaluation, while the rationality of standardization method will directly affect the effectiveness of evaluation result; and (c) the comprehensive evaluation result without clear economic meaning is directly used as the ranking score of each fund, which makes it difficult for us to intuitively find the relationship between the ranking score and the real strength of the fund.
In this part, we propose a paired competition based comprehensive ranking approach which was firstly introduced by Keener for ranking football team in 1993 (Keener, 1993) to rank mutual funds. It uses not only the individual evaluation information of each index, but also the comparison information obtained by a paired competition process. It gets around the data normalization problem and reflects the true strength of the funds without distortion. In addition, it is flexible and convenient to operate in practice.
Framework of the Method
Generalized Evaluation Matrix
Suppose that we have

where
C-Score and C-Matrix
To obtain a final rank vector (RV) for mutual funds with both ordinal and cardinal information directly and utilize the joint comparison information, we define a C-matrix

where
These three types of function which depend on practical requirements need to be predetermined. In addition, if the measurement under the index

for the special fund
In particular, if we let

where
Similarly, if we let

where
After the paired competition process, we can finally obtain the C-matrix:

Paired competition process exploits the comparison information as much as possible. And the C-matrix contains all cumulative results of pairwise comparisons of all funds based on C-score. Therefore, C-matrix contains both individual evaluation information provided by all the single indexes and the comparison information obtained by the paired competition process. The proposed unified formulation of C-score have four advantages in practice: (a) it avoids the step of data standardization which may be unreasonable under some data situation; (b) it is allowed for the absence (non-existing or missing) of some measurements and thus no need for artificial supplementary data; (c) it allows measurement to be of different data types (e.g., numerical values, fuzzy linguistics, or preferences) since the flexible setting of those three functions for each index
Ranking vector
For obtaining the final ranking vector (RV) for all funds, we first define a performance vector (PV) which describes the unknown inherent true performance of all funds as:

where
Take the above two requirements into consideration, we assume that a RV and a PV have the following relationship

where

This above relationship makes good sense: beating an excellent/strong competitor is more valuable and deserves a high score. The elements of

where
By equations (8) and (10), we can obtain

Obviously, finding a PV
For any
In fact, the unique normalized positive eigenvector PV

where
Finally, the ranking score vector
Properties and Advantages of the Proposed Method
Now we conclude the properties and advantages of the proposed paired competition based mutual fund multi-indexes comprehensive ranking method.
Properties
A property is qualitative which represents the commonality of all quantitative results. Therefore, good properties is very important for an excellent performance metric. This is especially true for mutual fund ranking method, because it cannot be evaluated by other more basic approaches. Otherwise, how to evaluate this more basic method? This is why any ranking method must have good properties. Our proposed approach has four attractive properties:
(a) Homogeneity: If all performance metrics indicate
(b) Invariance: The old rank would not be changed by adding a new metric that matches the old rank.
(c) Monotonicity: Assumed that
(d) Decisiveness: An unique RV could always be guaranteed by the proposed method.
Proofs could be found in Yin et al. (2018).
Advantages
Here, we conclude the advantages of our proposed mutual fund multi-indexes comprehensive approach.
(a) The proposed method is a multi-indexes comprehensive ranking method which can reflect different mutual funds performance aspects. Compared with arbitrary single index, our method increases the stability and rationality of the final rank.
(b) The proposed method makes good use of both individual evaluation information and joint comparison information, and thus reveals some deep insight about the fund performance which cannot be revealed by other individual information based multi-indexes based methods. Moreover, the proposed method is also of additional help in deciding between funds which are indistinguishable by approaches only based on individual information.
(c) The final ranking vector gives ordinal information to determine rank and also provides cardinal information which exhibiting how much one fund is better than the other. Ordinal information is more useful and is guaranteed through a linear mapping.
(d) The ranking vector is proportional or is the same to the true performance vector of mutual fund and thus effective and reasonable.
(e) The ranking result given by the PV (or equivalently RV) only depends on the C-matrix and is independent of the prior goodness. Thus, PV makes full use of the comparison information and exploits the C-matrix well.
(f) The proposed unified formulation of C-score allows the absence (non-existing or missing) of some evaluation data, allows the existence of different types of data and avoids data standardization which may be unseasonable in some situation. These make the proposed ranking method more flexible and practicable.
(g) The proposed method is very convenient for practical application because it only needs to find the eigenvector corresponding to the maximum eigenvalue of the C-matrix.
Objective Indexes Weights
Now, we start to deal with the important problem of deciding objective indexes weights which are incorporated in the formulation of the C-score in equation (2).
Three Widely Used Objective Weights
Mean Weight Method
The mean weight method (MW) gives equal weight to each index to ensure the objectivity of the evaluation process to some extent.

Entropy Weight Method
The entropy weigh (EW) proposed by Shannon and Weaver’s (1949) reveals the relative importance of its corresponding criterion and it reflects the contrast intensity of the criteria. It can be defined as in equation (14).

where
CRITIC Method
The CRITIC (CR) method proposed by Diakoulaki et al. (1995) determines the objective weights which could incorporate both conflict and contrast intensity. The CR weight can be defined as in equation (15)

where
As discussed in the beginning of this section, the processing of indexes correlation is crucial when determining the indexes weights, especially in the multi-index fund ranking problem since the correlation of similar types of measures may be very strong. Therefore, the above mentioned MW and EW approaches which lack the consideration of the indexes correlation is indeed inappropriate in processing our problem. Additionally, the widely used CR method with the processing of indexes correlation is also unreasonable here. Thus we propose the modified CRITIC (MCR) method later.
Modified CRITIC Method
Motivation
The term
Statistical correlation: The overall relevance of the two indexes in mathematical sense (representing the intrinsic linear relevance of criteria)
Sample (specific evaluation results) correlation: The relevance degree of the specific evaluation results provided by two indexes for a specific evaluation object (representing the linear correlation of (sampling) evaluation results)
The Proposed Weight
Through the previous discussion, we propose the modified CRITIC method (MCR) in detail. Assume that the statistic correlation of the

where
However, the difficulty in reality to use the proposed MCR method lies in how to get the statistical correlation
Validation for Modified CRTIC Method
In this part, a simulation experiment is applied to verify the rationality of our proposed MCR method compared with the original CR method, which ultimately is capable of revealing that the proposal of using large samples correlation instead of statistical correlation is reasonable in reality.
In this simulation, the experiment is done by the following steps.
Step 1: Determine the investment range of the mock mutual funds to be evaluated: such as all Chinese A-shares, SSE 50 Component shares, HS 300 component shares, etc. Here, we select the HS 300 component shares as the basic investment set and denote it as
Step 2: On the basis of the investment set
Step 3: All the mock mutual funds are assumed to have been in operation from 2019.1.1 to 2021.12.31. Then, we can get the daily net value of these mock funds for the 3 years.
Step 4: We select Jensen’s alpha, Sharp ratio, information ratio and Treynor ratio as the performance metrics to evaluate the generated
Step 5: Calculate the six Pearson correlation coefficients among the selected four indexes: the correlation coefficient of Treynor ratio and Sharpe ratio (TS); the correlation coefficient of Treynor ratio and Jensen’s alpha (TZ); the correlation coefficient of Treynor ratio and information ratio (TI); the correction of Sharpe ratio and Jensen’s alpha (SZ); the correlation coefficient of Sharpe ratio and information ratio (SI); and the correlation coefficient of Jensen’s alpha and information ratio (ZI).
Step 6: Repeat step 2 to step 5 1,000 times, and calculate the mean and standard deviation of the six Pearson correlation coefficients.
Step 7: Change the number of the mock mutual funds
The simulation results are as shown in Figures 1 and 2. Obviously, from this two figures, we can easily draw the following two main conclusions:
(a) when the number of funds to be evaluated is small, the standard deviation of the Pearson correlation coefficient among the four indexes is very large. For example, when there are 10 funds, the standard deviation of the correlation coefficient of Treynor ratio and information ratio TI reaches 0.14, which means that the deviation between the correlation coefficient calculated with (small) samples and the truth may be large. Therefore, it is unreasonable to use the correlation coefficient among the special evaluation results of indexes in CR method especially when the number of funds is small (small sample case), which has a large random error;
(b) as the number of mock mutual funds need to be evaluated increases, the standard deviation of the Pearson correlation coefficient among all indexes decreases. For example, when the number of mock funds is only 10, the standard deviation of the correlation coefficient TZ between Sharpe ratio and Treynor ratio under 1,000 Monte Carlo simulations is about 0.047. When the number of funds reaches to 50, the corresponding standard deviation is reduced to 0.015. Moreover, when the number of funds is about 200, the standard deviation is reduced to 0.005. This means that the use of large sample correlation instead of statistical correlation is reasonable in practice, because when the number of funds to be evaluated is enough, the low standard deviation indicates that the random error of using large samples correlation to approximate statistical correlation is very small. This also shows that the random error of using CR method is small when the number of funds need to be evaluated in practice is large (e.g., 100 funds) and thus feasible.
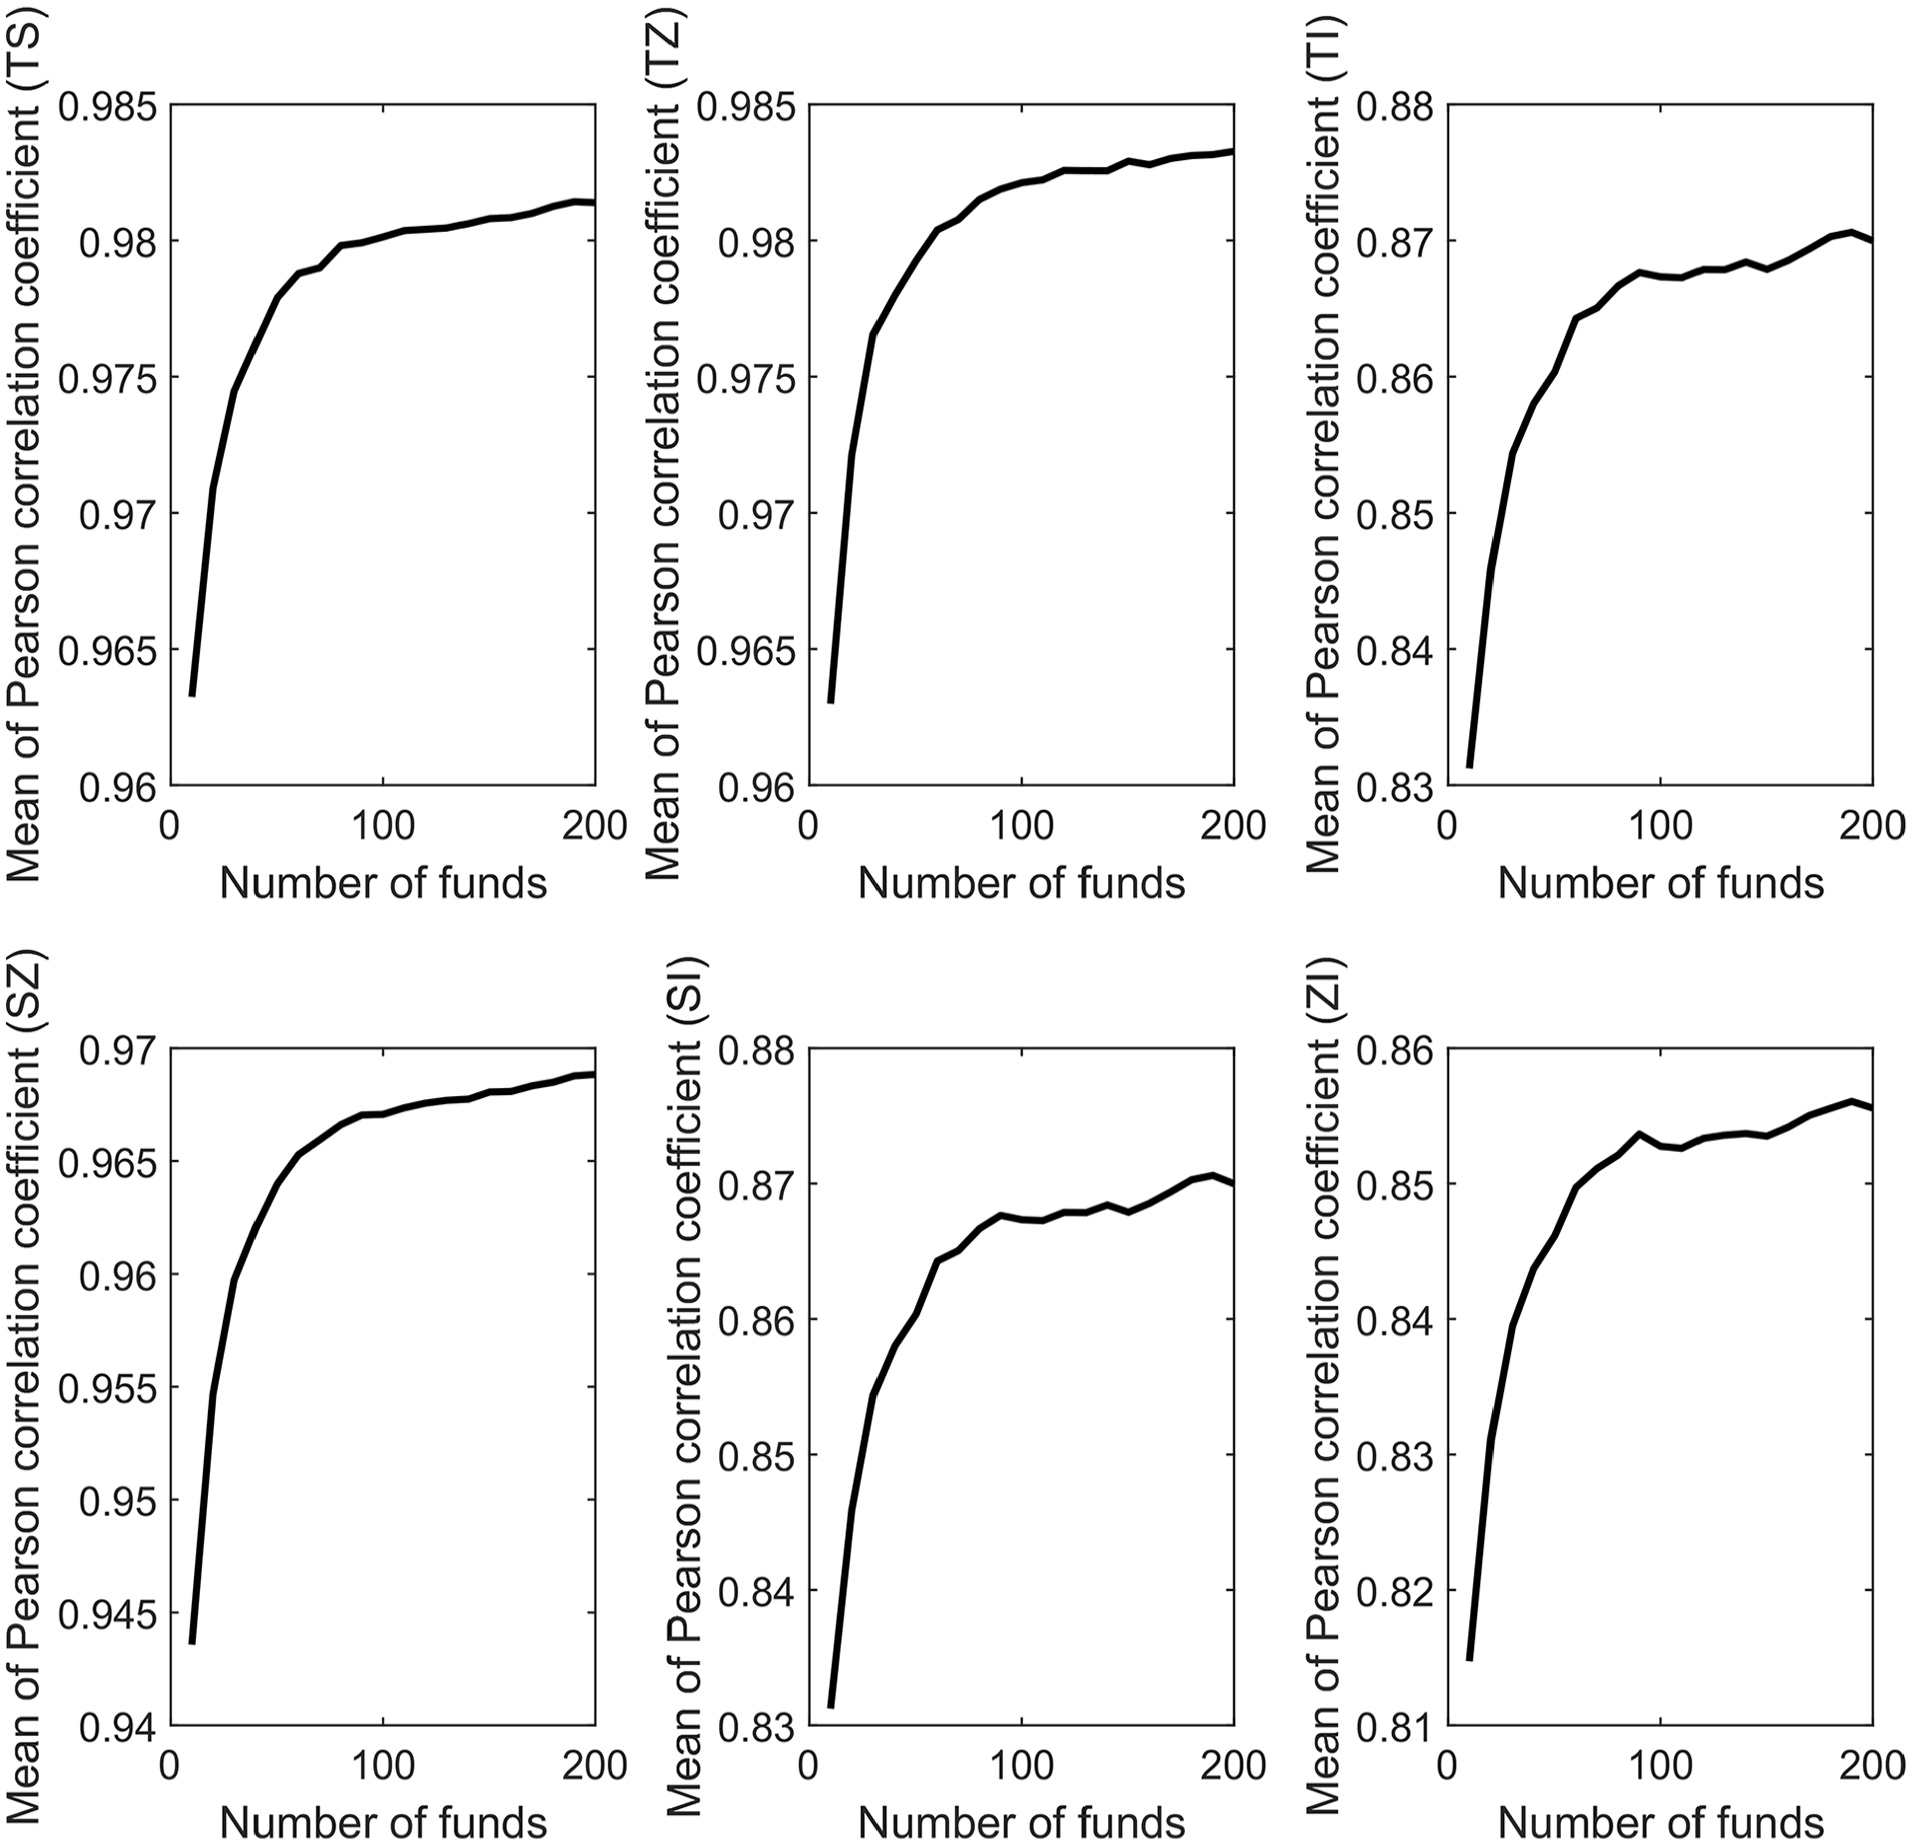
Mean of Pearson correlation coefficients among Jensen’s alpha, Sharp ratio, information ratio, and Treynor ratio for 10 to 200 mock funds with 1,000 Monte-Carlo runs.

Std. of Pearson correlation coefficients among Jensen’s alpha, Sharp ratio, information ratio, and Treynor ratio for 10 to 200 mock funds with 1,000 Monte-Carlo runs.
Empirical Results
Data and Alternative Methods
Data on mutual funds are from Wind database, including net data of 637 active equity mutual funds in China from January 1, 2019 to December 31, 2021. The resulting data set might have survivor ship bias since the fund samples did not change during the study period. However, we focused on how ranks change according to performance metrics rather than mutual funds, so the selection of data set should not affect the final ranks. Actually, the common way is to select mutual funds which are alive over the whole period.
The benchmarks considered in this experiment include Shanghai Composite Index (SCI), Shanghai Stock Exchange 50 Index (SSE50), and China Securities Index 300 (CSI300). The risk-free rate is selected as 3% which appropriates to the Chinese 10-year Treasury bonds rate.
After consideration, it is decided that a total of 17 indexes that are wildly used in the literature should be selected to compare with that of our proposed method, including 11 risk adjusted return based performance measures including SR, DSR, ASR, TR, IR, JA, MJA, OSR, SoR, CR, and BR (see Ornelas et al., 2012 for details), 2 indicators reflecting timing ability including HM and TM coefficients (see Elton & Gruber, 2020 for details), SCT to test performance persistence (Cogneau & Hübner, 2009), and 3 commonly used multi-index ranking methods including SM, PCA, and TOPSIS (see Chang et al., 2010 for details). In addition, the proposed paired competition based mutual fund comprehensive ranking method is abbreviated as PC here. The four multi-index approaches are all based on the measurements of 14 single index measures.
In order to consider the influence of different weights in TOPSIS and PC methods, we choose MW, CR, and the proposed MCR approaches to compare the ranking results.
To test whether different metrics give different evaluation results/ranks, we calculated the percentage change in ranking and two correlation coefficients among the ranks obtained by different metrics. The top 2 popular approaches used to compare ranks are the Kendall’s tau and the Pearson correlation coefficient.
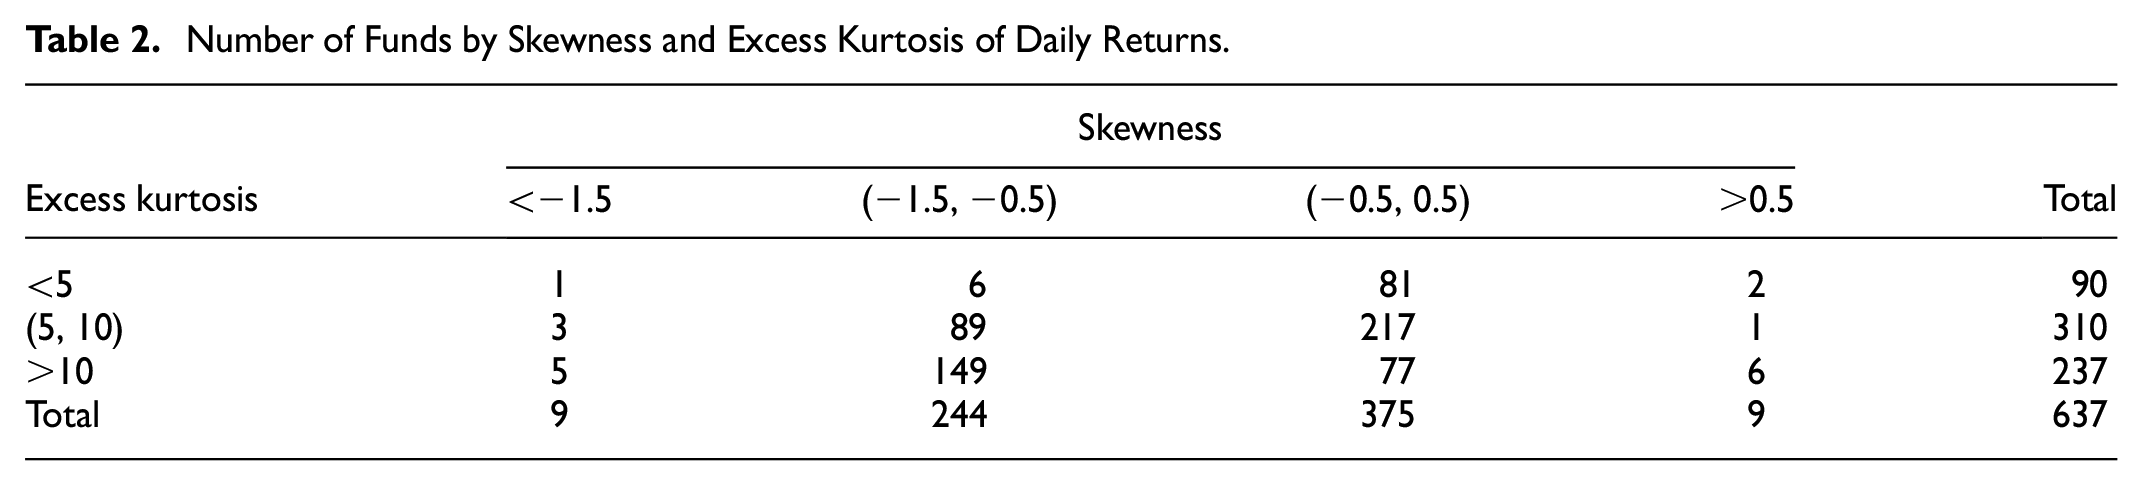
Table 1 shows the mean return, standard deviation, skewness, and kurtosis for each fund of daily/weekly/monthly data. These moments will be used in the calculation of some measures. The data reveals that, on average, skewness and excess kurtosis were negative. This confirm the hypothesis that returns may follow a non-normal distribution and thus emphasizing the need for metrics that go beyond the Sharpe ratio. Tables 2 to 4 show that almost all 637 mutual funds have negative skewness and excess kurtosis whether using daily, weekly, or monthly data.
Mean Return, Standard Deviation, Skewness, and Kurtosis of the Distribution of Returns for 637 Funds.

Number of Funds by Skewness and Excess Kurtosis of Daily Returns.
Number of Funds by Skewness and Excess Kurtosis of Weekly Returns.

Number of Funds by Skewness and Excess Kurtosis of Monthly Returns.

Ranking Comparison
In order to obtain the correlation coefficients of ranks provided by different ranking methods, we randomly select 20 and 100 mutual funds to sort them respectively. For each fixed number of funds, we have done 1,000 Monte Carlo runs. Tables 5 and 6 show the averages of the correlation coefficients among the ranks when using 18 methods to evaluate/rank 20 and 100 mutual funds respectively, and the standard deviation of these correlation coefficients under 1,000 Monte Carlo runs. It should be noted that mean weight method is used here for all methods to obtain the results.
Average Pearson Correlation Coefficient and Corresponding Std. Among the Results of 18 Methods for Randomly Selected 20 Funds.

Average Pearson Correlation Coefficient and Corresponding Std. Among the Results of 18 Methods for Randomly Selected 100 Funds.
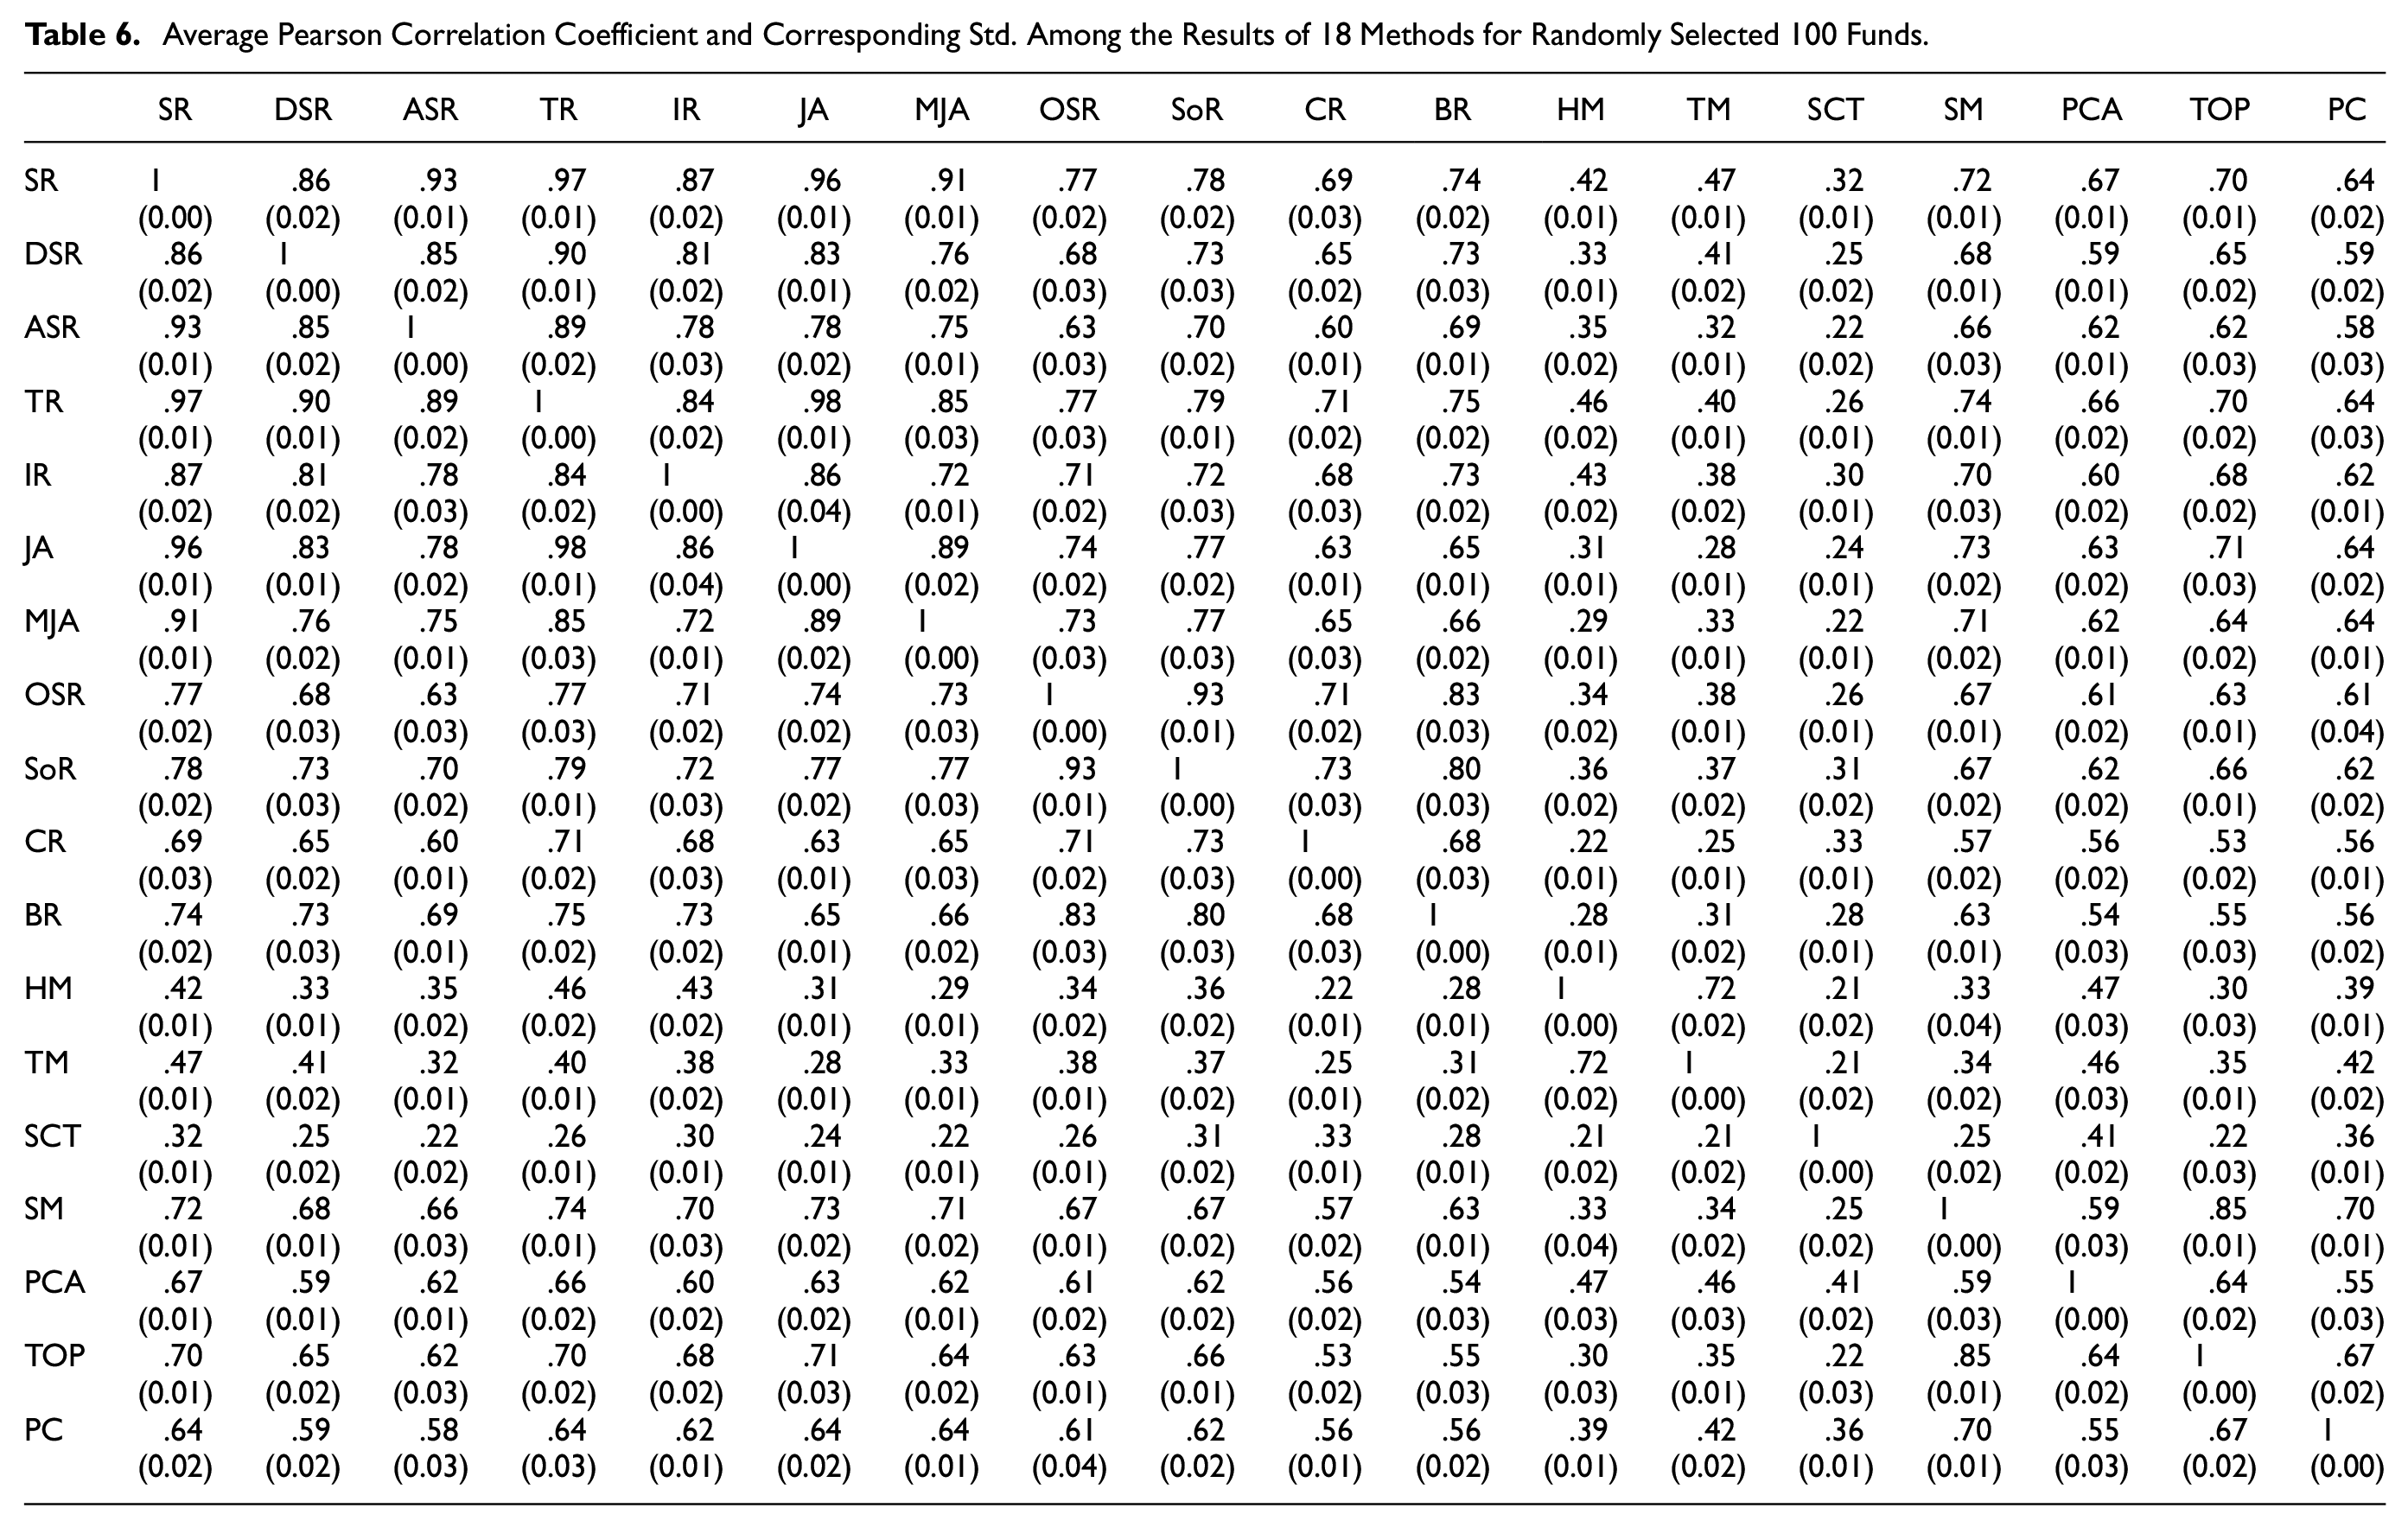
From Tables 5–6, we can obviously find that: (a) different evaluation/ranking methods will produce different evaluation results/ranks for mutual funds. The Pearson correlation coefficient of the same kind of methods is higher than that of the methods of different classes. For example, the average correlation coefficient of results between Sharpe ratio and Treynor ratio is more than 0.9, while that between Sharpe ratio and HM coefficient is only about 0.4; (b) the correlation coefficient between the four multi-indexes ranking methods and the other 14 single index methods is relatively low, generally less than 0.7. This is because that multi-indexes method integrates the characteristics of multiple single index methods and can reflect the comprehensive performance of different aspects of the funds; (c) PCA method naturally takes into account the correlation of indicators. Therefore, compared with other multi-indexes approaches using mean weight method, PCA method has little difference in ranking correlation with each single index; (d) with the increase of the number of funds to be evaluated, the standard deviation of the correlation among the indicators decreased significantly, which indicates that the error using the correlation coefficient of evaluation results of funds with small sample number to replace the statistical correlation coefficient among indexes is large. In addition, when the number of funds to be evaluated is large, for example, 100 funds, the standard deviation of correlation coefficients become very low, which means that it is reasonable to use large sample correlation coefficient instead of statistical correlation coefficient. This is the original intention of our MCR method; (e) the ranking correlation of our proposed method and other multi-indexes methods (SM, PCA and TOPSIS) which also integrates multiple single index results is a bit small (less than 0.7). The reason is that, compared with other multi-indexes methods, our method not only uses the individual evaluation information given by 14 single indicators, but also uses the paired comparison information of these measures.
According to the results in Tables 5 and 6, it is still not clear that whether different methods give different ranks or not. To solve this problem, we count the change in the position of each fund based on all approaches and the proposed method is viewed as the benchmark. We calculate the mean absolute change, the maximum downward movement, the maximum upward movement in the ranks, and the standard deviation of them. Results appear in Tables 7 to 9.
Changes With Respect to the Proposed PC Method for Randomly Selected 50 Funds.

Note. The mean weight (MW) method is used for TOPSIS and PC.
Changes With Respect to the Proposed PC Method for Randomly Selected 50 Funds.

Note. The CRITIC (CR) method is used for TOPSIS and PC.
Changes With Respect to the Proposed PC Method for Randomly Selected 50 Funds.
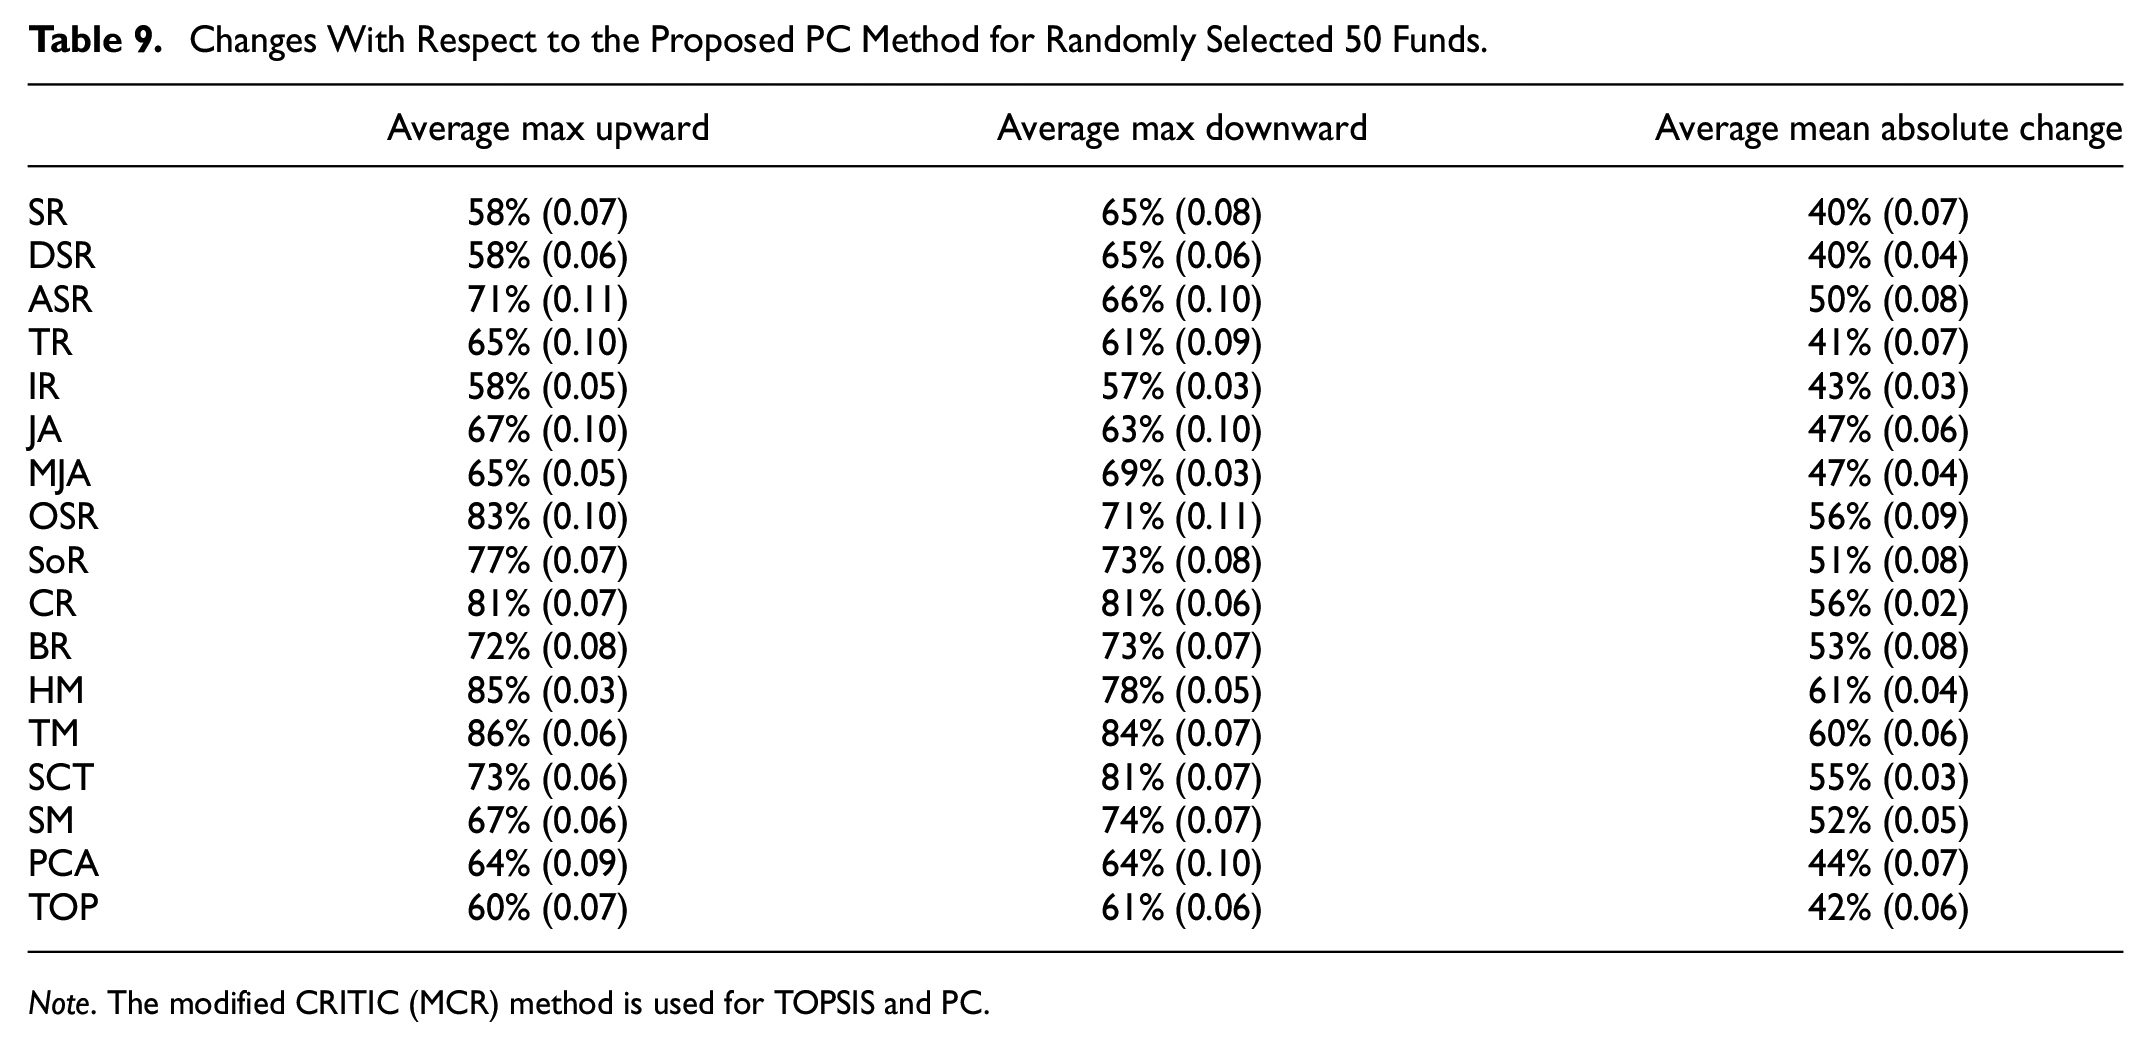
Note. The modified CRITIC (MCR) method is used for TOPSIS and PC.
It could be seen from Tables 7 to 9 that (a) compared with the MW method (illustrate in Table 10), CRTIC and MCR based PC methods take the index correlation into account, which make the difference of percentage rank changes between PC and other single measures smaller. This is because that weight method considers the correlation of indicators that improves the weight of “out of group” indicators; (b) compared with the multi-indexes method based on MW and MCR, the standard deviation of percentage rank changes between PC (with CRTIC) and other single measure that becomes larger. This is because that the indexes weights will change greatly in each Monte Carlo run when the number of funds to be evaluated is small, which will bring additional random error. In addition, Tables 7 to 9 also present that the ranks of our proposed PC method and other single index measures have significant difference, for example, the average max upward and the average max downward values are all above 50% and some even exceed 80%. Moreover, compared to other multi-indexes ranking method, the average max upward and the average max downward values are also more than 50%. These data show that, compared with the single index method, the proposed PC method that combines multiple aspects will bring different ranking results, and compared with the other multi-indexes methods, PC method will also produce significantly different ranking results since comparison information are used.
Mean and Std. of Pearson and Kendall’s Tau Correlation Coefficients Between 17 Performance Evaluation Results in Sample (3 or 6 Months Samples) and Sharpe Ratios Out of Sample (3 or 6 Months Samples) With Respect to All the 637 Funds.

Note. The modified CRITIC (MCR) method is used for TOPSIS and PC.
In order to further demonstrate the difference between CRITIC method and MCR method, it is wise for us to consider the correlation coefficients change of the results given by the two methods with the change of the number of funds to be evaluated. The results are shown in Figure 3. It can be seen from Figure 3 that with the increase of the number of funds to be evaluated/ranked, the Pearson and Kendall correlation coefficients of the results provided by CR and MCR based PC method will become greater and greater. This suggests that if the number of funds is large in practice, it is also appropriate to use the original CR method.

Mean and std. of Pearson and Kendall correlation coefficients of the results provided by CR based PC method and MCR based PC method with the number of fund increases from 5 to 200.
Out of Sample Test
To verify the effectiveness and to illustrate the predictive ability of our PC-RV method out of sample, we first use 16 existing methods and our PC-RV method to rank the performance of all funds in sample, and then use Sharpe ratio to rank the performance of all funds out of sample. In addition, we use the sliding window method for out of sample testing. The sample period is set to 3 or 6 months and the window width is set to 1 month. Finally, the mean and standard deviation of Pearson and Kendall’s tau correlation coefficients between 17 performance evaluation results in sample and Sharpe ratios out of sample with respect to all 637 funds, which are calculated and shown in Table 10. Average ranking changes and corresponding std. between 17 performance evaluation results in sample and Sharpe ratios out of sample with respect to all 637 funds are calculated and shown in Table 11.
Average Ranking Changes and Corresponding Std. Between 17 Performance Evaluation Results in Sample (3 or 6 Months Samples) and Sharpe Ratios Out of Sample (3 or 6 Months Samples) With Respect to All the 637 Funds.

Note. The modified CRITIC (MCR) method is used for TOPSIS and PC.
It could be seen from Table 10 that (a) compared with all the 13 single-indicator based methods, the mean of Pearson and Kendall’s tau correlation coefficients between performance evaluation results provided by four multi-indicator based methods (SM/PCA/TOP/PC) in sample and Sharpe ratios out of sample are higher which show that the multi-indicator based comprehensive ranking method have better prediction ability; (b) compared with other three multi-indicator based methods (SM/PCA/TOP), the mean of Pearson and Kendall’s tau correlation coefficients between performance evaluation results provided by our PC-RV method (PC) in sample and Sharpe ratios out of sample are higher which shows that our PC-RV method has the best prediction ability of all multi-indicator based methods; (c) compared with the single-indicator based methods, the standard deviation of Pearson and Kendall’s tau correlation coefficients between performance evaluation results provided by four multi-indicator based methods (SM/PCA/TOP/PC) in sample and Sharpe ratios out of sample are smaller which shows that the multi-indicator based comprehensive ranking method is more stable; (d) compared with other 16 methods, the standard deviation of Pearson and Kendall’s tau correlation coefficients between performance evaluation results provided by our PC-RV method (PC) in sample and Sharpe ratios out of sample are smaller which shows that our PC-RV method is the most stable one of all methods. In additional, Table 11 demonstrates almost the same results. The above phenomena verified that our PC-RV method is more predictive and stable.
Here, we summarize some significant advantages of our proposed method over previous studies based on the empirical results.
(a) the proposed method is a multi-indexes comprehensive ranking method which can reflect different mutual funds performance aspects. While in previous studies, different single-index based evaluation methods produced different results for mutual funds only from one special aspect. In addition, the correlation coefficient among our methods and the previous 14 single index methods is relatively low, generally less than 0.7. This is because that our method integrates the characteristics of multiple single index methods and can reflect the comprehensive performance of different aspects of the funds;
(b) the proposed method makes good use of both individual evaluation information and joint comparison information, and thus reveals some deep insight about the fund performance which cannot be revealed by other individual information based multi-indexes based methods. the ranking correlation of our proposed method and other previous multi-indexes methods (SM, PCA, and TOPSIS) which also integrates multiple single index results is a bit small (less than 0.7). The reason is that, compared with other multi-indexes methods, our method not only uses the individual evaluation information given by previous 14 single indicators, but also uses the paired comparison information of these old measures.
(c) the proposed unified formulation of C-score allows the absence (non-existing or missing) of some evaluation data, allows the existence of different types of data and avoids data standardization which may be unseasonable in some situation. These make the proposed ranking method more flexible and practicable. In previous studies, they need to deal with these special data in some special way, while the process may be arbitrary and controversial.
(d) the proposed method is very convenient for practical application because it only needs to find the eigenvector corresponding to the maximum eigenvalue of the C-matrix. However, in previous studies, such as PCA and TOPSIS methods, the calculation process is relatively complex.
Conclusions
This paper first develops paired competition based ranking scheme for solving mutual funds comprehensive ranking problem. Compared with arbitrary single index, our method increases the stability and reliability of the final rank. The proposed method is a multi-index comprehensive ranking method which can reflect different mutual funds performance aspects. The proposed method makes good use of both individual evaluation information and joint comparison information, and thus reveals some deep insight about the fund performance which cannot be revealed by other individual information based multi-indexes based methods. The ranking result given by the ranking vector only depends on the Compete matrix and is independent of the prior goodness. Thus, the final ranking vector makes full use of the comparison information and exploits the Compete matrix well. Moreover, the proposed unified formulation of Compete score allows the absence of some evaluation data, allows the existence of different types of data and avoids data standardization which may be unseasonable in some situation. These make the proposed ranking method more flexible and practicable. In additional, this paper proposes a modified CRITIC method to determine the weight of each single index when a multi-indexes ranking approach is considered for use. Our work have demonstrated that the proposed MCR method is more reasonable than the original CRITIC method even when only a few funds need to be ranked. Note that, our approach is very convenient for practical application because it only needs to find the eigenvector corresponding to the maximum eigenvalue of the Compete matrix. Finally, this paper provides abundant empirical results to verify the rationality and robustness of the proposed methods.
The works in this paper still have some limitations and need to be further studied in the future work. First, the difference between our method and the existing method in the degree of information utilization has not been clearly quantified theoretically, and we have not been able to quantify the performance superiority of the proposed method compared with the existing multi-indexes based methods. In view of this problem, we will consider designing a reasonable metric to describe the degree of information utilization and developing effective method to quantify the performance superiority of our method compared with the existing methods. In addition, due to the copyright problem of mutual fund data, the rationality and effectiveness of our method have only been verified in the Chinese market, and have not been further verified in other markets. In view of this limitation, we will consider seeking more evidence from multiple mainstream financial markets for demonstrating effectiveness of our method. Moreover, this paper has not studied whether our method can predict the future performance of the fund. In the future work, we will test the performance prediction ability of our method through the out of sample mutual fund data. In fact, our method is a more general multi-attribute decision-making method, which can be used not only to evaluate the performance of mutual funds, but also to evaluate the performance of other financial assets with multiple indicators, such as the comprehensive evaluation of stock fundamentals. In the future research, we will consider extending this method to more comprehensive performance evaluation of various financial assets.
Footnotes
Declaration of Conflicting Interests
The author(s) declared no potential conflicts of interest with respect to the research, authorship, and/or publication of this article.
Funding
The author(s) received no financial support for the research, authorship, and/or publication of this article.