
Abstract
Loneliness is a common concern among university students, as these individuals experience many of the risk factors associated with loneliness. This experience of loneliness tends to lead to numerous consequences such as negative self-evaluations, anxiety, and depression, which in turn lead to impaired concentration and a decline in academic motivation and performance. The overarching aims of this study were to identify the predictor variable(s) or combination of predictor variables, namely self-esteem, interpersonal communication competence, and media and technology usage, that explain a significant percentage of the variance in loneliness amongst undergraduate university students, as well as to investigate whether differences exist in loneliness with regards to gender, ethnicity, and generational status. The sample consisted of 1,191 South African undergraduate university students between the ages of 18 and 30. This study was non-experimental in nature and a correlational research design was used. The results indicated that the combination of the independent (predictor) variables accounted for 51.9% of the variance in the Loneliness scores of the sample. Interpersonal Communication Competence and Self-esteem served as statistically and practically significant individual predictor variables of the students’ loneliness. Male students and first-generation students tend to be lonelier than female students and non-first-generation students, respectively.
Keywords
Introduction
Loneliness is a distressing emotional state when there is an inconsistency between what an individual desires or perceives from social relationships and what the objective reality of the individual’s social relationships is (Bhagchandani, 2017; Cornwell & Waite, 2009; Doman & Le Roux, 2012; Le Roux & Connors, 2001). However, all individuals tend to suffer from loneliness at some point during their lives (Cacioppo et al., 2002; Holt-Lunstad et al., 2015; Luhmann & Hawkley, 2016; Rahman et al., 2017). Human beings have always been social creatures with an innate need to be socially included and to belong in a group; preferring to spend quality time—about 80% of their waking hours—with others above spending time alone (Baumeister & Leary, 1995; Cacioppo et al., 2009; Hendrick, 2004; Rokach, 2011, 2018). Therefore, it is no surprise that when quality interactions are lacking within social settings, people experience social pain in the form of loneliness (Cacioppo et al., 2015; Kahneman et al., 2004).
Loneliness Amongst University Students
Despite all individuals suffering from loneliness at some point during their lives, research has found that loneliness is becoming more prevalent amongst young adults (Mental Health Foundation, 2010; Office for National Statistics, 2018; Peltzer & Pengpid, 2017) and specifically university students (Jordaan & Le Roux, 2004; Knox et al., 2007; Peltzer & Pengpid, 2017). Due to the pervasiveness and increasing rate of loneliness in university populations globally, researchers have identified a gap in literature pertaining to loneliness; advocating for loneliness to be studied as a concept on its own rather than merely a symptom of a specific pathology such as anxiety and depression (Mund et al., 2019; Rahman et al., 2017). Moreover, this research gap has further widened due to the general problem of the experience of loneliness taking on a specific nature when considering the population of university students, mainly due to researchers advocating that loneliness should be labeled as a public health problem, especially in university populations, in order to investigate causes of and find solutions for this phenomenon (Cacioppo & Cacioppo, 2018; Feng et al., 2019; Holt-Lunstad et al., 2015). University students are more susceptible to developing feelings of loneliness due to various risk factors (Doman & Le Roux, 2012; Le Roux & Connors, 2001; Schiau, 2016; Seepersad, 2005; Stankovska et al., 2016). These risk factors include over usage of media and technology (Doman & Le Roux, 2012), poor interpersonal communication competence (Schiau, 2016), and low self-esteem (Cacioppo et al., 2009). Technology is a crucial part of university students’ existence, as it influences how this population communicates with others and how they view themselves in light of others (Jia et al., 2018; Rahman et al., 2017). Also, students who are less competent in interpersonal communication often have lower self-esteem (Joinson, 2004), which has been shown to predict loneliness (Al Khatib, 2012; Cacioppo et al., 2009). In South Africa, approximately 1,060,312 students are enrolled at the 26 public universities, with more or less 2,08,308 students being first-generation students. These university students are at a higher risk of experiencing loneliness when entering university (Doman & Le Roux, 2012; Schiau, 2016; Seepersad, 2005; Stankovska et al., 2016). International studies show that many university students tend to experience loneliness (Barreto et al., 2021; Knox et al., 2007; Özdemir & Tuncay, 2008; Soares et al., 2012) and with a considerable increase in loneliness from 2014 to 2018 in university students as well as a higher prevalence rate of loneliness among young people during the COVID-19 pandemic (Barreto et al., 2021). This higher rate of loneliness therefore indicates a need for the development of preventive interventions in the student population, and that embarking on studies with regards to loneliness therefore remains relevant and essential (Hysing et al., 2020) Loneliness amongst South African university students is also a concern (Doman & Le Roux, 2012; Pretorius, 1993), with 56.4% of South African students experiencing some level of loneliness, ranging from somewhat lonely (28.7%) to high levels of loneliness (16.2%) and “mostly” (11.5%) feeling lonely (Peltzer & Pengpid, 2017).
Although literature regarding loneliness in South Africa exists, few studies focus on university students, except for studies conducted by Le Roux (Doman & Le Roux, 2012; Jordaan & Le Roux, 2004; Le Roux, 1998; Le Roux & Connors, 2001). Loneliness amongst university students is a cause for concern, as research found that a lack of social and emotional support in terms of intimate relationships at university leads to an array of consequences, including affecting students’ mental health and academic performance (Barreto et al., 2021; Rahman et al., 2017; Victor & Yang, 2012). Due to these debilitating effects in university students, loneliness is an important concept to study, as the tertiary education of a country also affects that country’s future labor force (Spaull, 2013; Von Soest et al., 2020). If loneliness, therefore, contributes in some way to students not being able to thrive at university or complete their degree, these students will not be able to successfully join the workforce and contribute to the economy (Spaull, 2013; Von Soest et al., 2020). As a result, an opportunity exists to contribute to loneliness literature in the specific context of South African university students. Thus, this study aims to address the specific problem of loneliness amongst university students and which predictor variable(s) or combinations of predictor variables are the best predictors of loneliness amongst this specific population.
Loneliness and Media and Technology Usage
The relationship between media and technology usage and loneliness is interesting, as studies have shown that loneliness is often both the cause and the consequence of excessive media and technology engagement, such as internet usage (Bozoglan et al., 2013; Kim et al., 2009; Stankovska et al., 2016). University students are significant users of media and technology, with 82% of individuals aged between 18 and 29 frequently engaging with social networks, such as Facebook (Duggan, 2015; Quan-Haase et al., 2002) to connect with others and to seek some form of social support (Jia et al., 2018). Ironically, despite the constant connectedness in their lives, research has shown that university students tend to be the loneliest age group in comparison to other age groups (Pittman & Reich, 2016). As a result of the high volumes of interaction with these media and technology types, there is a decline in students’ face-to-face interaction (Brignall & Van Valey, 2005) and their levels of internet addiction tend to increase (Stankovska et al., 2016). This may be a cause for concern, as visual and auditory cues found in face-to-face communication are often limited in online communication, which results in a lack of specific skills (such as cultural, normative communication, and civility skills) needed to interact with others successfully (Knapp & Daly, 2002). These skills form an essential part of interpersonal communication competence, a crucial skill required for curbing loneliness (Knapp & Daly, 2002). However, recent studies during the COVID-19 pandemic have also found that not having online communication available, can enhance individual social isolation and therefore loneliness (Frissa & Dessalegn, 2020). Therefore, media and technology may also serve as an important method of combatting loneliness due to the social support it could provide (Frissa & Dessalegn, 2020).
Loneliness and Interpersonal Communication Competence
Poor interpersonal communication skills, which are often associated with technology usage, are also considered predictors of loneliness (Schiau, 2016). Interpersonal communication competence is “an impression or judgment formed about a person’s ability to manage interpersonal relationships in communication settings” (Rubin & Martin, 1994, p. 33). Humans are inherently social beings and require complex and well-developed interpersonal communication skills to maintain social relationships (Cacioppo et al., 2009; Knapp & Daly, 2002) and to combat loneliness (Knapp & Daly, 2002). Studies indicated that interpersonal communication competence is a predictor of increased social support and relational satisfaction within individuals (Apker et al., 2003; Lei et al., 2018. Contrastingly, university students indicating higher levels of loneliness also reported a lack of skills to build successful and fulfilling relationships with others, therefore, lacking communication competence (Wright et al., 2013). Consequently, this leads to a lack of belonging and feelings of a lack of support and intimacy, which in turn leads to loneliness (Doman & Le Roux, 2012). The interaction between loneliness and interpersonal communication competence is, therefore, a reciprocal relationship. Lonely people are also often less sociable than their less-lonely counterparts (Doman & Le Roux, 2012; Schiau, 2016) and often have lower self-esteem (Al Khatib, 2012; Cacioppo et al., 2009; Joinson, 2004).
Loneliness and Self-esteem
Self-esteem usually correlates negatively with loneliness (Davis et al., 1992; Lasgaard & Elklit, 2009; Mahon et al., 2006; McWhirter, 1997) because individuals with low self-esteem lack the necessary confidence to socialize with others and the ability to consequently curb their loneliness (Al Khatib, 2012; Baumeister & Vohs, 2018). Therefore, self-esteem may also be considered a possible predictor of loneliness. Self-esteem is regarded as an essential part of mental health (Amato, 2017; Mann et al., 2004) and is either a positive or negative mentality an individual holds toward him- or herself (Kohn, 1994; Rosenberg, 1965). Low self-esteem in university students includes negative evaluations of their appearance and behavior (Rahman et al., 2017). As a result, individuals with low self-esteem tend to isolate themselves and avoid social contact (Keane & Loades, 2017). These feelings often keep individuals from building meaningful social relationships, which, in turn, results in these individuals feeling lonely (Keane & Loades, 2017; Mahon et al., 2006).
Loneliness and Gender
Although the evidence is mixed, most studies have found some form of a connection between gender and loneliness (Cacioppo et al., 2009; Tilvis et al., 2011). Some studies on student populations found that female students tend to experience loneliness more than male students (Al Khatib, 2012; Page & Cole, 1991). Contrastingly, other studies on university students found that male students tend to be lonelier than their female counterparts (Deniz et al., 2005; Yang, 2009). Some studies were unable to prove any significant gender differences between loneliness in males versus females (Al-Kfaween, 2010; Archibald et al., 1995; Knox et al., 2007). These results could be explained by social relationships, where female students generally have larger social networks and participate in these networks more frequently than male students. However, female students also prefer greater interpersonal connectedness and are therefore affected to a greater extent by poor social connections (Liu et al., 2020).
Loneliness and Ethnicity
Ethnicity is an important determinant of loneliness, as South African studies found that people of color (known as “Colored” in South Africa) and Black individuals are more inclined to experience loneliness than their White counterparts (Groenewald, 1998; Jordaan & Le Roux, 2004; Mullett, 2002; Young & Strelitz, 2014). Ethnicity seems to play a potential role in the experience of loneliness within different ethnic groups (Le Roux & Connors, 2001; Mullett, 2002; Rokach & Brock, 1997). Usually this difference in loneliness within ethnic groups may possibly be due to less emphasis being placed on social relationships in the Western culture, as they focus more on a sense of individualism, while African (“Black”) cultures are considered to be more collectivistic in nature (Groenewald, 1998). The collectivist cultures, therefore, ensure more socially-intimate and fulfilling relationships, which acts as a protective factor against developing loneliness (Groenewald, 1998; Young & Strelitz, 2014). However, higher loneliness among minorities may be due to a reflection of the prejudice these groups often experience within numerous setting (Dovidio et al., 2002).
Loneliness and Generational Status
First-generation university students do not develop peer support and meaningful social relationships as successful as non-first-generation students, which leads to a lack of belonging and social fulfillment and, ultimately, loneliness (Huerta & Fishman, 2014; Rayle & Chung, 2008). This could be due to the fact that first-generation students often experience higher levels of stress and depression compared to non-first-generation students, which leads to a sense of isolation (Stebleton et al., 2014). Furthermore, first-generation students often face many challenges related to family, social, cultural and academic issues and transitions. This often leads to a lack of belonging, which can lead to feelings of depression and loneliness (Jehangir, 2010).
Methodology
Research Design
The study was quantitative and non-experimental in nature and used a correlational research design (Stangor, 2015). This type of research design investigates the possible statistically significant correlations (interactions) between selected measurable variables, which for this study included loneliness, self-esteem, interpersonal communication competence and media and technology use. Furthermore, the study also investigated the correlations between loneliness and biographical factors such as gender, age, religious affiliation, religious practice, ethnicity, and generation of students.
Participants and Sampling
A non-probability sampling technique, more specifically, convenience sampling (Stangor, 2015), was used, and data were collected voluntarily from university students. The sample consisted of 1,191 South African undergraduate university students aged between 18 and 30. This sample was primarily female (n = 923; 77.5%), with only 22.5% of the sample being male (n = 268). The average age of the participants was 22.12 years (SD = 2.65). In terms of ethnicity, 80.7% (n = 961) of the sample identified as Black, 12.8% (n = 153) identified as White, 4.1% as People of Color/“Colored” (n = 49), and 1.3% identified as Indian (n = 4). Furthermore, only 0.1% of the sample identified as Asian (n = 1) and 1.9% (n = 23) of participants were of other ethnicities. The spread of students between first-generation and non-first-generation was more or less evenly dispersed, with 54.7% of respondents being non-first-generation students (n = 652) and 45.3% being first-generation students (n = 539).
Measures
Five measuring instruments were employed to gather the data from the participants. Participants were invited to voluntarily partake in the research at their own leisure based on their availability at the time, as well as their accessibility to the research material via the online student support platform, Blackboard.
Demographic information: In order to obtain demographic information (e.g., gender, age, ethnicity, generational status), participants were required to complete a self-compiled biographical questionnaire.
Loneliness: In order to measure loneliness, the Le Roux Loneliness Questionnaire (Le Roux, 1992) was used. This scale operationalizes loneliness by focusing on varying dimensions of loneliness. The questionnaire consists of 30 items, with 15 positive and 15 reverse-scored items on a Likert-type scale. Sample items include negative statements such as “I feel forgotten” and “I am not close to anyone,” as well as positive statements such as “I am a very happy person,” and “I feel part of a group of friends.” Participants were required to respond in terms of the extent to which they agree with the statements, ranging from “always” (4) to “never” (1). A high score on this scale would indicate higher levels of loneliness. Internal consistencies (Cronbach’s alpha coefficient) identified for this scale ranged between .87 and .88 (Jordaan & Le Roux, 2004; Le Roux, 1992, 1998, 2002; Scholtz, 1995).
Media and Technology Usage: The Media and Technology Usage and Attitudes Scale (MTUAS) (Rosen et al., 2013) was used to measure the usage of media and technology. The scale concentrates on interaction with various media platforms, such as online networking, cell phones, and computers (Rosen et al., 2013). The MTUAS is a 60-item measuring instrument which includes 15 subscales. For this study, the attitudes subscales were excluded from the questionnaire, as the focus was on media and technology usage specifically. The usage scale, therefore, includes 44 items comprising of 11 subscales. These subscales include Smartphone Usage, General Social Media Usage, Internet Searching, E-mailing, Media Sharing, Text Messaging, Video Gaming, Online Friendships, Facebook Friendships, Phone Calling, and TV Viewing. However, for this study, the MTUAS subscales were grouped into three dimensions, namely (i) Media usage for social engagement (Online friendships, Facebook friendships), (ii) Media usage for communication (E-mailing, Text messaging, Phone calling, Smartphone usage, Media sharing), and (iii) Media usage for leisure (TV viewing, Internet searching, Video gaming, General social media usage). A 10-point Likert-type scale for items 1 to 40 ranging from “never” (1) to “all the time” (10), is used for respondents to indicate how often they use each of the different types of technology included within the scale (Rosen et al., 2013). Sample items include “Check for text messages on a mobile phone” and “browse the web on a mobile phone,” as well as “Search the internet for videos on any device” and “Comment on postings, status updates, photos, etc.” For items 41 to 44, a nine-point Likert-type scale is used for respondents to quantify their number of friends on social media, as well as how many of these friends are merely online friends versus friends they have met face-to-face. These answers range from “0” (1) to “751 or more” (9). Internal consistencies for the MTUAS subscales have been identified as ranging between 0.52 and 0.89 (Özgür, 2016; Van Tonder, 2017). Media and technology usage to a substantial and consistent degree would be indicated by a high score (Rosen et al., 2013).
Interpersonal Communication Competence: To measure interpersonal communication competence, the Interpersonal Communication Competence Scale (ICCS; Rubin & Martin, 1994) was used. The scale consists of 30 items on a six-point Likert-type scale that range from “almost always” (5) to “almost never” (0), with 24 positive and six reverse-coded items. Sample items include “I can put myself in others’ shoes,”“I reveal how I feel to others,” as well as questions such as “I can persuade others to my position” and “I express myself well verbally.” When applied to student populations, the scale demonstrated internal consistencies ranging between 0.77 and 0.86 (Rubin & Martin, 1994; Van Tonder, 2017). A high score would indicate high interpersonal communication competence (Rubin & Martin, 1994).
Self-esteem: The Rosenberg Self-esteem Scale (RSES; Rosenberg, 1965) was used to measure self-esteem. The scale measures both positive and negative feelings an individual experiences about themselves to obtain an idea of an individual’s global self-worth. The scale consists of 10 items on a four-point Likert-type scale that range from “strongly agree” (4) to “strongly disagree” (1), while items 2, 5, 6, 8, and 9 are reverse scored. Sample items include “At times I think I am no good at all,” as well as “I feel that I’m a person of worth, at least on an equal plane with others.” A high score would indicate higher levels of self-esteem, while a low score would indicate the opposite. The RSES presented with high levels of reliability, ranging from .77 to .88, in studies with university students (Arshad et al., 2015; Robins et al., 2001).
Procedure
This study was approved by the Institutional Review Board (IRB) at the authors’ affiliated university prior to data collection. To avoid harming participants, the principles of confidentiality, beneficence, and non-maleficence (to not inflict harm) were adhered to (Allan, 2016). Informed consent was obtained from all the participants, and the voluntary and anonymous nature of participation was discussed with participants before the onset of the research. The primary purpose of this research study was also explained to the participants before they agreed to participate. Following the data collection procedure, the anonymity of the participants was ensured by using a coding system. Although the measure was not made use of, a further precautionary and protective measure was implemented where participants were allowed to withdraw their participation and were referred for counseling to offset any complications (if any) that might have arisen or if participants experienced any form of distress as a result of their participation.
Analysis
The analysis of the data collected from participants was done using the Statistical Package for the Social Sciences (SPSS) version 27 (IBM Corporation, 2021). Descriptive statistics (mean, standard deviation, skewness, and kurtosis) for the scales and Pearson correlation coefficients were calculated to assess the distributional issues and relationships between variables. Hierarchical regression analyses were used to investigate the contribution of the different sets (combinations) of independent (predictor) variables (self-esteem, interpersonal communication competence, and media and technology usage) to the percentage of variance in the dependent (criterion) variable, loneliness, amongst university students, as well as the contribution of each of the individual independent variables. Lastly, a Factorial ANOVA was conducted to investigate whether there are any differences regarding loneliness when it comes to gender (male vs. female), ethnicity (Black vs. White), and generation (first-generation students vs. non-first-generation students). To interpret the practical significance of results, effect sizes (Steyn, 2005) were calculated. For correlations, an effect size of .10 is small, .30 is medium, and .50 is large. When performing a hierarchical regression analysis, an effect size of .02 is small, .15 is medium, and .35 is large. For differences, an effect size of .10 is small, an effect size of .25 is medium, and an effect size of .40 is large (Steyn, 2005). Both the 1%- and 5%-level of significance were used in the analyses of the data. Only results with medium to large effect sizes were focused on.
Results
Descriptive Analyses
The means, standard deviations, skewness, kurtosis, and the internal consistencies of the various subscales of the measuring instruments are reported in Table 1 for the total group of participants. Cronbach’s alpha coefficient (α) was calculated as an indication of the internal consistency of the subscales.
Descriptive Statistics and Reliability Coefficients for the Le Roux Loneliness Questionnaire, RSES, ICCS, MTUAS Subscales, and MTUAS Dimensions.
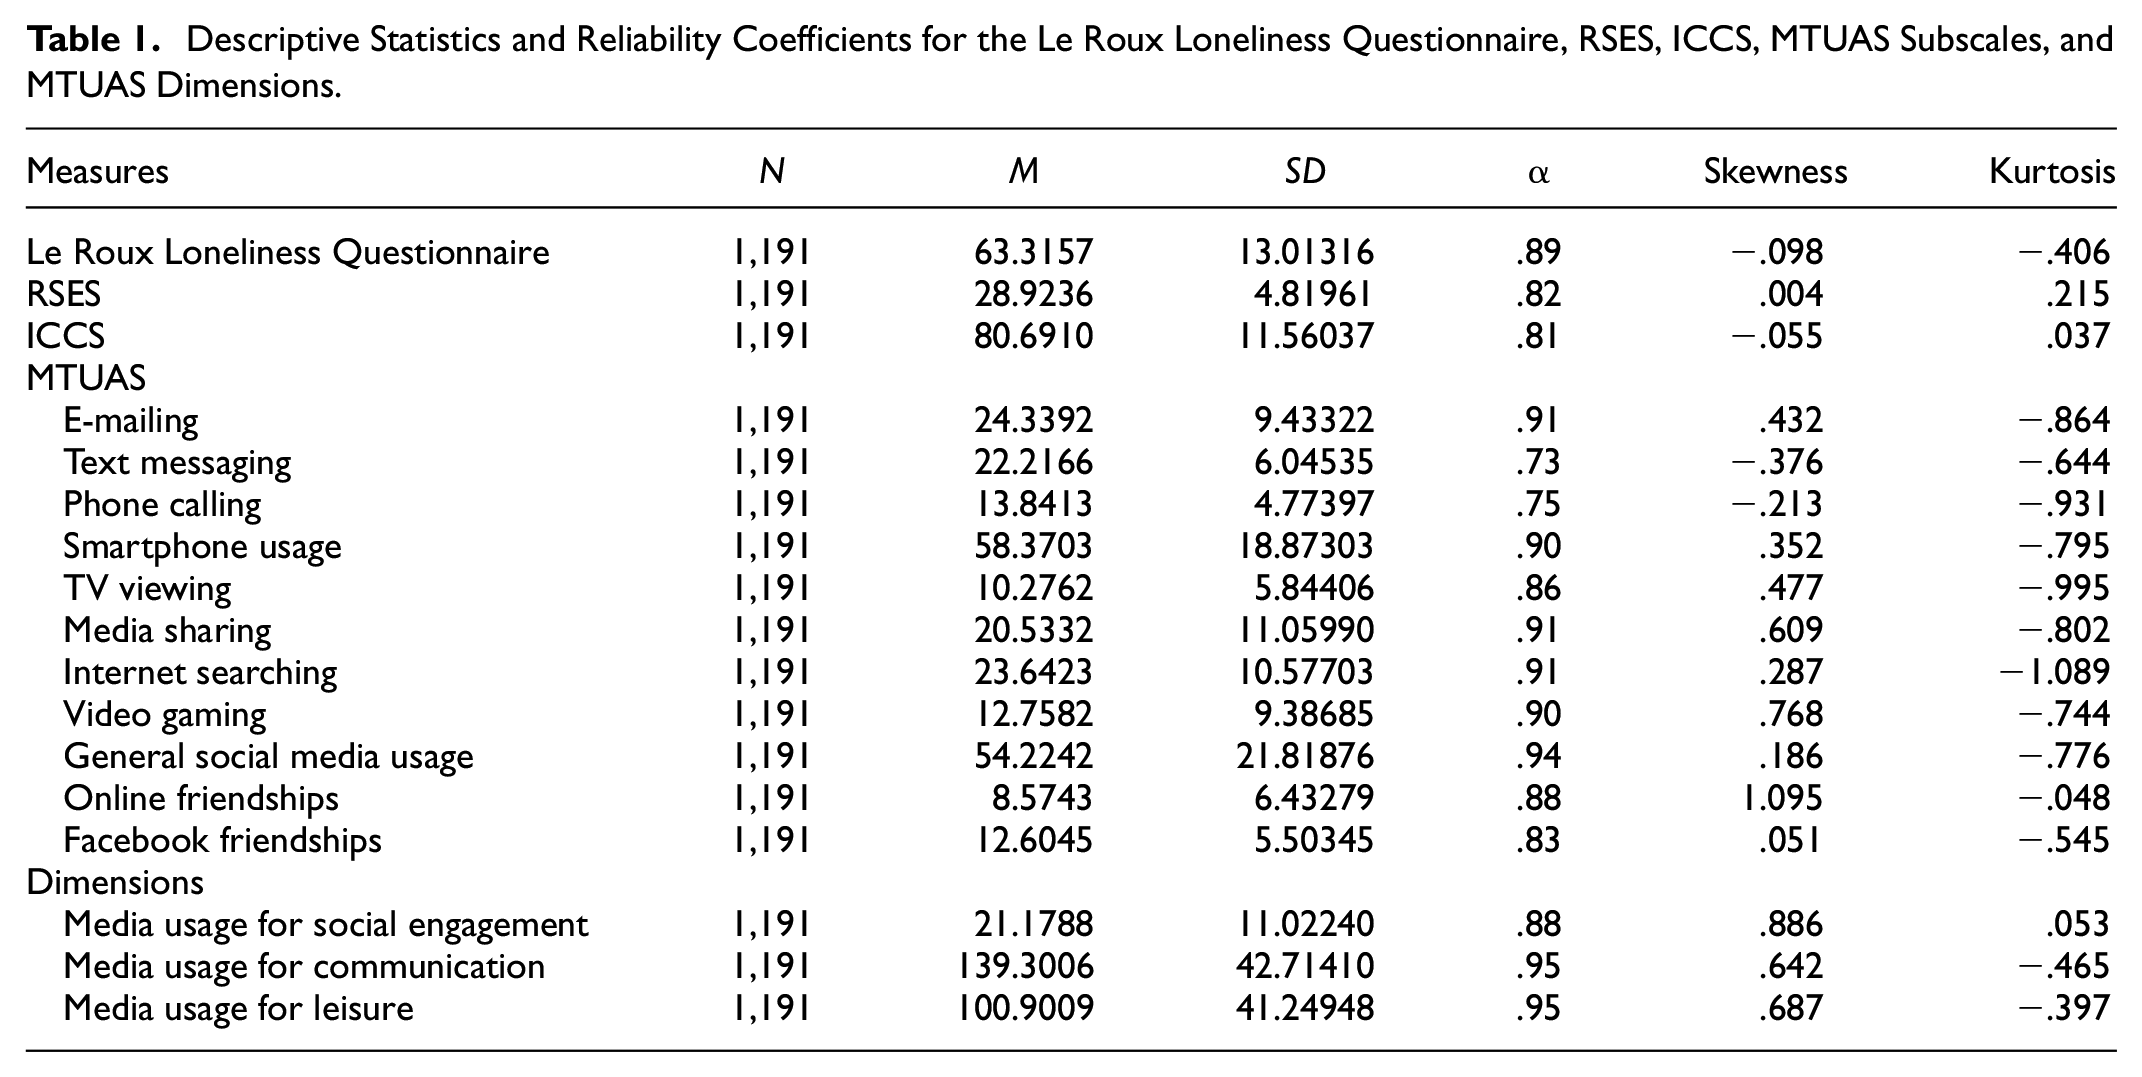
The Cronbach alpha coefficients for the Le Roux Loneliness Questionnaire, RSES, ICCS, and MTUAS subscales range from .73 to .94. These scales, therefore, displayed acceptable to exceptional levels of internal consistency (Vogt, 2005). The three created dimensions of the MTUAS also displayed acceptable levels of internal consistency ranging from .88 to .95. During the screening of the data, no distributional issues were detected. Both the skewness and kurtosis values were within acceptable ranges, and no univariate or multivariate outliers were found.
Prior to conducting the regression analyses, the Pearson Product Moment correlation coefficients were calculated between the independent (predictor) and dependent (criterion) variables. The correlation coefficients can be viewed in Table 2.
Correlations Between the Le Roux Loneliness Questionnaire and Gender, Age, Ethnicity, Generation, Religious Affiliation, Religious Practice, RSES Scale, ICCS Scale, and MTUAS Dimensions (N = 1,191).

Note. ICC = Interpersonal Communication Competence; M1 = Media usage for social engagement; M2 = Media usage for communication; M3 = Media usage for leisure.
p ≤ .01. *p ≤ .05.
Table 2 indicates that Loneliness demonstrates a strong, statistically significant negative correlation with Self-esteem. This correlation is statistically significant at the 1% level, with a large corresponding effect size of .6 (CI = 99%). This finding seems to suggest that when students have increased levels of self-esteem, they have decreased levels of loneliness. This finding may also suggest that when students have decreased levels of loneliness they tend to have increased levels of self-esteem. Table 2 also indicates that Loneliness demonstrates a statistically significant positive correlation with Interpersonal Communication Competence. This correlation is statistically significant at the 1% level, with a large corresponding effect size of .6 (CI = 99%). This finding seems to suggest that when students have increased levels of interpersonal communication competence, they seem to have increased levels of loneliness. This finding may also suggest that when students have increased levels of loneliness they tend to have increased levels of interpersonal communication competence. Table 2 further indicates that Loneliness demonstrates statistically significant positive correlations with all three dimensions of the MTUAS, namely (i) Media usage for social engagement, (ii) Media usage for communication, and (iii) Media usage for leisure. These correlations are statistically significant at the 1% level, and the effect sizes of two of these correlations are medium with an effect size of .30 (CI = 99%) for Media usage for social engagement and an effect size of .30 (CI = 99%) for Media usage for leisure. These findings seem to suggest that when students have increased levels of media and technology usage, they have increased levels of loneliness. These findings may also suggest that when students have increased levels of loneliness they tend to make more use of media and technology.
Hierarchical Regression Analysis Results
Regression analysis assumes that there is no perfect exact relationship among predictor variables. When this assumption is violated, the problem of multicollinearity occurs. To identify possible multicollinearity, variance inflation factor values (VIF) were calculated. Related to the VIF is the tolerance statistic, which should be higher than 0.2 (Menard, 1995). According to De Jongh et al. (2015), the VIF thresholds of five are common for relatively small data sets and 10 for large data sets. When multicollinearity is present, the standard error of the regression coefficients will be large. In Table 3, the collinearity statistics (tolerance and VIF) as well as standard error and Beta-coefficients of the predictor variables are indicated. It is clear that the VIF statistics for the five predictors are less than five, while the tolerance statistics are more than 0.2. The assumption of multicollinearity was therefore not violated. The researchers also ensured that all the assumptions of regression analyses were met and not violated.
Collinearity Statistics (Tolerance and VIF) for the Predictor Variables (N = 1,191).

p ≤ .01. *p ≤ .05.
The results of the hierarchical regression analysis with Loneliness as the criterion variable are reported in Table 4.
Contributions of Self-esteem, MTUAS Dimensions and ICCS to R2 with Loneliness as Criterion Variable.
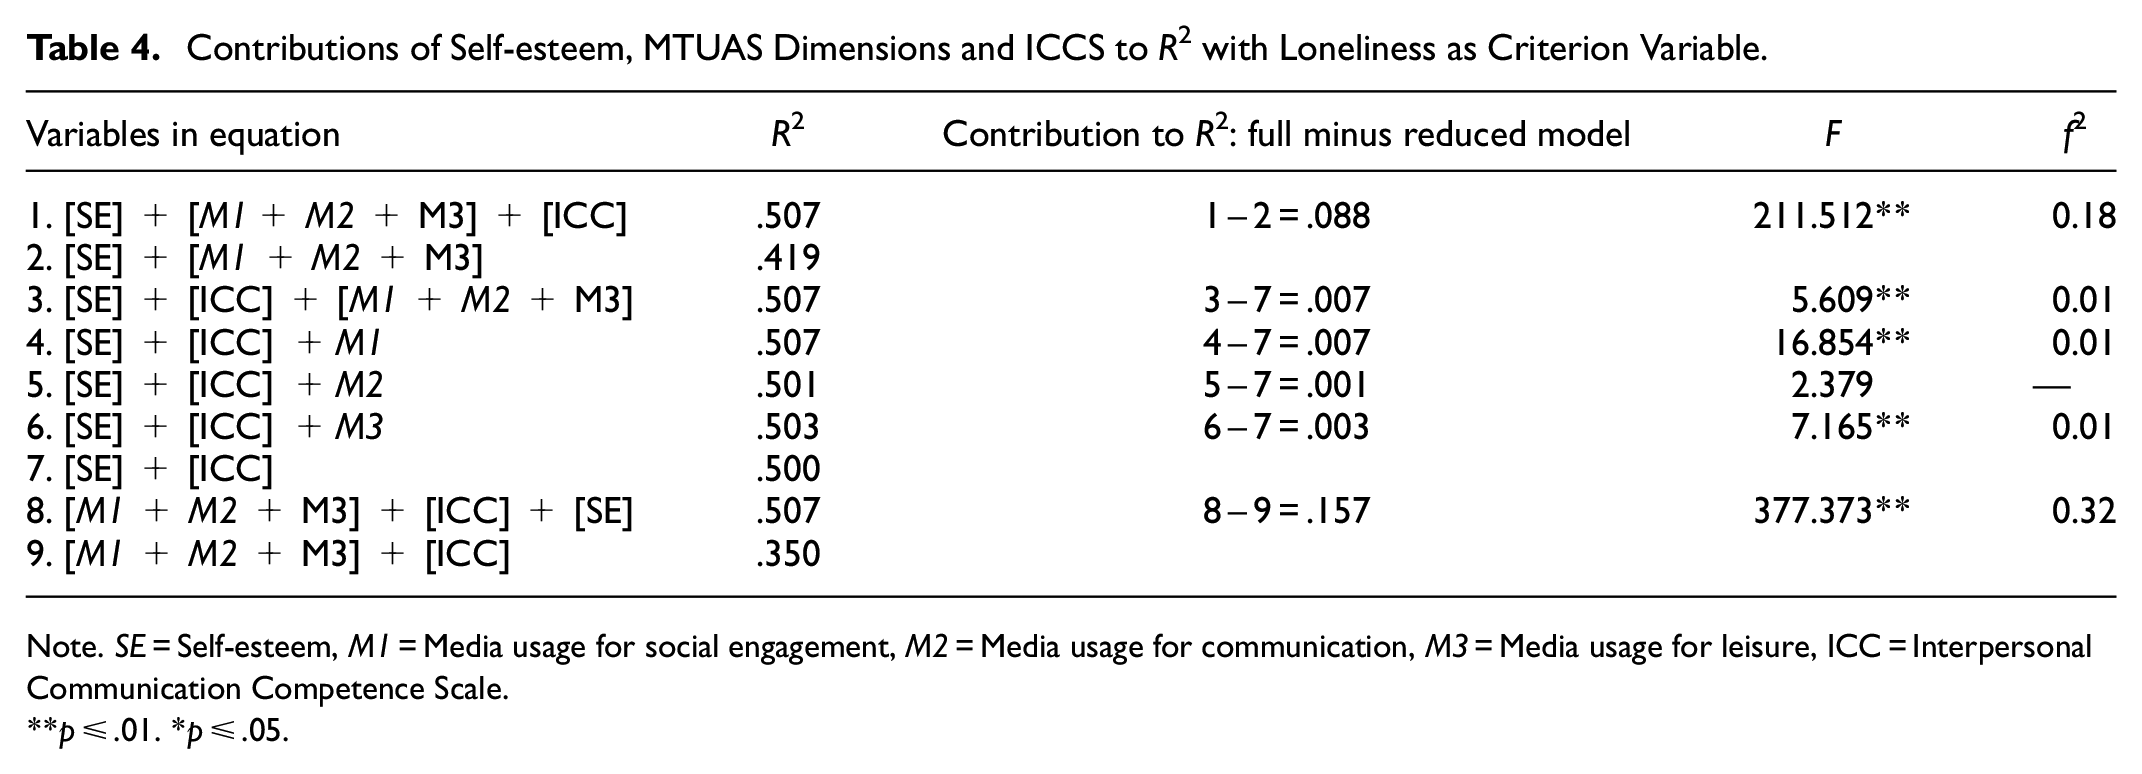
Note. SE = Self-esteem, M1 = Media usage for social engagement, M2 = Media usage for communication, M3 = Media usage for leisure, ICC = Interpersonal Communication Competence Scale.
p ≤ .01. *p ≤ .05.
It is evident from Table 4 that the combination of the independent variables accounts for 50.7% (F5, 1185 =244.078; p ≤ .01) of the variance in the Loneliness scores of the sample. Interpersonal Communication Competence as a predictor accounts for 8.8% of the variance in the Loneliness scores of the students. This finding is statistically significant at the 1% level, and the corresponding effect size (f2 = 0.18; CI = 99%) suggests that it is of medium practical significance. Table 4 further indicates that Self-esteem as a predictor accounts for 15.7% of the variance in the Loneliness scores of the students. This finding is statistically significant at the 1% level, and the corresponding effect size (f2 = 0.32; CI = 99%) suggests that it is of large practical significance.
Factorial ANOVA
The results of the factorial ANOVA with Loneliness as the independent variable are reported in Table 5.
Differences in Loneliness (Dependent Variable) Regarding Three Biographical Variables (Gender, Ethnicity, Generation).

p ≤ .01. *p ≤ .05.
According to Table 5, there is a statistically significant difference in Loneliness on the 1%-level regarding gender. In comparison with female students (
Discussion
This study examined the predictor variable(s) or combination of predictor variables, namely self-esteem, interpersonal communication competence, and media and technology usage, that explain a significant percentage of the variance in loneliness amongst university students, as well as to investigate whether differences exist in loneliness with regards to gender, ethnicity, and generational status. University students are more susceptible to developing feelings of loneliness due to various risk factors (Doman & Le Roux, 2012; Le Roux & Connors, 2001; Schiau, 2016; Seepersad, 2005; Stankovska et al., 2016). These factors include media and technology usage (Doman & Le Roux, 2012), interpersonal communication competence (Schiau, 2016), and low self-esteem (Cacioppo et al., 2009).
This study indicated that self-esteem and Interpersonal Communication Competence were the only two variables that independently statistically and practically significantly contributed to loneliness amongst university students. Self-esteem was statistically significant and negatively related to loneliness, which indicates that individuals with low self-esteem would have higher levels of loneliness. This finding is in accordance with previous studies that also indicated that self-esteem negatively correlates with loneliness (Davis et al., 1992; Keane & Loades, 2017; Lasgaard & Elklit, 2009; Mahon et al., 2006; McWhirter, 1997). These findings can be explained by the effects that low self-esteem has on an individual, namely feelings of hopelessness and inadequacy (Keane & Loades, 2017; Rahman et al., 2017). Low self-esteem in university students includes negative evaluations of especially their appearance and behavior (Rahman et al., 2017). Therefore, individuals with low self-esteem tend to lack the necessary confidence to socialize with others and the ability to consequently curb their loneliness (Al Khatib, 2012; Baumeister & Vohs, 2018). As a result, individuals with low self-esteem tend to isolate themselves and avoid social contact (Keane & Loades, 2017). These negative feelings toward themselves often keep individuals from building meaningful social relationships, which results in these individuals feeling lonely (Keane & Loades, 2017; Mahon et al., 2006).
On the other hand, these findings also substantiate the reasoning behind the concept of self-esteem, namely that an individual who possesses a higher self-esteem is more willing to socialize with others (Keane & Loades, 2017). According to the definition of loneliness, this socialization would satisfy the individual’s needs for quality social engagement and building social relationships, which results in decreased feelings of loneliness (Le Roux, 1998). An individual with higher self-esteem would feel worthy of the company of others and would also take on a positive attitude toward themselves, as well as be less inclined to feel like a failure if they possess higher levels of self-esteem (Al Khatib, 2012; Baumeister & Vohs, 2018). Thus, the strong negative correlation between loneliness and self-esteem correlates with literature indicating that self-esteem is one of the strongest predictors of loneliness (Cacioppo et al., 2009). This practically indicates that resources employed to curb loneliness amongst university students should be focused on promoting self-esteem, as it has been shown that correcting maladaptive social cognition, and thereby increasing self-esteem, has proven very successful in reducing loneliness (De Jong Gierveld & Fokkema, 2015; Masi et al., 2011; Rokach, 2018).
Interpersonal communication competence, on the other hand, was positively associated with loneliness. This is in stark contrast to available literature which, although often finding a significant correlation between loneliness and interpersonal communication, has only found a negative correlation (Cupach & Canary, 2000; Query & Kreps, 1996; Query & Wright, 2003), rather than a positive correlation, as was found in this study. For example, past literature has demonstrated that interpersonal communication competence is a predictor of increased levels of social support and relational satisfaction within individuals, compared to those with low interpersonal communication competence (Apker et al., 2003; Canary & Lakey, 2006; Cupach & Canary, 2000; Query & Wright, 2003). This may be because poor interpersonal communication competence leads to a lack of belonging, as well as feelings of a lack of support and intimacy, which leads to loneliness (Doman & Le Roux, 2012). Further reinforcement for this theory lies in lonely people not being considered popular within a social context and being less emotionally close to the few individuals with whom they have social relationships (Doman & Le Roux, 2012). This, once again, reiterates that lonely individuals have poorly developed social skills, which keep them from developing strong, fulfilling intimate relationships with others (Doman & Le Roux, 2012). This result may, therefore, indicate that other sub-constructs of interpersonal communication competence need to be considered in relation to the correlation between loneliness and interpersonal communication competence in order to explain this specific finding. Therefore, re-evaluating and developing scales relating to Interpersonal Communication Competence, as well as exploring each dimension and subscale of the ICCS separately could be important topics for future research. Nevertheless, interpersonal communication competence is a necessity for maintaining quality intimate social relationships (Cacioppo et al., 2009; Knapp & Daly, 2002) and poor interpersonal communication competence results in feelings of a lack of intimacy, which results in loneliness (Doman & Le Roux, 2012; Knapp & Daly, 2002). These findings indicate that interpersonal communication competence is an important factor which needs to be implemented and taught in combatting loneliness in especially university students who are prone to loneliness, as well as in the phase of development where the establishment of intimate relationships is essential (Canary & Lakey, 2006; Wright et al., 2013).
In this study, the male students seemed to feel lonelier than female students. Previous findings found that males, in general, are lonelier than females (Knox et al., 2007; Wiseman et al., 1995). Some studies focusing on university student populations specifically (Deniz et al., 2005; Yang, 2009), as well as in the South African context (Janse van Rensburg, 1991; Pretorius, 1993), have yielded similar results. First-generation students seemed to feel lonelier than non-first-generation students. There is limited research based on this variable, and it is in accordance with the findings of this study, as previous research has indicated that first-generation students do not develop peer support to establish meaningful social relationships, which leads to a lack of belonging and social fulfillment and, ultimately, loneliness (Huerta & Fishman, 2014; Rayle & Chung, 2008; Stebleton et al., 2014).
This study adds to the limited research regarding loneliness as a separate concept rather than a symptom of a specific pathology in specifically South African university populations and loneliness in the South African context as a whole. Overall, this study contributes to the knowledge of self-esteem and interpersonal communication competence as predictors of loneliness amongst university students in the South African context.
It is recommended that workshops, interventions, and psycho-education programs focusing specifically on self-esteem and interpersonal communication competence should be used to decrease loneliness within student populations, as these are concepts that have repeatedly been proven to act as preventative measures and protective factors in the development of loneliness within these populations. Lastly, this study may also aid in reporting on the validity of the measuring instruments used in order to support and encourage further use of these instruments in a global and South African context.
Limitations and Future Research
There are limitations that may have impacted the results obtained within the study, and the results of this study should, therefore, be interpreted against these limitations. Firstly, the issue of generalizability links to the limitation of using convenience sampling as a method to recruit participants for the study, as well as the fact that the research only focused on students enrolled at university and did not consider other contexts of tertiary education, such as FET colleges or private institutions. Thus, the sample only represented the very distinct population of students who participated in the study and can therefore not be generalized to any other age groups, other student populations at universities or other tertiary institutions in South Africa or internationally or any other contexts beyond the specific research sample within this study.
As with any self-reporting measures, the issue of cognitive biases in the form of self-promotion and reactivity also exists. Therefore, due to the participants being required to self-report, intentional distorting, as well as false or inaccurate answers, may have been submitted by the participants when completing the self-reporting measures instruments (Lavrakas, 2008; Stangor, 2015).
Despite the limitations outlined above, the results of the study are meaningful in that it adds to the limited research regarding loneliness as a separate concept rather than a symptom of a specific pathology in specifically South African university populations and loneliness in the South African context as a whole. Overall, this study contributes to the knowledge of self-esteem and interpersonal communication competence as predictors of loneliness amongst university students in the South African context. In terms of research specifically relating to the concept of loneliness and the population of university students, there are several important recommendations to consider for future research endeavors. Firstly, it is suggested that it would be beneficial to study loneliness amongst university students in the context of a longitudinal and possible qualitative context, as well as possibly including postgraduate students. This may yield a more in-depth understanding of the complex nature of loneliness and its dynamics within the specific population of students, including how these feelings change over time as individuals age and enter another developmental phase within the lifespan.
Furthermore, the use of probability (random) sampling is also recommended, as it would yield a representative sample of the larger population of students, and future results would, therefore, be generalizable to contexts outside of this particular study (Maree, 2014). It is also recommended that similar research studies be conducted with larger groups of students at different universities, as well as in various tertiary contexts, within the South African context, to obtain samples which are more varied in terms of loneliness and its related variables.
Conclusion
The results of the present study highlight that self-esteem and interpersonal communication competence in particular statistically and practically significantly contribute to loneliness amongst university students. The findings outlined above furthermore allowed for the answering of the proposed research questions, such as that the combination of the independent variables accounted for 51.9% of the variance in the Loneliness scores of the sample, as well as that male students and first-generation students tend to be lonelier than female students and non-first-generation students. Of particular interest was the result indicating that a statistically significant positive correlation exists between loneliness and interpersonal communication competence; a result which is in stark contrast with relevant literature.
Footnotes
Declaration of Conflicting Interests
The author(s) declared no potential conflicts of interest with respect to the research, authorship, and/or publication of this article.
Funding
The author(s) received no financial support for the research, authorship, and/or publication of this article.
Data Availability
The data that support the findings of this study are available from the corresponding author upon reasonable request.