
Abstract
Urban vitality generally refers to the ability to attract lively businesses and human activities, which largely depends on the urban built environment and human flows. Previous studies that applied the empirical approach to analyze urban vitality from the feature of the urban built environment and the behavior of residents are scarce. This study developed a novel framework for exploring urban vitality on the street scale with geographic big data in Xiamen Island—a livable city in southern China. We measured urban vitality and analyzed its characteristics using the Shannon entropy model based on four dimensions of GIS-based data on the point of interest density, taxi flow density, building density, and road density. We then apply the regression model to explore the relationship between land-use diversity and urban vitality. Results show that four dimensions are associated with urban vitality. Furthermore, the dimensions of the taxi flow density and the road density in low vitality blocks can be distinguishable from other blocks. Results showed a stronger relationship between land-use diversity and urban vitality. The urban expansion direction of Xiamen Island is from the old town around the Xiamen Port to the new district around Yundang Lake to form a continuous covered area, which significantly impacts urban vitality. The approach of this study not only measures urban vitality through human activity but also sheds light on guidelines for sustainable urban development, which can plan and policy in practice for cities in China and many other countries.
Introduction
According to the report from World Bank, urban areas suited an aggregate of 5.473 billion populations, made up 71.7% of the total population in the world and contributed about 80% of the global gross domestic product (GDP) at the end of June in 2018 (Sassen, 2018). With the crisis of increasing population, urban areas are likely to develop unsustainably, leading to issues of decreased urban vitality and quality of life (Lang et al., 2016, 2019; Montgomery, 1998). A fundamental issue for urban planners and economists is what creates urban life (De Nadai et al., 2016). Jacobs (1961) argued that the urban physical environment is essential for urban vitality. She also criticized that the death of a city was caused by large-scale redevelopment and highway construction projects. In contrast, the life of a city was created by the diversity of the physical environment at both district and street levels. For example, the decline of Detroit, Glasgow, Liverpool, and Leipzig presents a change in their physical environment from the result of population loss, house vacancy, and high crime rate, which cannot maintain sufficient vitality to provide residents with a suitable living environment (Kim, 2018). The redevelopment of these cities requires managers and planners to play a more active role in improving the quality of urban vitality and the built environment. Detecting urban vitality is the new demand for the resident in the real world.
Urban vitality generally refers to the ability to attract lively businesses and human activities, which largely depends on the urban built environment and human flows. Therefore, many scholars used urban activities as the proxy for urban vitality (Jin et al., 2017; Lang et al., 2022; Wu et al., 2018). With the development of information and communication technology, a large amount of location-based data is easy to acquire, allowing researchers to measure urban vitality through human activity. Meanwhile, many studies have proposed new indicators for investigating urban vitality (Delclòs-Alió & Miralles-Guasch, 2018; Kim, 2018; Lang et al., 2020; Sulis et al., 2018; Ye et al., 2018). These studies mainly focus on evaluating the effects of urban vitality but still do not consider human activity in physical space and how it affects the built environment. It is essential to measure urban vitality in the two aspects to develop a general understanding of human activity in cities.
This study analyzes the spatiotemporal pattern of human activities in physical spaces to address this challenge. As an empirical approach, the physical environment and social dimensions of urban vitality are measured by big data on Xiamen Island, China. This study aims for two goals: (1) to measure urban vitality on a block scale and (2) to explore the relationship between urban vitality and land-use density. To address these two goals, this study conceptualizes urban vitality as having four dimensions: human activity density, block length, building density, and internal road density. This paper proposes the human activity dimension to respond to the resident’s quality of life. Taxi flow is presented as a proxy to represent the human activities dimension, reflecting the city’s vibrant destination. The study focuses on Xiamen Island, one of China’s historical and largest cities. This paper hopes to fill the gap in measuring urban vitality on the block scale to provide helpful information to urban management and planning in China.
The rest parts of this study are organized in the following manner. First, relevant studies are reviewed in the next section. Then, in section 3, we outline the case study area and describe the background knowledge of available data sources. Also, we introduce the details of the method used to measure block vitality in the urban area. Next, section 4 presents the results of the evaluations. Finally, after discussing the verification and outcomes, we conclude this paper with a summary and some final notes in section 5.
Review of Urban Vitality
Urban vitality can be considered one of the essential measures of people’s activities in the city, reflecting the density and frequency of interactions among people. Urban vitality is a vital element for attracting companies and creating jobs, especially in the services industry, such as the bid of the second headquarters of Amazon among the cities in the US. If blocks’ vitality declined, the city would encounter a series of adverse effects called urban shrinkages, such as population decline, infrastructure degradation, and economic recession. Thus, a large-scale, medium-resolution, cost-effective, and time-saving assessment of the urban vitality diagnostic method should be performed periodically. It is also suitable for local governments to detect the decline of urban vitality in specific blocks in advance.
Urban vitality also usually refers to the physical environment of a diverse place to provide lively social and economic activities (Jacobs, 1961). Diversity in this sense requires four essential conditions: (1) mixed land use, which is a planning strategy with more than one primary function in a district, preferably more than two; (2) small blocks, which provide the opportunity for people to contact; (3) buildings from different eras, the diversity of workplace creates a wide range of jobs which tend to attract different people; (4) high building density, the dense concentration of people and buildings leads to more frequent and diverse interactions between people who are living and visiting a given area (Jacobs, 1961). This means that urban vitality is essential for city performance, revealing the relationship between the urban physical environment and residents’ quality of life. Many scholars agreed with Jane Jacobs’ urban vitality theory. Kevin (1981) pointed out that vitality as an environmental condition supports the health and biological functions of the individual. Other scholars emphasized that a vital urban life relies on active street life resulting from high levels of pedestrian traffic (Gehl, 2011; Kim et al., 2013; Sung et al., 2015).
Due to privacy and access rights constraints, the widespread application of quantitative analysis has been hindered by the availability of indicating data (Long & Shen, 2013). Therefore, a more comprehensive investigation as a planning support system using multi-sourced data is needed to explore the four conditions (Long et al., 2011). However, only a few studies empirically analyzed the four conditions of Jacobs. According to De Nadai et al. (2016), this was mainly because of the difficulty of collecting data. Some districts were full of urban vitality, and some were not. Over the past decade, large datasets have become increasingly due to the development of sensors in the cities. In the “Smart City” research domain, many scholars have used “Big data” to study human activists. “Big data” differs fundamentally from small data in terms of data characteristics and opens new opportunities to analyze the issues mentioned above, such as taxi data, mobile phone data, smart data, etc. (Delclòs-Alió et al., 2019). “Big data” are automatically harvested from a large population of users or crowds, often referred to as “all” and possibly measured at very fine spatial and temporal resolutions (Jiang & Thill, 2015).
Some scholars had been used big data to analyze urban vitality. For example, Gowharji (2016) constructed a computational tool for evaluating urban vitality in Kendall Square and Harvard Square. The result shows that Harvard Square was balanced in terms of Jacobs’ conditions, while Kendall Square suffered from an imbalance in residential density. De Nadai et al. (2016) applied mobile phone data, land-use data, socio-demographic information, and open street map in six cities in Italy (i.e., Bologna, Florence, Milan, Palermo, Rome, and Torino) to test Jane Jacob’s four conditions. Sulis et al. (2018) used mobility data from Twitter and point of interest data to analyze the diversity and vitality of London based on Jane Jacobs’s urban vitality theory. Kim (2018) took advantage of Wi-Fi hotspots and used Wi-Fi access points as an indicator to explore the urban vitality of Seoul. Ye et al. (2018) employed the open street map and point of interest data to assess the relationship between urban vitality, urban morphology, and urban density using regression models in Shenzhen. Finally, Yue et al. (2021) used multi-source data to measure urban vitality in Shanghai and Ho Chi Minh City based on three dimensions of human activity, the built environment, and their linkage. These studies’ results present that the four conditions of Jacobs were beneficial to urban vitality, including mixed land use, small blocks, aged buildings, and a sufficient concentration of buildings. However, these studies still do not consider human activity in physical space, which could not reflect the real-time vitality of residents and how it affects the built environment. In addition, most of the earlier studies analyzed urban vitality on the city and regional scale, which could not understand residents’ living quality of life in the block’s physical environment. To address these issues, this paper used the real-time data of residents of taxi trajectory to the spatial measurement of urban vitality on the street block scale.
As cities transform from urban sprawl to urban renewal in China, assessing urban vitality could be an instructive work for urban life improvement, urban planning, and urban design to consider more livability, vitality, and well-being (Lang et al., 2018). Long et al., (2019) examined the influence of urban design on economic vitality in 286 cities in China. The result shows that urban design indicators, including intersection density, level of mixed land use, and access to amenities and transportation, have a significant and positive association with levels of economic vitality at each administrative level in cities. Using geospatial data, A. Zhang et al. (2021) examined the relationship between the urban landscape and urban vitality at the street block level. The result indicates that city plan patterns and land use affect urban vitality. Thus, we choose one of China’s historical and largest cities to measure urban vitality. As an empirical approach, the physical environment and social dimensions of urban vitality are measured as four dimensions: human activity density, block length, building density, and internal road density in Xiamen Island, China. This paper can be seen attention to the urban physical environment and human activity, which shed light on guidelines for sustainable urban development.
Data and Methods
Study Area
Xiamen Island is a well-known municipal-level administrative district located in Southeastern China. It spans approximately 132.5 km2 and comprises a population of 2.08 million in 2021 (Xiamen Municipal Bureau of Statistics, 2021). It was ranked as China’s second-“most suitable city for living” and China’s “most romantic leisure city” in 2011. With the rapid urbanization since 1949 in Xiamen Island, the increasing population and growing economy are required for living space. However, the government reported that there would not be available land for sale on Xiamen Island since 2010. To harmonize the contradiction between increasing land use demand and its supply, urban renewal projects began in the city (i.e., reconstruction of the old theater cultural park in Lujiang Street and Zengcuoan village renovation). When the government finished the urban renewal program, the residents in renewed areas enjoyed better living conditions but consumed less land than before. These program has resulted in an increase in population density, expansion in living space, and less green space in the urban area (Tang et al., 2013). Measurement of the vitality of each street block is significant for decision-making for urban renewal. Empirical research on Jane Jacob’s urban diversity and vitality theory may provide important policy implications for Xiamen Island. As the smallest scale of urban and regional studies, the block can objectively mirror the urban vitality of residents in a city. Thus, we used the primary and secondary roads to distinguish blocks and dropped off some street blocks in small sizes, which is not statistically significant. Therefore, there are 561 blocks in this study (see Figure 1).

The provinces of China (a), the city in Fujian Province (b), and the study area of Xiamen Island (c).
Data
Taxi trajectories records in this research included the taxi license plate number, time stamp, latitude and longitude, speed, global positioning system status, and passenger status. The time of the records was from April 17, 2016 (Sunday) to April 23, 2016 (Saturday). The range of the records covers from 5,579 to 5,739 taxis in Xiamen Island, generating approximately 14.5 million records daily. Figure 2(a) shows the origin/destination(O/D) pairs of taxis extracted from the records, and the green points represent the up/down records of passengers from each taxi at a certain time.
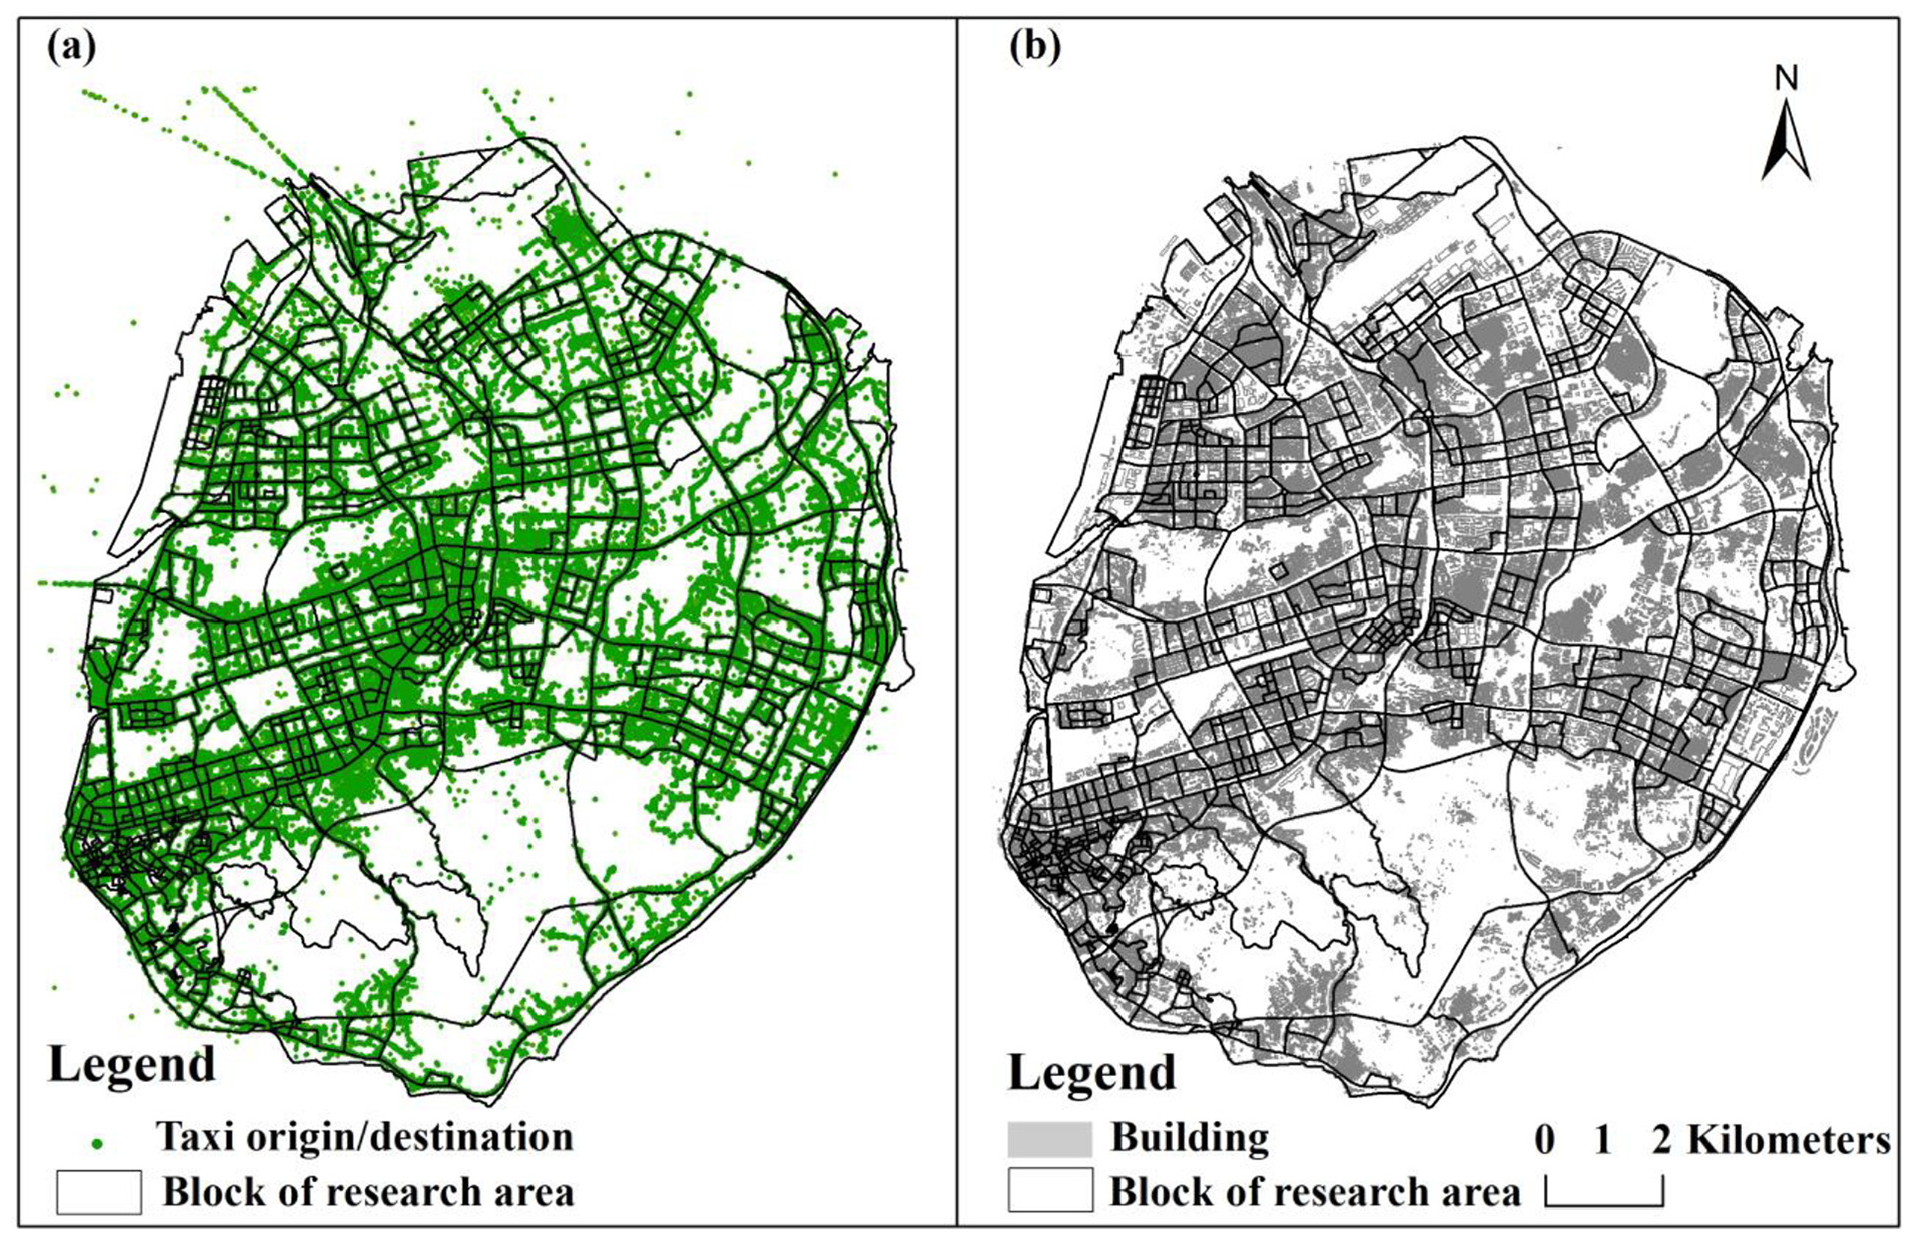
The taxi origin/destination flow (a) and base map of buildings (b) in the study area.
The Baidu platform in China has produced extensive geographical databases providing a range of information about buildings, including parcels, parks, rivers, roads, and other major facilities. In this research, Xiamen’s urban physical environment features were collected from the Baidu platform, including building density, point of interest, and road data. Different building densities significantly impact employment and residence in a city. Diverse buildings make it possible to generate a mixture of jobs (i.e., high and medium-income jobs) and a mixture of tenants (e.g., high-rent and low-rent tenants). It not only reflects the regional economic situation but also influences urban vitality. Therefore, building data was employed as one of the indicators of urban vitality (as shown in Figure 2(b)). The gray area in Figure 2(b) represents the base map of buildings on Xiamen Island.
To evaluate the function of urban land use, the point of interest (POI) in 2016 was gathered and classified by different service types. As a result, there are 58,266 records with 13 categories on Xiamen Island, which contain the information of name, type, exact address, longitude, and latitude. The categories correspond to real-time personal movements in the region, including tourist sites, supermarkets, sports services, restaurants, public facilities, healthcare services, life services, government agencies, financial insurance services, education, offices, residence, and hotels. In addition, we calculated the sum, mean, standard deviation, minimum, and maximum of the number of each POI type as Table 1 shown below.
Summary of POI Categories in Xiamen Island.

The mean, standard deviation, minimum, and maximum for four dimensions of all blocks are shown in Table 2.
The Statistics of the Block, Building, Road, and Taxis of All Blocks on Xiamen Island.

Methodology
As previously mentioned, Jacobs (1961) proposed four essential conditions to measure urban diversity. It includes the land-use diversity, the short side length of a block, the mixture of building age and form, and population abundance. This study used four dimensions of block length, building density, road density, and taxi flow as the detection indicators to measure urban vitality at the block scale. Shannon entropy has a wide range of applications in the analysis of geographic domain expression, which means the uncertainty of events could be a proper method to measure the vitality of blocks in the city. Thus, this study employed the Shannon information entropy to evaluate the relationship between human activities and operationalized built environmental measures urban diversity as the block vitality.
The large rectangular blocks were apt to thwart the compelling mixture of use and people, resulting in paths that met each other too infrequently. Hence, research counts the perimeter of each block and calculates the ratio of the shortest side of the block as the block’s length reference. Where Min L represents the shortest side of the block and

Different buildings encouraged the proliferation of small and diverse enterprises, which produced more vigorous streets and city districts. This study measured the building density in each block using the ratio of the building area to the total area of the block. Typically, Bx is the building area of x block and Ax is the floor area of x block.

The road density indexes the street intersection density and the average distance of all buildings to the nearest intersection. A high road density indicates an area with smaller blocks and mixed land use. This research used the ratio of road length to the total length of the road as the block road density, where Bx corresponds to the length of the road in x block and R represents the total length of the road in the research area.

Urban vitality is derived from people in the city as well. Thus, we used taxi trajectory records as an input representing human activity. First, we utilized the C language to extract O/D pairs from taxi trajectories data. Because the area of Xiamen Island is small, the maximum time for a vehicle to cross the whole island once would not surpass 2 hours. Thus, we removed the travel time of O/D pairs for more than 2 hours. Secondly, information on O/D pairs was joined to each block by using ArcGIS 10.6. Finally, based on taxi trajectory records at the block level, we calculated movement flows on weekends and weekdays by computing the proportion of street block flows to the corresponding block, where Tx indicate the taxi flow of x block and Ax is the floor area of x block.

The Shannon information entropy is applied to measure the composition of urban block vitality with individual blocks. Our analysis accounts for four dimensions of uses of the urban space, including block length, building density, road density, and taxi flow. In addition, travel modes are influenced by the physical environment and individual preferences (Long & Thill, 2015). Here, the individual-level explanatory variables are classified as control variables to estimate the effects of urban vitality,

where
Results
Resident Movement in Each Block
In order to verify the taxi flow data, this study analyzed the movement behavior density of residents in each block on weekdays and weekends using ArcGIS10.8 software to establish a distribution map of human activities in each block. There are 449,899 trajectories in Xiamen within a week. The periods were divided into 1:00 am to 6:00 am, 7:00 am to 12:00 pm, 1:00 pm to 6:00 pm, and 7:00 pm to midnight. The block residents’ movement density is the ratio of the number of movements and the area of the block (unit km) in each period. The results (Figure 3) show that the daily flow of human activities presents a “regular fluctuation pattern” from 12:00 am to 11:00 pm. The population dynamic intensity shows various patterns at different periods in a day. The rise occurs in the early morning (from 5:00 am to 8:00 am) as well as in the afternoons and evenings (from 4:00 pm to 10:00 pm), while the decline occurs at night (from 4:00 pm to 10:00 pm). The record response to the human activities pattern of people is invariably leaving home to the workplace in the mornings, returning home after 5:00 pm, and staying at home at night. Population movements between 8:00 am, and 12:00 pm remains stable, and a slight decline occurs between 1:00 pm and 3:00 pm. Interestingly, the peak of travel is from 9:00 pm to 11:00 pm on Friday while the bottom of the same time is Sunday night.

Resident hourly movement behavior in 1 week.
The analysis calculates the residents’ movement density through taxi flow data, ranging from 1 to 98,144 (Figure 4). In Figure 4, individual blocks are color-coded according to their values. The dark brown blocks present high movement density (value higher than 30,001). The highest concentration is observed in the old town of Xiamen (i.e., Lujiang, Jialian, Jiangtou, and Huli industrial estate) and business and residential areas with a high-density population. Conversely, the pale-yellow block indicates a low rate of residents’ movement density, mainly distributed in the periphery or territorial sea boundary zone, which includes mountains, water, and scenic spot. Considering the sleeping time, the density of residents’ movement is low from 1:00 am to 6:00 am. The density of activities gradually rises and maintains within the high-value range from 7:00 am to 6:00 pm, due to the active activities, such as commute, leisure, and entertainment, during this period. From 7:00 pm to midnight, the density of activities gradually declines. These results are a response to the pattern of residents’ daily life. According to the characteristics of movement activities on different weekdays and weekends, the intensity of block vitality indicates that the urban center area of Xiamen is the most concentrated area with the largest population. Therefore, the urban center may be the most vitality place in the city. Thus, the taxi flow can reflect the residents’ movement and is considered reliable data for the alternating population.

Distribution of resident flow in each block.
Results of Urban Vitality
Urban vitality identifies three types high vitality, middle vitality, and low vitality (Figure 5). High vitality is the block with an entropy value above 0.1, while the entropy value between 0.0594 and 0.1 are categorized as middle vitality blocks. Consequently, low vitality is the entropy value from 0.0284 to 0.0593. Finally, blocks with entropy values less than 0.0284 are eliminated, as these blocks are dominated by mountains, water bodies, and airports without population.

The block vitality distribution in Xiamen.
As shown in Figure 5, three types of blocks show different distributions. The high vitality blocks are mainly distributed in the old towns such as Lujiang, Jialian, and Jiangtou. At the same time, low vitality spaces are also observed in the high vitality blocks like Zhongshan Park, Xinhua Road, South Park Road, and Beimenwai Street. The middle vitality blocks are primarily concentrated in the new districts such as Lujiang, Jialian, Xianyue, and Huli. Finally, the low vitality blocks are mainly distributed in the suburbs district such as Xilin Village and Gutang Ridge Village, with few taxi flows, extending the length of the block and single land-use function. Most notably, middle vitality spaces are also observed in the low vitality blocks, such as Xilin East Road. To analyze these phenomena in Xiamen Island, the relationship between three vitality and urban expansion is investigated in this paper. Furthermore, the Pearson correlation coefficient measures the relationship between the three vitality and land-use diversity.
The Relationship Between Urban Vitality and Urban Expansion
The expansion of the built-up area in Xiamen Island mainly experienced three stages. The first stage was the Opium War, which took place in 1840. The built-up areas of Xiamen Island were concentrated in the old town before 1840. After the Opium War, the British government forced Xiamen Island to be a treaty port. Under this situation, urban construction projects were mainly performed along the island coastline, including ports and commercial and consular buildings. The metropolitan built-up area gradually spread from Xiamen Island to Shangyu Port. It formed a semi-colonial spatial structure covering from Lujiang Road to the southwest of the Peace port during this period. The second stage is founding of the People’s Republic of China (1949). After 1949, urban development expanded along with major road networks. Subsequently, land reclamation along the coastline brought out development in the southwest area of the island, and the urban space expanded from Hexiang to Hubin. The third stage is China’s Reforms and Opening-Up in the 1980s. Xiamen Island was established as a special economic zone after 1980. The city’s master plan adopted the policy of “first develop the new district, then regenerate the old town,” introducing a new urban expansion around Yundang Lake on Xiamen Island. The territorial expansion moved from the old town around the Xiamen Port to the new district around Yundang Lake, which relates to Xiamen’s population and service development (Lin et al., 2010).
To present the spatial-temporal feature of urban expansion on Xiamen Island. This study used Landsat TM, ETM+ images of multi-source remote sensing in 1986, 1995, 2005, and 2018 to extract the built-up area in Xiamen in four periods. The method to extract the built-up area is supervised classification. In Figure 6, the red areas of land are the built-up area, while white land areas are non-construction land. The built-up areas of Xiamen Island in the four periods are 21, 57, 78, and 108 km2, respectively. During 1986 to 1990, several satellite towns were constructed, such as Gaoqi Airport, Xiangyu Port, and the attached bonded area. In the 1990s, satellite towns developed adjacent to each other, merging into the built-up area. With the lack of land supply, the northeast districts of the island were developed after 2000. After four periods, the built-up area covered the whole of Xiamen Island except for the mountain and water. For instance, the increase rate indicates a 38.3% rise from 2005 to 2018, representing a high and rapid growth period on Xiamen Island. The urban expansion direction of Xiamen is from the northwest to the southeast to form a continuously covered area.
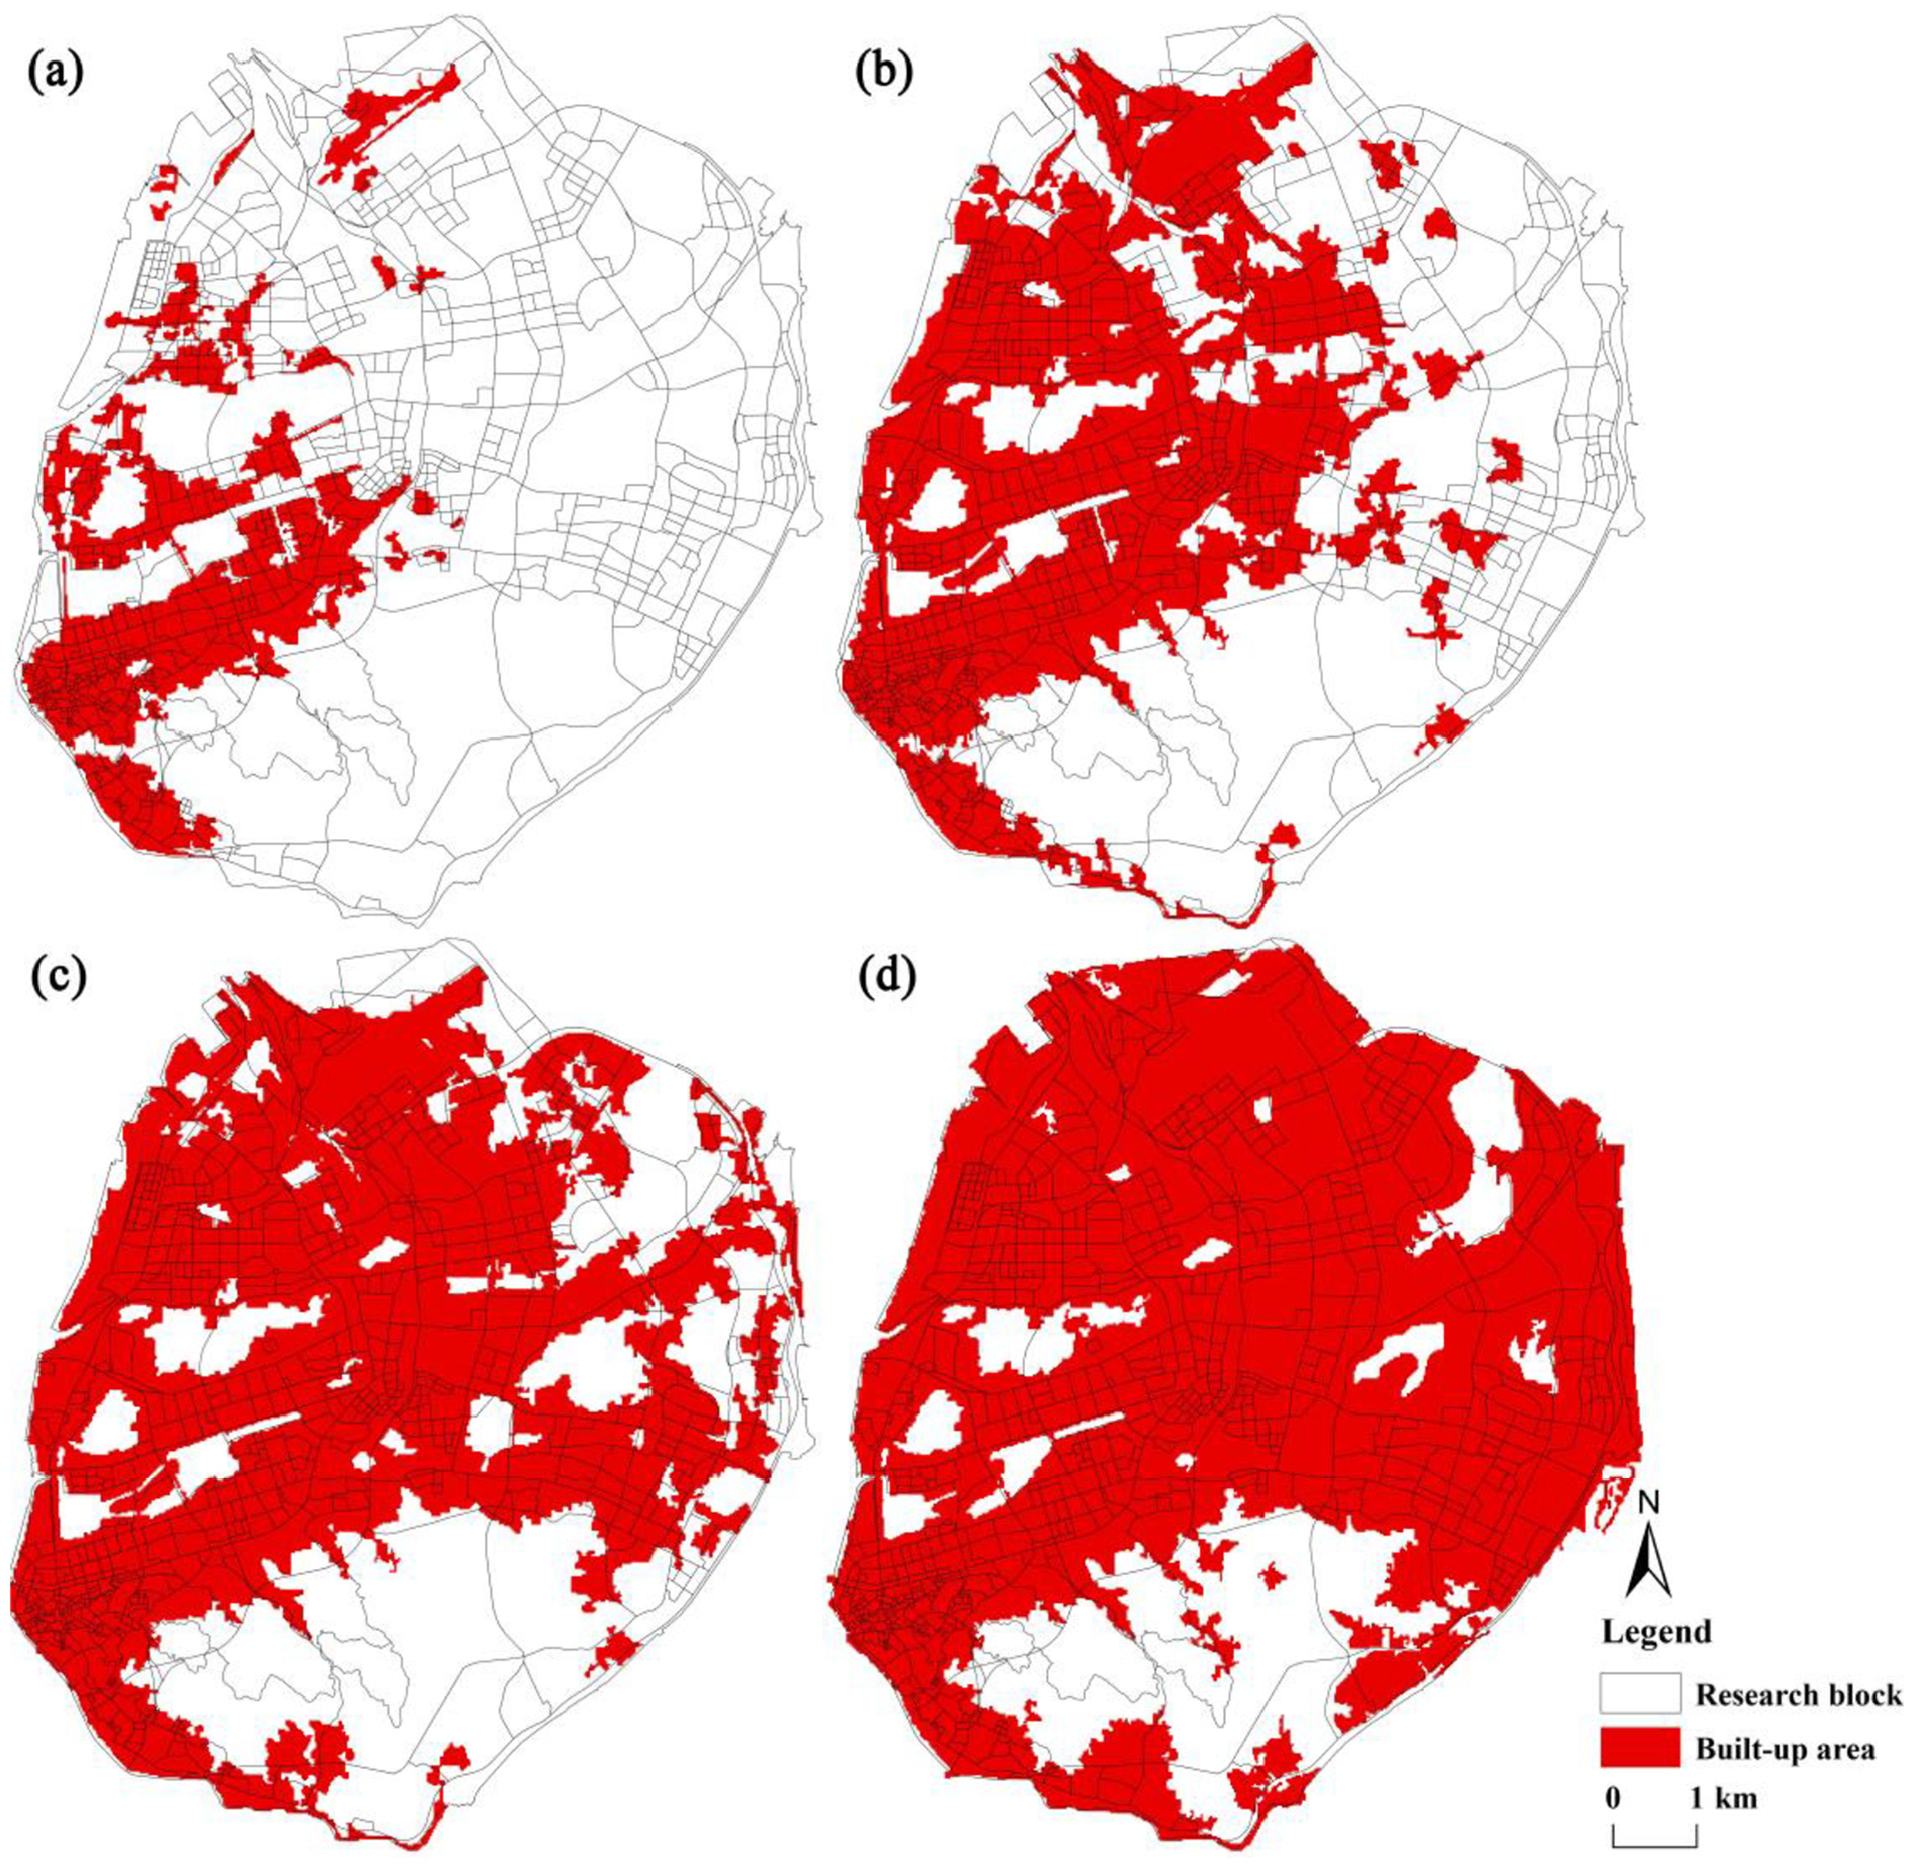
The built-up area of (a) 1986, (b) 1995, (c) 2005, and (d) 2018 in Xiamen Island.
The built-up area growth over four periods demonstrates the distinctive urban vitality of each district on Xiamen Island. The new district is the most popular place with higher vitality (see the blue border in Figure 5). The old town (the district highlighted with a red border in Figure 5) is the second most popular place with lower vitality and attracts less taxi flow. The build-up area indicates that the urban expansion influences the urban vitality of Xiamen’s blocks. Comparing four dimensions of low vitality blocks (as displayed in Table 3), our findings show that the low vitality blocks are opposite to all blocks in taxi flow and internal road density, which is crucial for urban vitality.
The Statistics of the Block, Building, Road, and Taxi of Low Vitality Blocks in Xiamen Island.

Correlation of Functional Diversity of Land Use and Building to Block Vitality
Previous studies argued strong connections between urban vitality and land-use diversity (De Nadai et al., 2016; Gowharji, 2016). Multi-function land use attracts people with diverse purposes who share common facilities, resulting in an increase in the vitality of blocks. The diversity of land use often refers to functional zoning, a two-dimensional concept in urban planning. However, Xiamen Island is a dense and high-volume city, and the building functional diversity in three-dimensional space influences human behavior more deeply than the two-dimensional land-use functional diversity.
The Pearson correlation coefficient is used as a criterion to analyze the correlation between urban vitality and land-use diversity. This study defines land-use diversity as the density of land use types in each block. Land-use diversity includes factors such as residential–commercial mixed-use and cultural–commercial mixed-use. Multiple functions are often designed in the same building in dense cities, where functions are allocated vertically. For example, in a typical commercial-residential complex block, a shopping mall is located on floors 1 to 6, offices are located on floors 7 to 15, and residential spaces are built on floors 15 to 30. The land-use diversity could be detected by POI types, which are related to human activities and the functions of the architectural space. This study measured land-use diversity by calculating each block’s Shannon information entropy of POI types density. The estimated figures are presented in Figure 7 below. The results show that the correlation between urban vitality and land-use diversity is .48. The p-value of correlation is less than .001. It indicates that land-use diversity has a significant impact on urban vitality.

The correlation between urban vitality and land-use diversity.
Discussion and Conclusion
This study used empirical data on the urban physical environment and human activities to measure urban vitality by mapping taxi flow in urban space. The result shows that the four dimensions of urban vitality are suitable for capturing the vitality pattern of different spaces. The results show the residents’ movement fluctuates regularly from 12:00 am to 11:00 pm among the blocks. A higher activity intensity was identified in the new district, which was measured by the difference between the intensity of movement on weekdays and weekends more accurately than traditional statistics data. The high vitality blocks are mainly distributed in the old town. In contrast, the middle vitality blocks are primarily concentrated in the new district, and the low vitality blocks are mainly distributed in the suburbs.
The spatial-temporal features of urban expansion in Xiamen Island and the spatial correlations between urban vitality and land-use diversity are shown in the results section. There are two explanations for the relationship between urban vitality, urban expansion, and land-use diversity. The first one is that the urban expansion direction of Xiamen Island is from the old town around the Xiamen Port to the new district around Yundang Lake to form a continuously covered area since1949, which corresponds to the value of urban vitality. On the one hand, urban expansion influences urban construction, which leads to the different diversity and vitality of urban spaces. On the other hand, human activities affect the built-up area development. The other explanation is that land-use diversity significantly impacts urban vitality. This indicates that the physical built environment influences human activities, such as function allocation in 3D dimensions, architecture design, and urban design. Multiple functions in 3D dimensions positively impact the intensity level of urban vitality, as Jane Jacobs emphasized that density itself cannot create urban diversity. Therefore, open communities should be promoted to increase land-use diversity in urban planning, especially to increase building functional diversity in urban design.
The advancement of methodology application, theoretical debate, and practice implications have contributed to the literature. This study introduced the taxi flow as a human activity to the social dimensions of urban vitality. Previous research has proposed many new indicators to investigate urban vitality (Delclòs-Alió & Miralles-Guasch, 2018; Kim, 2018; Sulis et al., 2018; Ye et al., 2018). However, these studies mainly focus on evaluating the effects of urban vitality but still do not consider human activity in physical space and how it affects the built environment. Taxi trajectories data comprises massive spatial-temporal information on residents’ activities and urban vitality (Bai et al., 2018). It can mirror not only the living conditions of residents in the block but also reflect the daily movement behaviors of residents (Chen et al., 2018; S. Zhang et al., 2017). Thus, some scholars utilized the taxi trajectories records as a substitute for the population and applied them to the community livability detection indicators (Ning et al., 2018). The widespread collection and application of taxis’ GPS data enable us to sense urban vitality from traffic flow on a large scale (Kan et al., 2019).
This study enhances our understanding of the relationship between the urban physical environment and human activities based on geospatial big data. The empirical result provides four dimensions to measure urban vitality, which show that Jane Jacobs’s urban vitality theory is valid in a dense Asian urban context. Our proposed measure of urban vitality examined and proved to be a valid approach for urgent vitality research in a large dense city, which can provide recommendations to planning and policy in practice for cities in China and many other countries. Although our analysis is exploratory, it supplements urban vitality theories with quantitative measures. The results show that four dimensions are associated with urban vitality, and land-use diversity plays a more critical role in inducing urban vitality.
There are several limitations. The four dimensions in this study may not be the best indexes to detect urban vitality, and we considered adding more indicators like social and economic dimensions in the near future. The model applied in this study, as a cost-effective and time-saving method to draft a vitality map at the block level in the city, can be applied to urgent calls for large-scale and medium-resolution. This study enhances the research of sustainable urban development. Based on the urban vitality assessment map, more studies on residents’ activities and the building environment will be performed in the next step. It is suitable for architects and urban planners to test new urban design or planning regulations to improve urban vitality and satisfy residents’ quality of life. The approach of this study not only measures urban vitality through human activity but also sheds light on guidelines for sustainable urban development.
Footnotes
Declaration of Conflicting Interests
The author(s) declared no potential conflicts of interest with respect to the research, authorship, and/or publication of this article.
Funding
The author(s) disclosed receipt of the following financial support for the research, authorship, and/or publication of this article: This work has been supported by the National Natural Science Foundation of China (Nos. 41801163, 41971157, and 42101169) and the National Social Science Foundation of China (21AZD034).
Ethical Approval
All procedures performed in studies involving human participants were in accordance with the ethical standards of the institutional and/or national research committee and with the 1964 Helsinki declaration and its later amendments or comparable ethical standards. This article does not contain any studies with animals performed by any of the authors. Informed consent was obtained from all individual participants included in the study.