
Abstract
National governments are increasingly exploring how the routine collection of subjective well-being data can be a valuable tool for improving public policy. In particular, health satisfaction is an indicator of subjective well-being which can be helpful in evaluating and improving of health policy. This study aimed to examine patterns and determinants of health satisfaction across provinces, considering how its measurement can help governments to deliver more effective health policy. We used secondary data using Happiness Level Assessment Survey conducted by the Central Statistics Agency of Indonesia involved respondents aged 18 to 98 with response rate in 2014 was 94.2%, while in 2017 was 96.4%. To this end, an analysis was performed on 45,881 responses to the 2014 and 2017 Happiness Level Assessment Survey performed by the Central Agency of Statistics. The results showed that there was a significant difference in health satisfaction in 2017 compared with 2014, with health satisfaction in 2017 is higher than that in 2014. Overall, 12 out of 34 provinces experienced a substantial rise in health satisfaction. Subsequently, multi-level modeling was used to explore the extent to which health satisfaction was associated with different individual-level and provincial-level explanatory variables. Here, the analyses showed that health satisfaction among Indonesians is associated with whether individuals live in urban or rural areas, demographic factors, health-related factors, social capital, and leisure time. Overall, the study helps to illuminate the status of health satisfaction across Indonesia, leading to numerous suggestions for improving health policy.
Introduction
Well-Being in Public Policy
The preamble of the 1945 Constitution of the Republic of Indonesia states that the Indonesian Government “shall protect the whole people of Indonesia and the entire native land. . . in order to improve the public welfare, to advance the intellectual life of the people, and to contribute to the establishment of a world order based on freedom, abiding peace and social justice” (People’s Consultative Assembly of the Republic of Indonesia, 2002). In recognizing the importance of public welfare (which can also be termed public well-being), Indonesia is aligned with many other nations in terms of an expressed duty and obligation to actively support the well-being of their citizens.
Toward this overall aim, national governments are increasingly exploring how the periodic measurement of citizens’ well-being can be effective in the creation and improvement of national and regional policy initiatives. Indeed, well-being can now be assessed accurately at both the individual and national levels (Jayawickreme et al., 2012; Navarro, 2019; Sachs, 2012). Recent studies suggest that the potential value of subjective well-being assessment extends across a wide range of policy areas, such as income and benefits, employment and labor markets, housing and public services, urban design, and public engagement and participation (Dolan, 2006; Mackerron, 2011).
As such, subjective well-being studies are now seen as a valuable tool for both researchers and policy makers, and are expected to be increasingly used to develop and review public policies in years to come (Navarro, 2019). Countries such as France, Germany, the Netherlands, Italy, Japan, and Ecuador are amongst the front-runners in efforts to gain a better understanding of people’s lives at the individual, household, and regional levels, although there is still scope to further improve the use of subjective well-being measures globally (Okulicz-Kozaryn, 2016). In the more forward-thinking countries, standard metrics of economic progress are increasingly being complemented with well-being measures, to better depict changes in quality of life (Layard, 2011; Sachs, 2012; Stiglitz, 2011; Veenhoven, 2012).
Exactly how subjective well-being is conceptualized and operationalized differs from case to case. In academia, it is recognized that well-being is a multidimensional concept, encompassing satisfaction across multiple different areas of life called domain satisfactions (D’Agostino et al., 2019; Rojas, 2006). For example, different domain satisfaction measures might include the individual’s satisfaction with finances, career, health, housing, recreation, the climate, marriage, friendships, welfare, standard of living, and/or social relationships. These domains are relatively independent of one another, meaning people are easily able to differentiate the domains and evaluate them separately (Dolan & Kahneman, 2014).
Indeed, from the perspective of the policy-maker, the design and assessment of public policies may be better served by the measurement of domain-specific measures of satisfaction which are determinants of subjective well-being, rather than just a single global measure of well-being (Kesavayuth et al., 2015; Steiber, 2019). Although there is no consensus in the literature on which domains are conceptually preferable, it has been shown that the standard and most important determinants of subjective well-being are financial condition, job satisfaction, and health (Navarro, 2019).
The Present Study
In recent years health policies have been measured by objective indicators for example: life expectancy, the number of stunting children. However, little known is in measuring health policy using subjective measures like health satisfaction. The majority of previous research into health satisfaction has been carried out in economically developed countries. Consequently, little is known about satisfaction with health in developing countries, such as Indonesia. Overall, Indonesia is far behind more developed countries when it comes to using subjective well-being data to shape and improve public policy. Instead, national development policies since the 1970s have been focused on efforts to increase citizens’ well-being through intensive economic development. As such, the aim of the present study is to explore the utility of using subjective well-being data in public policy in Indonesia. Indeed, the same aim has recently been endorsed by the Indonesian government, who in 2013 commissioned the Central Agency of Statistics to conduct a survey on the subjective well-being of the Indonesian people. In this study we use that dataset to explore the role of well-being data in public policy, with a particular focus on the domain of health satisfaction.
This study aims to examine patterns and determinants of health satisfaction across provinces in Indonesia, considering how its measurement can help governments to deliver more effective health policy. This study may contribute the recent literatures on how health policy can be assessed and improved using data on the health satisfaction and subjective well-being of Indonesian citizens. Moreover, this study uses an advanced method exploring how contextual factors can be addressed for understanding health satisfaction.
Health Satisfaction: Definition, Correlates, and Public Policy
Health satisfaction can essentially be defined as the level of satisfaction with the state of one’s health. It is a subjective and general measure, bounded to the present time with respect to the overall condition of one’s health or illness, encompassing a variety of possible physical and mental ailments (Easterlin, 2016).
Correlates of Health Satisfaction
Perhaps unsurprisingly, several studies have shown that health satisfaction is strongly associated with the healthiness of one’s lifestyle and the presence or absence of individual health issues. Indeed, from a physical point of view, there is a strong correlation between recreational activities and physical health (Heo et al., 2013). Similarly, Navarro (2019) found that exercise activities have a positive relationship with health satisfaction, whereas seeing a doctor had a negative relationship with health satisfaction. Certain ailments are more likely to lead to health dissatisfaction than others. For example, the study by Graham et al. (2011) found that overall health satisfaction and happiness are more strongly affected by anxiety and pain than by physical problems, due to the constant uncertainty posed by these types of complaints.
Whilst the general association between illness and health satisfaction is clear, the relationship can be moderated in various ways by different demographic factors. An analysis of the British Household Panel Survey by Kesavayuth et al. (2015) found that men with multiple physical ailments are more adversely affected than those with a single physical illness, but the same is not true for women. The same study also found that women with high agreeableness and/or low conscientiousness were less adversely affected by mental illness than other women, but personality did not appear to affect how men cope with illness.
In addition to physical and mental health ailments, numerous other factors have been associated with health satisfaction. One such factor is the amount of time one has available for leisure activities. In a study of migrants in South Korea, Kim et al. (2018) found that leisure time was positively and significantly associated with both health and life satisfaction, as this provided individuals with greater opportunities for beneficial physical activities and social activities, both outdoors and at home. This is particularly important for elderly adults, for whom physical activity during leisure time is associated with various physical health, psychological health, cognitive, and social benefits (Vogel et al., 2009).
Another important correlate of health satisfaction is social capital, which can be defined as the potential to secure benefits through membership in social networks. For example, Navarro (2019) found that the two major types of social capital, bonding capital (i.e., closed networks of highly similar individuals, such as relatives and friends) and bridging capital (i.e., formal associations where ties cut across different social groups) are both positively associated with health satisfaction. Similarly, Yamaoka (2008) found that a lack of trust in organizations and a lack of a person to trust were also associated with poorer health satisfaction.
Health Satisfaction in Public Policy
The measurement of health satisfaction is particularly useful in the design and evaluation of public policy related to health care and medical expenditure (Daroudi et al., 2016). For example, Roh and Weon (2020) conducted a study into satisfaction with health and public policy amongst elderly people in South Korea, finding that elderly people living with family had higher health satisfaction and overall life satisfaction than elderly people who lived alone. This study demonstrates the utility of measuring health satisfaction in order to identify demographic groups with a higher likelihood of health complaints and poorer well-being, so that focused interventions can subsequently be delivered to these groups.
Another study, by Petilliot (2017), provides another example of the utility of measuring health satisfaction. In this study, conducted using a sample of German adolescents, the author finds no significant difference between privately-insured individuals and publicly-insured individuals with respect to subjective health, measured by self-assessed health status and health satisfaction. This finding led to the conclusion that the alignment of private and public health insurance could result in the saving of billions of euros, without any detriment to individual health.
Other researchers have focused on how health satisfaction can be affected by demographic factors. For example, Easterlin (2016) found that age was significantly associated with health satisfaction, such that elderly people tend to be less satisfied with their health than younger people. This study also found that being from a minority ethnic group and having lower education were also risk factors for having poorer health satisfaction. In terms of location, Roh and Weon (2020) found that individuals residing in medium-sized cities have a higher degree of health satisfaction than those living in major cities, whereas individuals living in rural areas have no substantial difference with those living in large cities.
Researchers have also explored the health satisfaction of entire populations, focusing on the national and/or international level. This research has shown that, within countries, richer citizens tend to be more satisfied with their health, but nonetheless health satisfaction is surprisingly high in some poor countries, like Guatemala, and surprisingly low in wealthier countries (Graham et al., 2011). However, a change of life circumstance can disrupt this relationship. The results of a nationwide survey in Germany, conducted by Bauer et al. (2020), showed that in the first years after migration among Syrian refugees, pre-migration socioeconomic gradient was not associated with health satisfaction.
Methods
Data
This study uses data from the 2014 and 2017 Happiness Level Measurement Survey conducted by the Indonesian Central Agency of Statistics. The survey was implemented simultaneously in 34 provinces throughout Indonesia. The unit of analysis was the household, and the sample consisted of households which were selected randomly using two-stage sampling. Each household was allocated to a particular data collection area, so that the socio-economic conditions of the households in each district could be calculated. In order to estimate the level of happiness at the provincial level, it was calculated that the sample should consist of 75,000 households from the 487 districts/cities within the 34 provinces The age of respondents ranged between 18 to 98 years old. The response rate in 2014 was 94.2%, while in 2017 was 96.4%. In terms of weights, this survey used design weight. Due to data missingness, a total of 18,924 surveys in 2014 and 26,957 surveys in 2017 were collected which had full responses for all variables of interest.
The survey covers a comprehensive range of variables for measuring happiness and subjective well-being, including health satisfaction. The questionnaire includes information on sex, age, educational attainment, marital status, the presence of any illness or health problem, health satisfaction, and leisure time.
Measures
We follow previous research in using a single-item question for measuring health satisfaction. The question has been verified in different countries and settings including Germany, Spain, Korea, United Kingdom, Iran (Easterlin, 2016; Karyani et al., 2019; Lim et al., 2016; Navarro, 2019). Specifically, health satisfaction was measured by asking: “Overall, how satisfied are you with your health?” on a 1 to 10 scale, where 1 was “Not satisfied at all” and 10 was “Completely satisfied.”
In addition to measuring health satisfaction, the survey also asked respondents to report various demographic factors, health conditions, and social capital. The full list of variables that were used in the multilevel modeling analysis is shown in Table 1, with a description for each variable. Briefly, demographic factors included gender, age, location status, marital status, household income, and educational attainment. A single item was used for each of these variables, with the respondent selecting the appropriate response from a list of possible options.
Variables Description.

Health conditions were measured in terms of self-reported health complaints, chronic diseases, inpatient or outpatient visits, health maintenance behaviors, and experienced health conditions. Chronic diseases, inpatient visits, and outpatient visits were measured with a binary “Yes/No” response. Different Likert-style responses were used to measure single item health complaints (1 = “Very rarely” and 4 = “Very often”), six items health maintenance behavior (1 = “Very poor health routine” and 6 = “Very good health routine”), and 10 items experienced health conditions (1 = “Very bad health condition” and 10 = “Very good health condition”).
Moreover, the chronic disease for each individual was declared by doctor. The inpatient visits and outpatient visits were reported during the last 6 months by the respondents at the time of the interview. The six items health maintenance behavior include questions about whether the respondents were doing exercise/physical activity, adjusting the diet, having enough rest/sleep, taking vitamins/supplements, conducting health exam/therapy and taking medication, and other activities. Each item was measured with a binary response (Yes/No). The minimum score of 1 indicates that the respondent was performing only one activity in health maintenance and the maximum score of 6 indicates that the respondent was doing all activities. The ten items experienced health conditions were extracted from ten questions, that the respondent was never experienced headache; eating disorders; sleep disorders; feel lonely even in a crowd; feel nervous, tense, anxious, or excessively restless; excessive fear; complain or feel lazy in carrying out daily activities; indigestion; feel tired/tired quickly exaggerated; and the thought came to an end life. The minimum score of 1 indicates that the respondent experienced nine health problem conditions, and the maximum score of 10 indicates that the respondent did not experienced any health problem conditions.
Finally, social capital was measured in terms of trust and social connections. Four items on 5-point Likert scales were used to measure trust, such as “To what extent would you trust your neighbor to look after your house if all your household members are traveling/staying elsewhere?” Responses to this item gave an overall average score between 1 (“Completely untrusting”) and 5 (“Completely trusting”). Social connection was measure with a single question, which asked respondents to report how often they participated in social activities in their neighborhood in the previous year. This was responded to on a scale between 1 (“Completely socially disconnected”) and 4 (“Completely social connected”).
Social capital was measured in terms of trust and social connections. Five items on 5-point Likert scales (1: “Completely untrusting” and 5: “Completely trusting”) were used to measure trust and four items on 4-point Likert scales (1: “Completely socially disconnected” and 4: “Completely socially connected”) were used to measure social connections.
The five items trust variable include questions about whether trusting neighbor to look after house if all household members are traveling/staying elsewhere; neighbor to look after children (age 1–12 years old) if there was no any helper at home; religious leaders in the neighborhood can play role models/moral guides for citizens; community leaders in the neighborhood play roles in helping people to solve problems; and the village government has carried out its duties properly. The four items for social connections variable include whether socially connected with neighbor activities during the last 1 year in joining activities for the public interest; joining activities to help residents who are experiencing disaster; joining religious activities; and joining community social activities. Finally, leisure time was measured in hours, indicating the usual amount of free time having in 1 week for an individual.
The use of a multilevel modeling strategy also enabled provincial-level explanatory variables to be tested, alongside the individual-level predictors measured in the survey. Specifically, the explanatory predictors at the provincial level were the sub-indexes of the public health development index, which ranged from 0 to 1.
Specifically, the explanatory predictors at the provincial level were the sub-indexes of the public health development index (health services and health behavior), which ranged from 0 to 1. These sub-indexes were taken from the Public Health Development Index book published by National Institute of Health Research and Development (The Ministry of Health of Indonesia, 2018).
Analytic Strategy
The analysis started by descriptively exploring the differences in average health satisfaction between 2014 and 2017 for each province. Independent two-sample t tests were used to test for two differences in health satisfaction averages between 2014 and 2017 for all provinces and each province. As the data have two level structures (individual and provincial levels), modeling is necessary to accommodate the two levels.
Subsequently, the multilevel analysis used the null model to explore whether average province-level health satisfaction varied across provinces. The final step of the analysis was to incorporate the individual- and province-level characteristics related to health satisfaction in the multilevel model.
A multilevel approach for health satisfaction is a suitable framework to account for different levels of variation, so that the effects of both individual-level and provincial-level explanatory variables could be tested. The analyses were performed within the statistical program R, using the lme function within the nlme package Pinheiro et al. (2020) to test the multilevel models.
A null model without predictors was first carried out to ascertain whether health satisfaction varied by province. The null model is given by:

where
The second model is introduced by allowing the intercept to vary across provinces and incorporating possible predictors. This model is called the random intercept model, and can be formulated as follows:

where
The third model is the full multilevel model which allows both the intercept and slopes to vary across provinces. This model is called the random slope model, and can be formulated as follows:
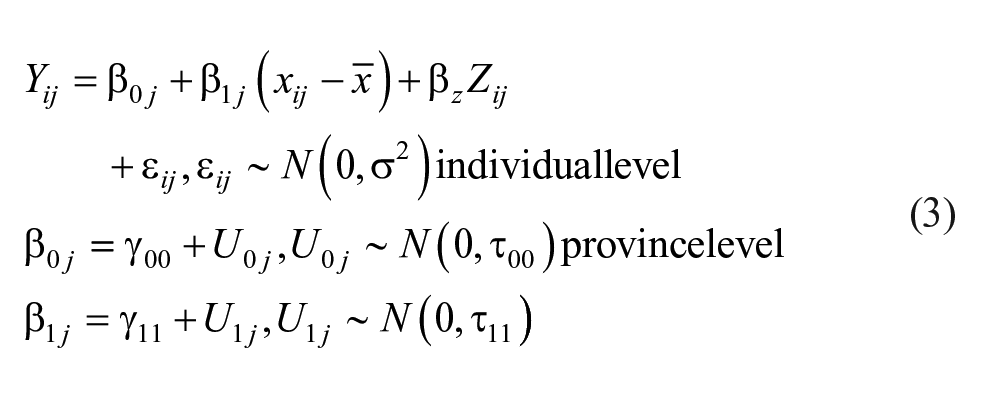
where
Results
Comparison Between Provinces
Table 2 provides a summary of the data for the analysis. The total number of individual observations from 34 provinces were 18,924 in 2014 and 26,957 in 2017. At the province level, we used the provincial sub-index of the public health development index, that is obtained from the book of public health development index published by the National Institute of Health Research and Development. The health satisfaction in 2014 was significantly lower than the health satisfaction in 2017. Scores were low in 2014 for the sub-indexes of health service and health behavior, but increased slightly in 2017.
Descriptive Statistics by Year.

The most noticeable differences across the three-year timespan were for outpatient status, which reduced between 2014 and 2017. In contrast, inpatient status was approximately equivalent in 2014 and 2017.
Figure 1 shows the spatial distribution of health satisfaction across provinces in 2014. In general, there was reasonably high variance in health satisfaction across the different provinces, and within each of the major islands that make up the nation. For example, in Sumatra island, the province of North Sumatera has the lowest average health satisfaction, whereas its neighbor, Aceh, had the highest health satisfaction on the island. Similarly, in Kalimantan, there was relatively high health satisfaction in East Kalimantan compared with the central- and north-side regions on the island. On Sulawesi Island, North Sulawesi is the province with the highest health satisfaction, but neighboring Gorontalo fared more poorly.
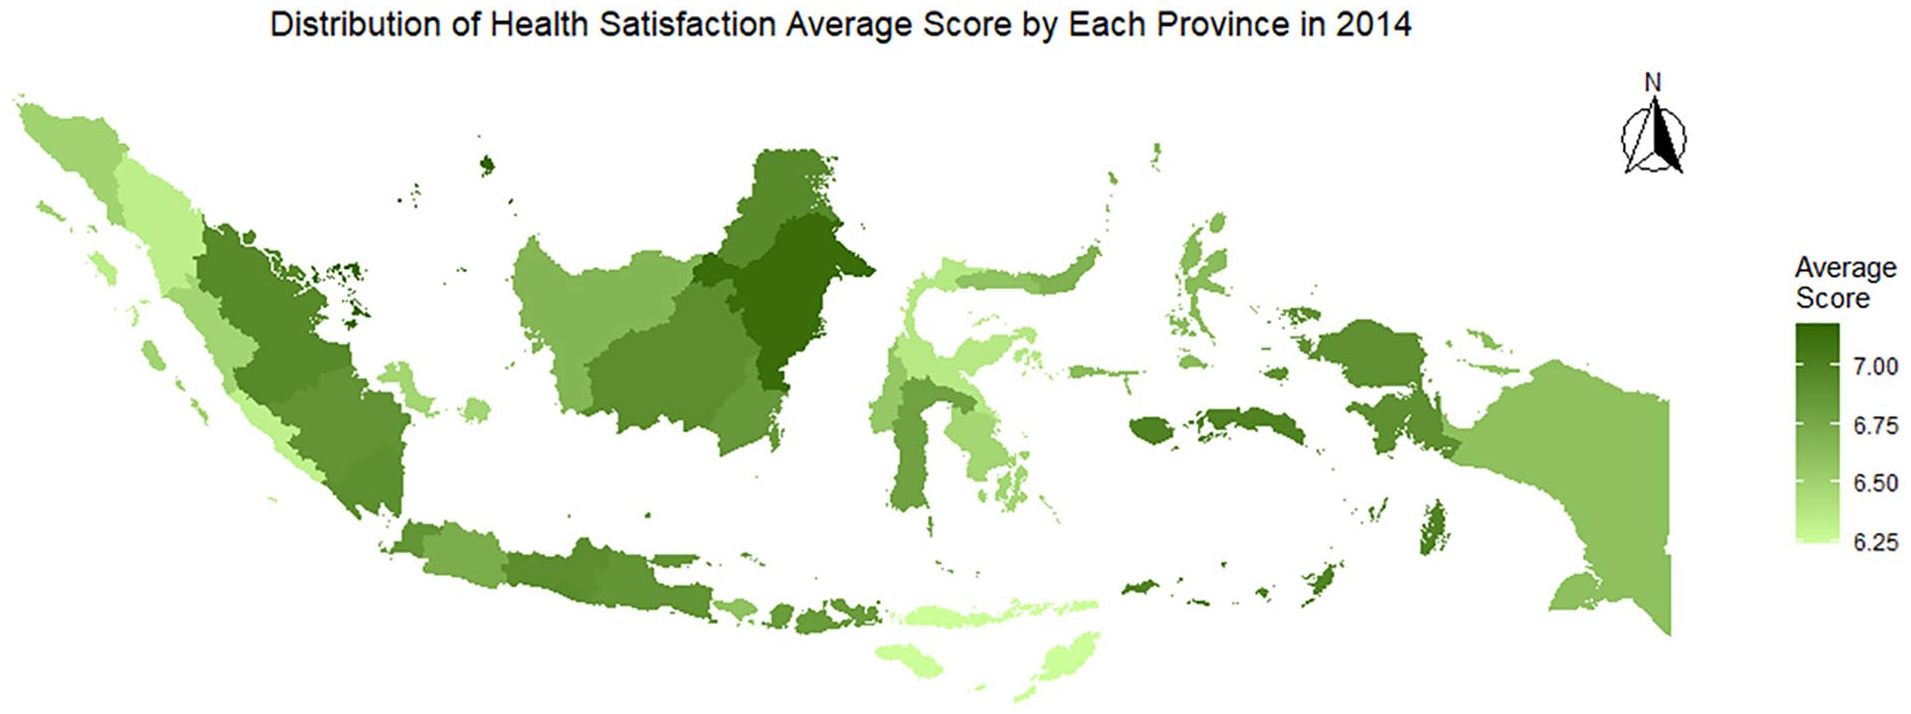
Distribution of average health satisfaction across provinces in Indonesia 2014.
Even the more economically developed parts of the nation, which might be expected to have more prosperous and happy citizens, were actually not the highest scorers for health satisfaction. For example, the capital Jakarta had relatively low health satisfaction. Similarly, Bali, which has a huge tourism economy, had an even lower score. The province with the highest health satisfaction in Indonesia was the Riau Islands. Overall, the provinces that had the highest health satisfaction are those with relatively high levels of development, such as Riau Islands and East Kalimantan. However, not all of the rich provinces had high health satisfaction, indicating that the relationship between level of development and health satisfaction was not straightforward.
Figure 2 shows the spatial distribution of health satisfaction across provinces in 2017. We have found that Riau Islands and South Sumatera, both in Sumatra Island, are among the least satisfied provinces in 2017. Jakarta had the highest health satisfaction of any province in 2017, and East Java was also among the most satisfied provinces.

Distribution of average health satisfaction across provinces in Indonesia 2017.
Again, there was relatively high variance between different provinces and within the different islands of Indonesia. For example, on the island of Kalimantan, there was relatively different in health satisfaction among provinces, East Kalimantan had a relatively higher score than the other provinces. On the island of Sulawesi, North Sulawesi and South Sulawesi had higher health satisfaction than Southeast Sulawesi and Central Sulawesi. However, on Java, health satisfaction in East Java was higher than that of West Java and Central Java.
We compare the difference between provinces in health satisfaction. The Shapiro-Wilk tests for normality in each group (2014:
The results of the two-sample t-test are shown in Table 3, and are also highlighted in Figure 3, which shows the difference in health satisfaction scores between 2014 and 2017 for each province. Overall, the analysis showed that there was a significant difference in mean provincial health satisfaction,
t-Test Results Comparing 2014 and 2017 Years on Health Satisfaction in Each Province.


Average of health satisfaction by province.
To assess the significance of the change in health satisfaction for each province, tests of difference in mean health satisfaction between 2014 and 2017 for 34 provinces were conducted using Bonferroni adjusted alpha levels. Specifically, the overall alpha level (p = .05) was divided by the number of comparisons (n = 34) to give a new adjusted alpha level of .00147 per test. As shown in Table 3, the difference in health satisfaction between 2014 and 2017 was significant in twelve provinces (Aceh, North Sumatra, West Sumatra, Bengkulu, Bangka Belitung, Jakarta, West Java, East Java, East Nusa Tenggara, North Sulawesi, North Maluku, and Papua). In each case, health satisfaction was higher in 2017 than it had been in 2014, as shown by the negative signs of the t-statistic values. In the other 22 provinces, there was no significant difference in health satisfaction between 2014 and 2017.
Multilevel Model
Multilevel models were fitted to test the individual-level and provincial-level predictors of health satisfaction, following the procedure described earlier. Table 4 shows the parameter estimates and standard errors for each of the three models.
Multilevel Models (MLM) Estimates, Fixed Effects, and Random Effects.
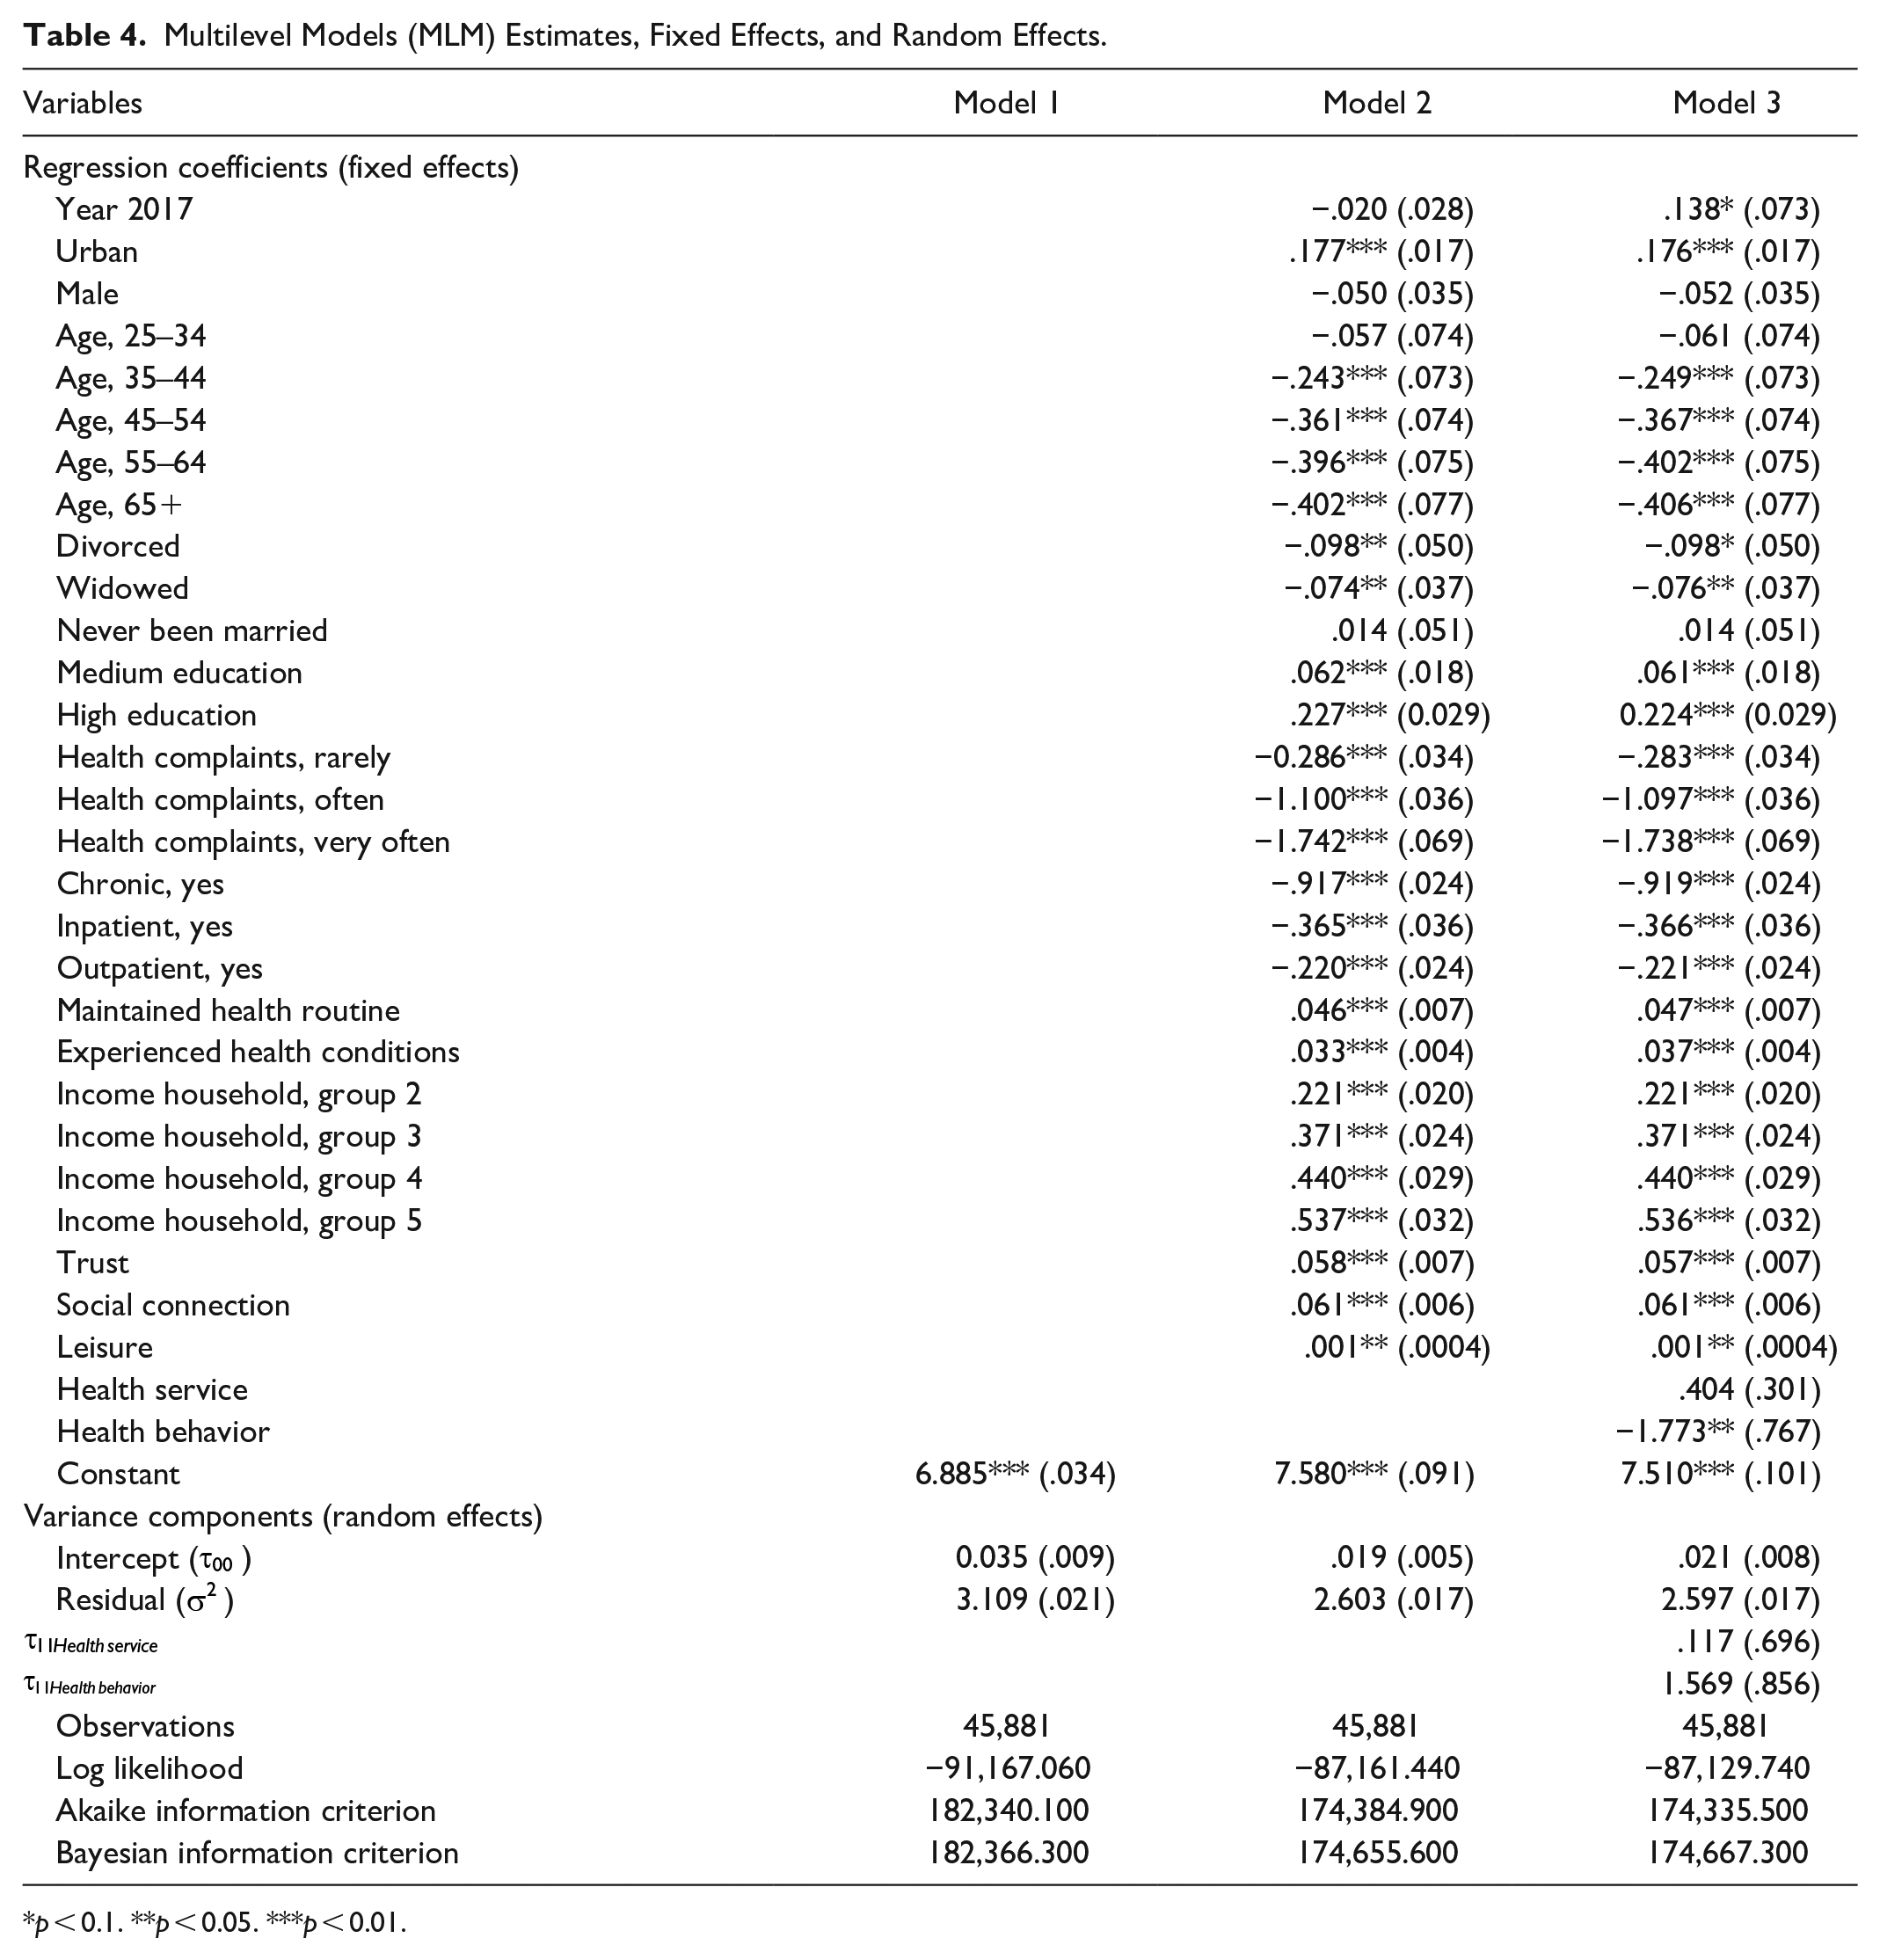
p < 0.1. **p < 0.05. ***p < 0.01.
The first model (the null model) estimates the intercept as 6.885, which is the average of health satisfaction across all provinces and individuals. The variance of the individual-level residual errors (
In the second model (the random intercept model), 14 individual-level predictors were significantly associated (
The average size of the level-2 (
In the third model (the random slope model), the results showed that the increase in health satisfaction in 2017 compared with 2014 was marginally significant (
The results for the individual-level predictors were more or less identical to those in the second model. The estimates showed that individuals with more health complaints and the presence of chronic health conditions were most likely to be dissatisfied with their health. Higher health satisfaction also tended to occur amongst those who lived in urban (rather than rural) areas, who were a younger age, who had not been divorced or widowed, who had higher educational attainment and household income, who were more committed to regularly maintaining their health and reported no health conditions, and who reported that they had not been an inpatient or an outpatient. There was no difference, however, between the average health satisfaction of male and female respondents.
By including individual-level predictors in the multilevel model, the between-province variance (
The inclusion of the health service and health behavior in the model resulted a very small increase in the between-province variance, from 0.019 to 0.021. Meanwhile, a small reduction in the within-province variance was found, from 2.603 to 2.597. This reduction suggests that much of the individual and provincial level variance in health satisfaction was attributable to sociodemographic, leisure and social capital variables at level 1 and health service and health behavior variables at level 2 that were included in the third statistical model.
Discussion
The aim of this study was to examine the factors which influence health satisfaction among Indonesians. The results showed that there was a significant difference in health satisfaction in 2017 compared with 2014, with health satisfaction in 2017 is higher than that in 2014. This suggests that an increased governmental focus on the health and well-being of Indonesian citizens is having a positive impact. In particular, the Indonesian government endeavored to increase the provision of health insurance amongst Indonesian citizens during this time, and that might explain why overall health satisfaction increased amongst the populace. This finding is in line with previous research which looked at the effect of health insurance on health satisfaction.
The pattern of health satisfaction change seems varied. There are 12 provinces experienced a significant increase in health satisfaction, while others seem stable. This variation may be due to the geographical location and public policy applied in each province. For example, some provinces are located in western part of Indonesia and have well-monitored public policy in health but the provinces others do not. In terms the use of multilevel model, this study found that multilevel is useful for estimating health satisfaction among Indonesians. Health satisfaction is not only personal matters, but it is also contextual and governmental matters.
Additionally, the study also identified numerous significant predictors of health satisfaction. Perhaps most obviously, the individual health measures tended to be most strongly associated with health satisfaction. These variables included whether or not the individual is suffering from chronic illnesses, whether or not the individual is still in good health, and whether or not the individual is in outpatient or inpatient care. The importance of these variables is in line with several previous studies (Dolan et al., 2013; Easterlin, 2016), which show that individual health conditions are closely linked to health satisfaction.
Several demographic factors were also significant predictors. In particular, geographical location was one of the main factors which affected health satisfaction, in accordance with previous research showing that geographical factors are determinants of people’s health and subjective well-being (Pierewan & Tampubolon, 2014). The between-province comparisons showed that average health satisfaction varied markedly in different provinces, and was often even very different in neighboring provinces on the same island. The multilevel models also highlighted the importance of urban-rural gradients, showing that people living in urban areas tended to have higher health satisfaction than those living in rural areas. In the Indonesian context, this is likely due to the difference in access to health facilities and also awareness of health between urban and rural residents. This geographic disparity can be a challenging factor in tackling health problems in general. Moreover, with more than 17,000 islands Indonesia faced a serious problem in the provision of health facilities and infrastructures.
Other demographic factors associated with health satisfaction included age, marital status, education and income. The finding that elderly individuals were more likely to be dissatisfied with their health is in line with Easterlin’s (2016) finding that there is a decrease in the level of satisfaction with health with age. The finding that health satisfaction was positively associated with education and income level can be explained with the suggestion that more educated and richer individuals will have better knowledge regarding health, and also better access to health facilities. Finally, with respect to marital status, it was found that health satisfaction tended to be significantly higher amongst married people than in people who had been divorced or widowed. It is also in line with the results of Jones and Schurer (2011). Here, it can be reasoned that the link between marriage status and health can be explained by the fact that marriage provides strong social support, which is intrinsically valuable.
Indeed, social capital variables also emerged as significant predictors of health satisfaction in the present study. Social ties and trusts were both positively associated with health satisfaction, the result that supports Ladusingh and Ngangbam (2016). Possibly, individuals with higher social capital have better access to and knowledge about how to sustain and improve their health status, due to the ability to share knowledge through their social networks. In Indonesian society, social capital is considered to be a vital component in strengthening the quality of life, and monthly gatherings in the community and/or between neighbors are routine activities that are easily found in Indonesia (Putnam et al., 1993). Such activities provide opportune environments to share information related to health and social issues, allowing for the formal and informal dissemination of important public health information.
The final individual-level variable which was significantly associated with health satisfaction was leisure time. The results showed that individuals with a higher amount of leisure time tended to be more satisfied with their health than those with less leisure time available. This interpretation is in line with the results presented by Knecht et al. (2011). It is a central challenge for the individuals to regulate their time and find a balance between work and life, and the results here imply that individuals who struggle to adequately find sufficient leisure time are at risk of developing poorer health as a result.
The results also highlight the individual factors which is strongly associated with health satisfaction, which could help to improve health interventions delivered in the future. Whilst certain predictors are relatively intuitive (e.g., due to the process of ageing, elderly individuals will inevitably always be less satisfied with their health than younger individuals), other variables highlighted here can be explicitly targeted for improvement by policy makers in healthcare. For example, the finding that social capital is positively associate with health satisfaction highlights the importance of ensuring that social opportunities remain available within communities. Interventions might look to enhance these opportunities in rural areas, where chance encounters between individuals happen less frequently.
At the provincial level, the analysis revealed that health satisfaction had a significant negative association with health behavior in the province. This was a puzzling result, as it would be expected that a higher number of health behaviors would result in better health and, consequently, higher health satisfaction. Possibly, the result can be explained by a slight modification of the “neighbors as negatives” hypothesis, which states that people who live in higher-earning neighborhoods tend to have overall lower levels of happiness, due to comparing themselves unfavorably with even wealthier neighbors (Luttmer, 2005). In the same vein, people living in communities with a norm for healthy behavior might have lower health satisfaction due to constantly comparing themselves with neighbors who appear to be acting in a healthier way.
The rise in overall health satisfaction between 2014 and 2017 in Indonesia can be attributed to the action taken by the Indonesian government to extend the provision of health insurance to a greater proportion of the country. As such, one of the major implications of the present study is that there are clear benefits of providing health insurance for the community, particularly amongst lower- and middle-income people. Moreover, the development of health facilities across provinces in Indonesia may be associated with the satisfaction with health. The policy that can be made by government for maintaining health satisfaction include the provision other services especially in under-developed provinces which are quite far below the average. For example, provinces that can provide the needs for citizens’ health may have better health satisfaction than the provinces do not provide yet. Overall, we can use the measure of health satisfaction for measuring the effectiveness health policy and informing the policy makers to have more evidence-informed decision making.
Whilst there was an overall rise in health satisfaction between 2014 and 2017, this improvement was only observed in one third of provinces overall. Hence, there is also a clear impetus to direct extra focus on the remaining two thirds of provinces for which there was no improvement in health satisfaction. In future research and practice, it will be necessary to identify the unique health concerns experienced within each province, and design and implement targeted interventions to address them. In this way, health satisfaction data can be used by national and local governments to evaluate the extent to which current the current health infrastructure and health policy is meeting the health needs of the Indonesian people.
Conclusion
The aim of this study was to examine patterns and which factors predict health satisfaction amongst Indonesian citizens. The main finding of this study is that there was a small improvement in health satisfaction between 2014 and 2017, which can likely be attributed to increased health insurance provision amongst Indonesian citizens following an effective campaign by the government. Additionally, the analyses highlighted numerous variables which were associated with the health satisfaction of Indonesian citizens, such as whether individuals live in urban or rural areas, demographic factors, individual health-related factors, social capital, leisure time and health-related contextual factors. The strength of this study was among the first study exploring the possibilities of health satisfaction as a subjective measure to understand the effectiveness of health policy in a developing country. At the same time, this paper used a more advanced model which is multilevel model to estimate the variation health satisfaction among provinces in Indonesia.
The major implication of the study is the suggestion that the Government needs to improve health insurance services, as this can be an effective strategy to help individuals increase their satisfaction with health. Given that subjective health satisfaction is strongly associated with actual health, this will be an effective way of meeting the nation’s stated desire of supporting the public welfare of its citizens. Another major objective of the Government should be to reduce the healthcare gap between rural and urban areas of the country, which was highlighted in this study in terms of health satisfaction. Finally, given that social factors were also significantly associated with health satisfaction, the Government should strengthen social structures and social capital to form community resilience and increase satisfaction with health.
This study has several limitations which should be briefly noted. First, it may also be useful to explore additional levels within the multilevel models. The models included individual-level and provincial-level explanatory variables, but other levels could be considered as well. For example, within each province there are different districts, which might be quite different from one another. Possibly, testing a three-level model (i.e., individuals nested within districts nested within provinces), an even more comprehensive understanding of the different influences on health satisfaction could be attained. Second, it should be noted that the data provided is cross-sectional data. As such, it is possible to test for significant associations between different variables of interest, but not possible to test for causality. In future research on health satisfaction, it would be valuable to complement the present findings that follows the same individual over time, in order to better test assumptions about the causes of health satisfaction. Finally, the dataset contained a large amount of missing data, which reduces the power of the analysis. In future research it would be valuable to improve the data collection process and significantly reduce the proportion of missing data, so that a larger dataset with greater statistical power can be used in the analysis.
In general, this study provides an overview of how subjective well-being data, in this case relating to health satisfaction, can be effectively used in order to design health policies. Survey responses can be used to assess general well-being, as well as to evaluate the impact of particular interventions. In this way, subjective well-being data can help governments to design health policies which are optimally effective and completely in accordance with the needs of the community.
Footnotes
Declaration of Conflicting Interests
The author(s) declared no potential conflicts of interest with respect to the research, authorship, and/or publication of this article.
Funding
The author(s) disclosed receipt of the following financial support for the research, authorship, and/or publication of this article: Grant from Indonesia Open University, grant number 18803/UN31.LPPM/PM/2020.