
Abstract
Streetscape is an important factor that forms the image of a city. The visual value and preference in streetscape images need to be measured by examining the interaction between places and visitors in the real environment. The study applied a method to recognize and evaluate urban streetscape from the perspective of tour bus passengers, and proved its effectiveness in streetscape visual attraction research. In this study, a visitor-employed photography (VEP) survey was conducted along 32 blocks on the No. 1 urban tour bus (with an average speed of 28 km/h) in Suzhou, China; the visual attributes and significance of urban streetscapes were recognized through empirical research on tour bus visitors’ on-site experience. The researcher cultivated the emotional motivations and block distribution captured by 30 respondents through analyzing the types of photos the respondents liked and disliked. The results of this study show that, in general, positive streetscape types tend to be of regional landscape, with cultural and readable emotional motivations. Negative streetscape types tend to be of modern architecture and construction sites, with unreadable and unattractive emotional motivations. The block cluster analysis, based on the average frequency/km of positive and negative streetscape photos, shows that the four block unit clusters were perceived by visitors with deviation between the land use image and the planned land use. The bus VEP method revealed that the visual attractiveness and preferences of streetscape were highly context-specific, rather than for performance.
Keywords
Introduction
Streetscape is an increasingly important visual environment in the urban process. City managers, planners, tourists, and urban residents usually associate them with urban image, public health, tourist destination imagery, and public space creation (Balomenou & Garrod, 2014; Lu, 2019; Ramires et al., 2018). Researchers have applied questionnaires, interviews, photo elicitation, virtual landscape simulation, and Google Streetscape View (GSV) analysis to study the specific structure of urban streetscapes and explain its relationship to the users’ cognition and behavior (Doersch et al., 2012; Dubey et al., 2016; Lindal & Hartig, 2013; Lynch, 1960; Tandon & Sehgal, 2017). In most of the studies, the surveys of urban street scenes use off-site methods, a few of which only focus on streetscape nodes, such as squares and tourist attractions, rather than a continuous street scene experience (Askarizad & Safari, 2020). Researchers have found that people’s preferences for natural landscapes are related to their recreational potential (Nielsen et al., 2012), while preferences for urban landscape are related to culture and esthetics (Ramires et al., 2018). However, the preference for streetscape as a linear space has not been widely considered from the perspective of visitors’ on-site experience.
If people are asked to visit a particular streetscape to take both positive or negative photos from their perspective, what will they capture? Why are they capturing it? What block images do they perceive? The answers to these questions could improve the theoretical understanding of streetscape perception and evaluation, and provide useful evidence for streetscape planning and management practices. In this study, on-site streetscape perception and evaluation is explored along the streets on a city tour bus, and it is related to the visitor-employed photography (VEP) method of visual landscape perception and interpretation.
Urban Design and Streetscape Imagery
The urban landscape “creates” the human experience through experiences and perceptions; we, ourselves, constitute the image of the urban environment (Abu-Ghazzeh, 1997). Appleyard believed that if a place conveyed the structure and form of clarity and uniqueness, it was unforgettable. This perceptual property is called imageability (Appleyard, 1970).
Based on the substantial value of environmental imageability, more studies have shown that urban street environment elements were connected to people’s visual perception. Researchers have proven that the physical features of urban street environments, including land use patterns, block size and form, street width, architectural styles and facades, building height, traffic volume, pedestrians, street furniture, and greening, will influence personal cognitive and emotional responses, such as security, beauty, enclosure, comfort, calmness, pleasure, and attention (Abu-Ghazzeh, 1997; Lindal & Hartig, 2013, 2015; Millstein et al., 2013; Painter, 1996; Van Cauwenberg et al., 2016). Some empirical studies on urban design have revolved around related concepts (e.g., transparency, legibility, linkability, coherence, complexity, mystery, sense of place, and place attachment) and explored the characteristics, influence factors, and mechanism of people’s emotional connection to a specific street landscape (Abdulkarim & Nasar, 2014; Carmona, 2003; Ewing & Handy, 2009; Gehl et al., 2006; Lynch, 1960; Motoyama & Hanyu, 2014; Sun & Yu, 2021; Tandon & Sehgal, 2017).
Recent advancements in sensing and computing technologies have provided people with many panoramic images obtained from the street environment. Some researchers employ deep learning technologies to segment and extract streetscape elements from big data sources, such as GSV images, and use the color information in the GSV images to quantify the level of green space at street level (Li et al., 2015; Seiferling et al., 2017). Additionally, various studies used street images with geographical location information to discover the unique visual features of the city, such as recognizing city identity (Dubey et al., 2016; Zhou et al., 2014), detection of building typology (Gonzalez et al., 2020), visual features distinguishing architectural elements (Doersch et al., 2012), and quantifying image perception of public spaces (Rossetti et al., 2019; Tang & Long, 2019). Generally, the study of urban streetscape included streetscape environment (physical and psychological), evaluation and maintenance (Table 1).
Theoretical Framework.

City Imageability in Tourism Destination Research
In tourism research, the imageability of the urban environment is always related to the tourist destination image. Smith (2005) believes that the image representation can aid tourists’ easy understanding of the complexity of the city they visit. Visitors interact with images before, during, and after a visit to a destination city, and use collective images to fix certain specific images that express its particularity (Tasci & Gartner, 2007). The widely accepted conceptualization divides the image of tourist destination into two interrelated components: cognitive and emotional images (Baloglu, 1997). The former involves individuals’ beliefs and knowledge of the destination, and the latter refers to the emotions and feelings related to the destination (Deng & Li, 2018).
Tourism destination images can provide elements of the qualitative image information to help us understand the impact of tourism on urban space (Brown, 1995), and identify the representations of urban space (Hunter, 2016). In early research, image research on the urban environment mainly used content analysis and photo-elicitation, focusing on the city image in the official travel brochures of tourist attractions, travel guides, postcards, and professional photographs (Balomenou & Garrod, 2019; MacKay & Fesenmaier, 2000; Yüksel & Akgül, 2007).
In recent years, the advent of digital photography has increased the number of photos taken by tourists on trips; shared images publicly posted by tourists on social media platforms (e.g., Flickr) provide distinct visual resources (Paül I Agustí, 2018; Payntar et al., 2021). These user-generated content photos, with geotags, timestamps, and user IDs, can be used to analyze the activity trajectory and preferences of tourists in a destination city (Paül I Agustí, 2018; Payntar et al., 2021).
VEP Methods
VEP is a technique that has been successfully used to understand the landscape experience of tourists (Balomenou & Garrod, 2019). This research method provides participants with cameras and requires them to take photos, graphically describing the environment they experience, and explaining them through corresponding supplementary methods (Qiu et al., 2013). Compared with traditional off-site photo research methods (e.g., photo elicitation), the VEP method combines the physical site, emotions, and sensations (e.g., sight, smell, sound, and touch) for an examination of the direct experience of visitors (Rathmann et al., 2020). In the context of visual sociology, the main advantage of VEP is that it empowers the participants to express their opinions, transferring the responsibilities of the researchers to the participants, and driving the two sides to act together. This largely avoids researcher bias in generating and interpreting images, and minimizes the differences between researchers (Dorwart et al., 2009). VEP is a flexible and open research method that researchers can use to conduct routine and selective analysis of data such as semi-structured and focus group interviews, as well as quantitative analysis of photo content, based on research objectives (Fung & Jim, 2015; Groves & Timothy, 2001).
VEP has been widely used in landscape preference assessment. It can effectively and quickly measure landscape environment and real-time response, and is suitable for various field conditions, especially linear environments, such as forest roads (Heyman, 2012; Nielsen et al., 2012), pilgrimage routes (Gou & Shibata, 2017), and rivers (Mühl, 2020). The VEP method has the characteristics of public participation. It collects personalized environmental experiences and generates a general “group image” through researcher analysis (Balomenou & Garrod, 2014); thus, it is also used to evaluate the tourist destination image (Bapiri et al., 2021), outdoor entertainment experience (Fefer et al., 2020; Qiu et al., 2013), tourism planning decisions (Balomenou & Garrod, 2014), natural resource management (Heyman, 2012; Rathmann et al., 2020; Sun et al., 2019; Taylor et al., 1995), and place consumption (Nielsen & Møller, 2016). In VEP surveys focusing on forest environmental evaluations, previous theories, such as environmental preference, biophilia, scenic landscape quality, and visible stewardship, were usually used to explain the reasons for visitors’ environmental preferences (Kaplan & Kaplan, 1989; Nielsen et al., 2012; Qiu et al., 2013).
One of the challenges of urban design and management research is that the visual value and preferences of streetscape images need to be measured by examining the interaction between places and visitors in the real environment, rather than by off-site photo identification and quantitative analysis. VEP is an effective method to link cognitive images and emotional meanings of a specific place to visitors, avoiding the limitations of off-site research. Based on a comprehensive literature review, to the authors’ knowledge, no similar research explores the positive and negative visual interaction between the visitor and the linear streetscape from the visitor’s perspective.
Therefore, this research aims to recognize and understand the visual attributes and meaning of urban streetscapes through empirical research on visitors’ on-site experience. The specific research goals of this study are to ascertain:
(1) What types of streetscape attributes do people like and dislike, and what are their emotional motivations?
(2) What are the correlations between captured streetscape types and emotional motivations?
(3) What is the consistency between perceived land use by captured streetscape imagery and the planned land use?
Methodology
Study area and Environmental setting
Suzhou, a city with more than 2,000 years of history, is located in southeast China and is famous for its historical sites and classical gardens. The tourist bus line 1, running through the old urban area of Suzhou and encircling the west city, was the site for our streetscape imagery research. The tourist bus line 1 goes through most tourist attractions (N = 19) and has the highest tourist ride rate (35%); therefore, it was chosen by five experts and six bus dispatchers, in comparison to 10 bus tourist routes. The whole course of line 1 is 23.5 km, with an average speed of 28.6 km/h; 32 blocks with different land use properties are distributed along the route (Figure 1). According to the restrictions of city planning, the land use attributes of these blocks are residential, commercial, green space, and a small amount of industrial.
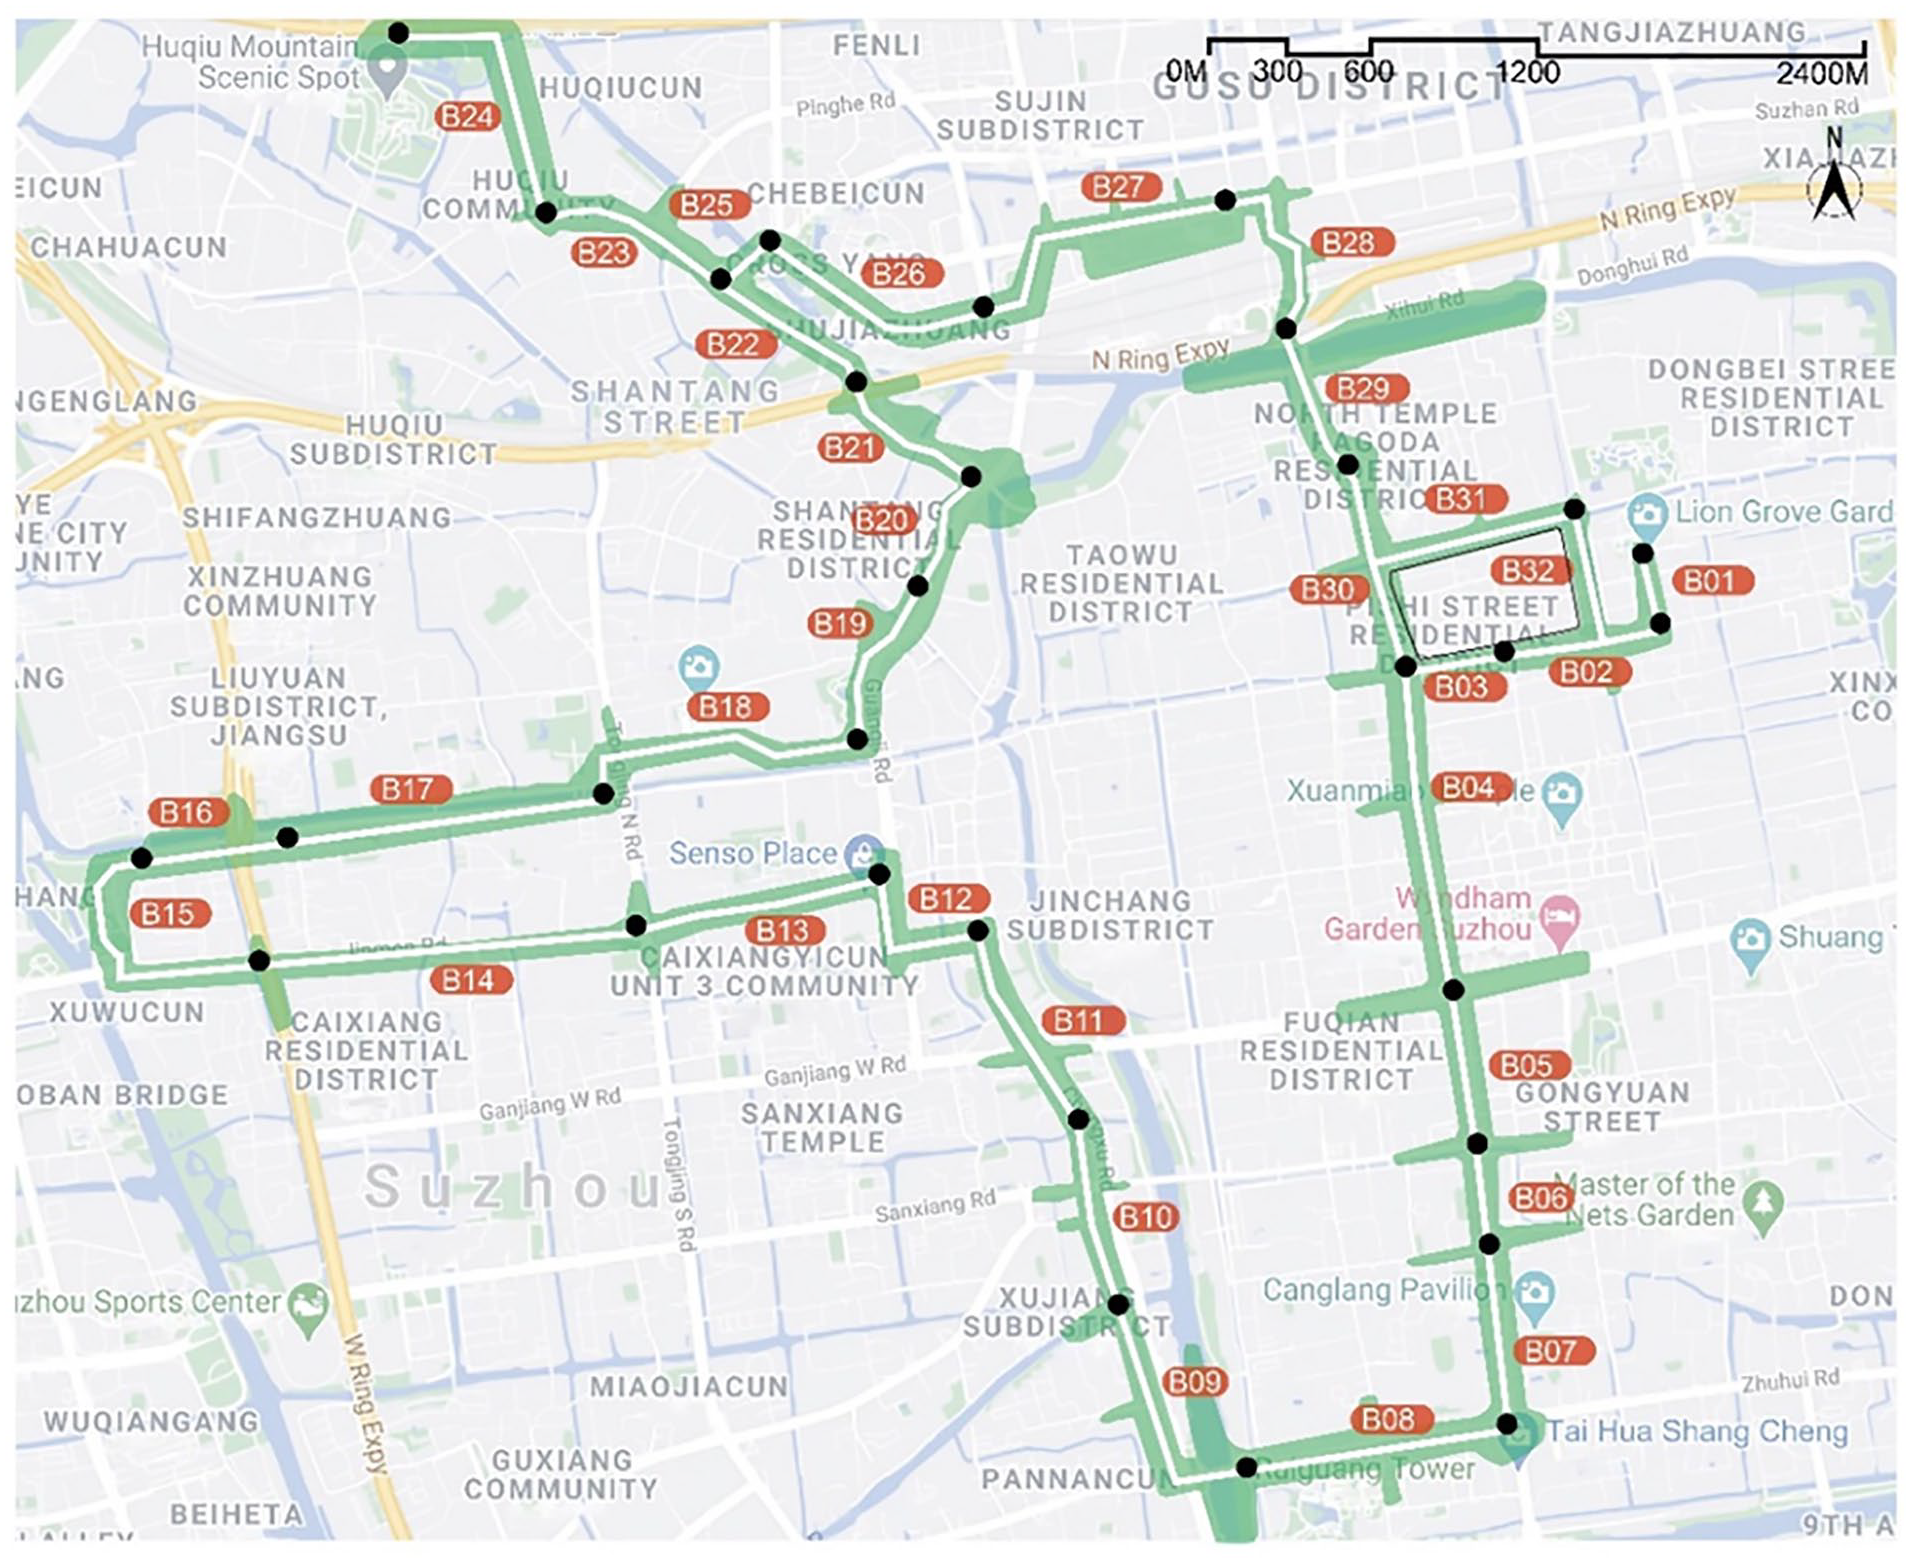
Distribution of blocks alongside the route of tour bus line 1, Suzhou, China. The transparent light green color indicates the sight depth at eye level from the path, measured at 25 m intervals.
Participants
We recruited 31 college student volunteers to participate in this survey through campus announcements. One of the volunteers withdrew due to motion sickness. A total of 30 volunteers were included in the statistical analysis. The volunteers comprised 15 males and 15 females, aged 21 to 26 years (M = 23.31, SD = 1.57); this was their first visit to the surveyed tourist bus route. Previous research has shown that the views of college students tend to reflect prevailing norms, and are more stable than those of other age groups, regarding experience and emotion (Nielsen et al., 2012; Qiu et al., 2013; Shen & Saijo, 2008; Sun et al., 2019).
Procedure
Our VEP survey was conducted on 12 fine weather days from June to October 2020. First, the researchers collected basic demographic information, such as age, gender, and educational background. Then, the visitors boarded the tourist bus line 1 and sat by the windows, using mobile phones for shooting practice on the bus for about 30 minutes. Mobile phones with GPS mode were provided by the researchers; medium and long focal lengths were required; however, the shooting content was not limited. They were asked to take photos of streetscapes they liked and disliked. The visitors took pictures of the streetscape for the 32 blocks on the tour bus route. As the tour bus traveled at an average speed of 28 km/h, visitors could not stop or freely arrange the time for taking photos. When the tour bus goes back and forth, both sides of the street are included, with a 40-minute break in between. In order to avoid the sequence effect, the shooting order of each visitor’s left and right streetscape were randomly ordered. Simultaneously, to avoid weakening the credibility of the VEP, the visitors were not informed of the purposes of the research beforehand. Finally, after the shooting task was completed, a short interview was conducted with all visitors to understand their opinions on their experiences. Each interview was conducted at a coffee shop near the tourist bus line 1 for 20 to 30 minutes. Many ethical issues have been identified and addressed before the VEP fieldwork. The participants granted the photo copyright to the research team in advance, and the research team promised the anonymity of the participants.
Finally, each visitor was asked to select 5 liked and 5 disliked streetscape imagery from the photos taken by themselves; a small number of carefully selected photos allowed the visitors to express their real thoughts as much as possible. A total of 300 photos, 150 each concerning perceived positive and negative attributes, were captured. The interview used the free list method, which allowed the respondents to freely list their views on a topic. Visitors showed their selected photos on the laptop and openly answered the question: “Why did you choose these streetscape imageries for taking a photo?” All answers were voice recorded and later transcribed for further analysis (Figure 2).

Flow diagram of the experimental procedure.
Data Analysis
This analysis was undertaken by the authors. We applied triangulation techniques in the research design to ensure its rigor and reliability (Guba & Lincoln, 1982). The strategies included cross-checking the original audio files, photos, and interview records to ensure information integrity, repeatedly reading survey materials and literature to ensure a reliable interpretation. The statistical analysis was processed by SPSS Statistics 24.0.
Photograph classification
We used qualitative coding to identify the different types of content and the underlying reasons for selecting these streetscape photos. Initially, the photos were collected and classified according to the types of streetscape elements contained in each photo, using the attributes mentioned in the interview records as an important guide for and verification of the categorization. Since the photos were taken on a traveling tourist bus, the subject of each photo may be ambiguous. However, the interview records can obtain the spatial content and details implied in the image. To determine the frequency of streetscape type and emotional motivation, we coded a category for each streetscape photo based on interview records (Table 2). To determine the overall relationship between the positive and negative photos in each category, a paired T test was performed on the difference between the positive and negative photos in each block.
Description of Categories.

Construction of co-occurrence matrices
Co-occurrence matrices were used to present the collective thinking of the visitors in taking streetscape photos and emotional motivations. Previous studies have found that the travel photos taken by interviewees included many somewhat similar image elements and attributes. Co-occurrence analysis can reveal whether the interviewees tend to prefer certain types of images and attributes, and whether these co-occurrences are just coincidences (Li & Stepchenkova, 2012; Stepchenkova & Zhan, 2013). If the probability of any two attributes A and B appearing in the respondent’s answer is expressed as pAB, and the attributes A and B are independent of each other, their co-occurrence scores are a random variable fAB with binomial distribution, and its expected value E and variable Var can be calculated by using the probability standard deviation of attributes A and B, and the corresponding sample size N. To ascertain whether the actual co-occurrence score of any two image attributes in the interview data is significantly different from the expected value obtained under the assumption of image independence, the z-score is calculated as:

In this equation, fAB is the actual co-occurrence score of image attribute A and B, E is the expected value of attributes A and B, and variance Var is the standard deviation of fAB. For the two-directional hypothesis, the test statistic with the critical z-score of the normal distribution (0,1), values 1.96 and 2.58, correspond to the p-values of .05 and .01, respectively (Ritchey, 2007). A larger z-score (in absolute value) indicates that the independence of two image attributes is unlikely. A positive z-score indicates a positive statistical correlation between the two image attributes, and a negative one indicates a negative association.
Two co-occurrence matrices were drawn to aggregate the streetscape that visitors liked and disliked along the tour bus line 1 (Figure 5). Following the idea of the perceptual maps associative network (Cai, 2002; Li & Stepchenkova, 2012), the frequency of one item in co-occurrence tables might reflect its saliency in respondents’ collective mind; the co-occurrence numbers of two items could indicate the strength of the association between a pair of image attributes, and reflected the richness of the information (Li & Stepchenkova, 2012).
Photograph location analysis
To explore the distribution of streetscape as perceived by the respondents, we calculated the number of each block based on the geographic location of the photo shooting point in ArcGIS 10.2 (ESRI, Redlands, CA, USA); the photos were then split according to the block units (B1-B32) in which they were taken. In order to avoid a difference in the number of photos due to different block lengths, the average number of photos per kilometer for each block was calculated (photos number/km). K-means clustering was used to cluster the positive and negative streetscape images for the 32 blocks; the method divides the streetscape into visually distinguishable block units through the perceived preference for like and dislike.
Radar charts were applied in our research to compare the differences between perceived land use imagery and planned land use. Perceived land use image was measured by the average value of the perceived proportion of land use in all blocks in a block unit. For example, if the subject of a photo was a residential house, then the perception of land use was a residential land use image. The planned land use was the average of the planned land use proportions in the block unit, and the data was drawn from the Suzhou Municipal Bureau of Natural Resources and Planning (SMBNRP, 2016).
Results
Liked and Disliked Streetscape Attributes: Types and Emotional Motivation
A paired t-test was used to statistically compare the frequency of the category streetscape types and emotional motivation, to determine systematic differences between positive and negative photos. Table 3 shows that eight out of nine categories on streetscape types had significant statistical differences (p < .05). Overall, the positive photos tended to involve types of street setting, facility feature, and natural feature, whereas negative photos tended to show construction sites. Architecture was the most frequently shot streetscape type. Table 3, Figures 3 and 4 show that the four categories of architecture/building had significant differences. The positive photos tended to be heritage (e.g., temples, N = 19) and eclecticism buildings (e.g., residential houses in historical style, N = 6); negative photos posted more modern buildings (e.g., shopping malls, N = 19).
Streetscape Type Frequencies: Paired t-Test.


Cluster of liked architectural/building photos.
Cluster of disliked architectural/building photos.
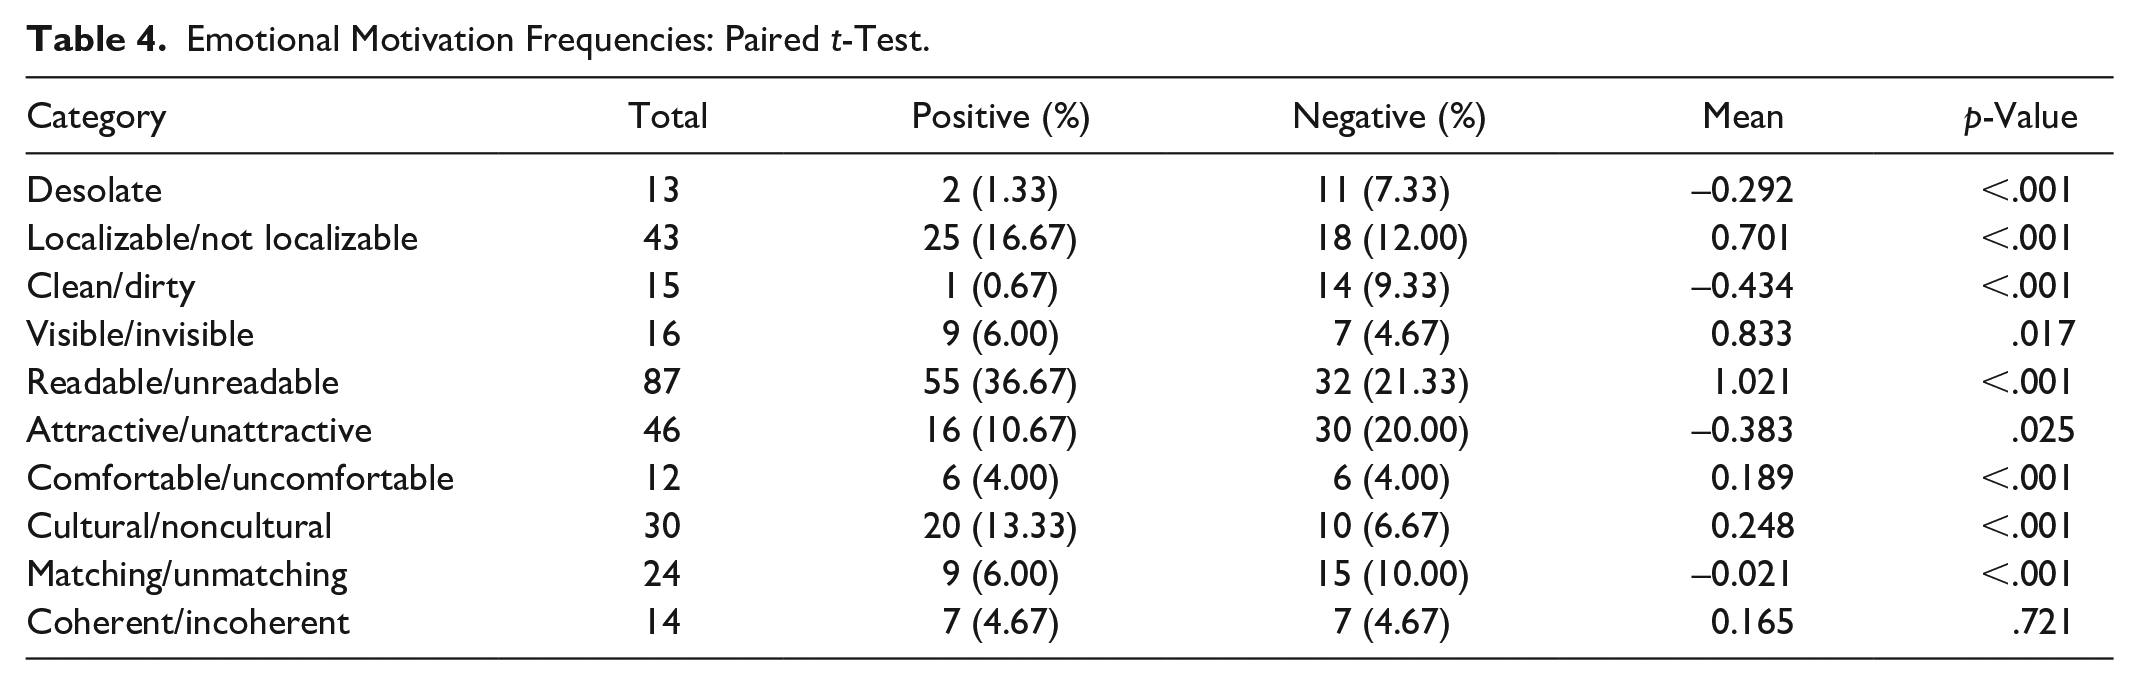
Table 4 shows that 9 out of 10 categories on emotional motivation had significant differences (p < .05). Overall, the emotional motivations expressed in positive photos tended to be more readable (N = 55), localizable (N = 25), and cultural (N = 20), whereas negative photos presented more unreadable (N = 32) and unattractive (N = 30) emotional motivations.
Emotional Motivation Frequencies: Paired t-Test.
Most of the previous urban streetscape preference studies were conducted off-site. For example, the researchers asked the participants to conduct an online assessment of the landscape attributes (such as physical attributes of buildings and natural outdoor environment) in GSV and virtual landscape simulations (Lindal & Hartig, 2013; Zhu et al., 2017). Although these absent studies made it possible to determine general preferences for streetscape types and characteristics, they excluded the real interaction of visitors with the environment (Nielsen et al., 2012). In fact, landscape preferences involved emotions, symbols, cultural elements, the place sense, and their interwovenness with physical space. Thus, on-site landscape experience was a necessary supplement to off-site surveys (Bapiri et al., 2021).
Through the VEP survey of the blocks alongside the city tour bus routes, our study indicated the liked and disliked streetscape types and adopted a different perspective on the quantitative survey that dominates streetscape research. The methodologies were different from previous studies, and the streetscape types generally considered to be liked and disliked were confirmed in our research (Bapiri et al., 2021; Donaire et al., 2014; Ibrahim et al., 2018; Ramires et al., 2018). For example, tourists usually preferred historical sites, religious sites, and local dwellings, and were averse to the interference of urban municipal construction. These studies have been confirmed in the field of tourism and urban planning.
The main contribution of this research was that it went beyond the research scale of VEP surveys while walking, by exploring the real interaction between visitors and the environment at faster speed and longer distance. In general, our research showed that in the frequency of streetscape types and emotional motivations, most of the categories had statistical differences. This result also indicated that, in urban blocks, the liked and disliked physical features (such as buildings, street facilities, plants, and so on.) and visual experience had significant differences. This was different to the results of VEP surveys conducted by walking in urban forests (Nielsen et al., 2012); the result showed that the liked and disliked landscape elements were significantly different, with no significant differences in the captured motivations.
Modern buildings were the most frequently mentioned category (N = 72), including common types, such as shopping malls, hotels, and restaurants. However, unexpectedly, the majority of the visitors held negative perceptions (Table 4). Many visitors believed that although modern buildings indispensably function as living, office, and entertainment spaces in modern cities, the visual style of glass curtain walls, steel, and concrete lacked consideration for the regional cultural context, especially in survey areas with historical memories. This phenomenon could be explained by the scenic landscape quality theory, which assumes that the landscape preferences of urban or forest tourists were guided by the visual quality of the landscape rather than the functional quality (Nielsen et al., 2012; Shelby et al., 2005). In the environmental psychology field, previous research has also shown that visual evaluation of buildings based on environmental esthetics and culture had priority over their performance aspects (Ilbeigi et al., 2019; Zhu et al., 2011).
In addition, the streetscape preference indicators in this study were mainly based on the vocabulary used by laymen (visitors) to express their shoot motivations. Professional landscape esthetics or place identity concepts were rarely mentioned; however, the results could still be explained by the established theoretical framework. For example, the strongest predictors of positive and negative streetscape preferences in this study were both readable. Visitors were unfamiliar with the environmental preference framework of Kaplan and Kaplan (1989); however, when they described the motivation for taking photos as readable, they touched on legibility and mystery; that is, the subject was easy to understand and worth exploring. Used in a similar way, maintenance could explain dirty (Mahrous et al., 2018), and sense of place could explain localizable and cultural (Relph, 1976).
Attribute Co-Occurrences: Streetscape Types and Emotional Motivation
Figure 5a shows the positive streetscape imagery, which was depicted by the co-occurrence frequency for 9 streetscape element and 10 emotional motivation categories. Generally, there were strong positive associations between street settings (N = 32) and cultural (N = 20); the actual co-occurrence value was 11, indicating that the actual co-occurrence frequencies were significantly higher than those expected by chance (z = 3.31, p < .01), and that visitors preferred to take photos of street settings with cultural motivation. The following is the description from a visitor: The street style outside Canglang Pavilion is full of Suzhou characteristics and with cultural considerations (Figure 6). Furthermore, a positive association was significant between heritage buildings (N = 36) and localizable (N = 25); the actual co-occurrence value was 11, showing that visitors tended to take photos of heritage buildings with localizable motivations (z = 2.08, p < .05). This sentiment was echoed by a visitor: It is a picture of Beisi Pagoda, which is a landmark architecture in Suzhou (Figure 7).

Co-occurrence matrix of type and emotional motivation by positive and negative streetscape photos. The big dots indicate a high co-occurrence. The red dots indicate positive correlation, and the blue dots indicate negative correlation; the black outline on the red dots indicate that the effect is significant (z > 1.96, p < .05).
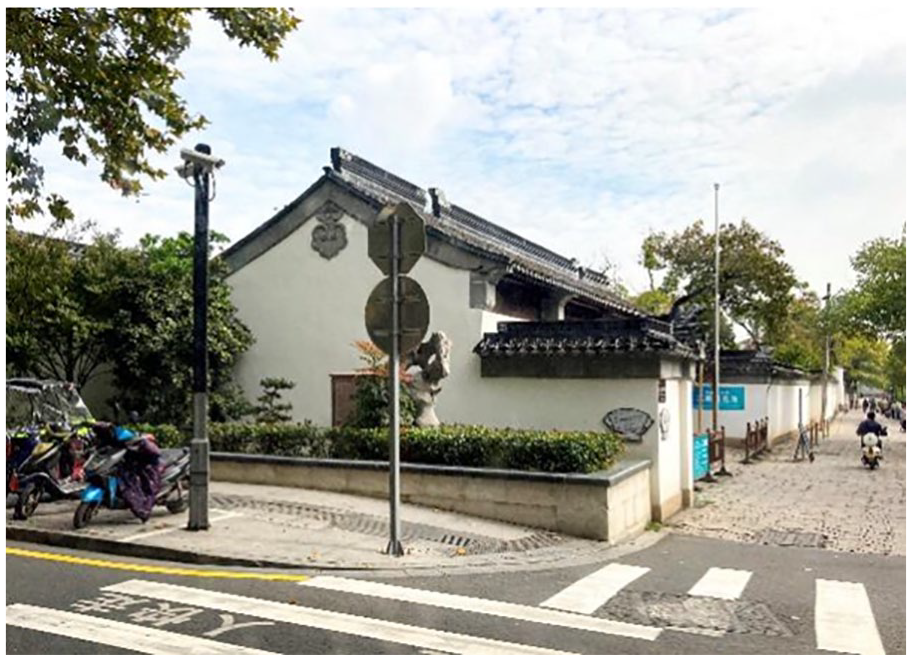
Co-occurrence example of street settings and cultural.

Co-occurrence example of heritage architecture and localizable.
Figure 5b shows the negative streetscape imagery, which was depicted with the co-occurrence frequency of 7 types and 10 emotional motivation categories. The construction site (N = 27) was closely associated with dirty (N = 14) and unreadable (N = 32); the actual co-occurrence values were 9 and 4, respectively. The z-scores were 4.12 (p < .01) and 2.45 (p < .05), indicating that visitors tended to photograph construction sites with negative emotional motives. The following was the description of a visitor: The subway is under construction here, isn’t it? The construction fence blocks half of the street and affects the traffic. It’s not ornamental (Figure 8).

Co-occurrence example of construction site and unreadable.
The actual co-occurrence value was 5 (z = 2.54, p < .05) for eclecticism building (N = 8) and unreadable (N = 32), indicating that visitors tended to regard eclecticism buildings as incomprehensible architectural images. The following is the description from a visitor: In this picture, the tall building seems eye-catching among the low buildings. It’s not French style nor Suzhou style; it’s ambiguous. And we don’t know its function; it’s confusing (Figure 9).

Co-occurrence example of eclecticism building and unreadable.
The modern building (N = 74) had high frequency in negative streetscape imagery, and is co-occurrent with other motivations, such as not localizable (N = 18), unreadable (N = 32), unattractive (N = 30), and unmatching (N = 15). The values were 12, 18, 15, and 11, respectively, but were not statistically significant.
With regard to the second research goal about relation between streetscape types and emotional motivations, previous research had determined the importance VEP surveys in the interaction of landscape attributes and photographic emotions to form the image of tourist destinations (Balomenou & Garrod, 2019; Bapiri et al., 2021; Tseng et al., 2015). All photos and photo tags were classified and coded into positive and negative categories, and the final data set was yes/no data, which allowed researchers to analyze based on frequency statistics. The frequency of occurrence of different landscape types and captured motivations, respectively, revealed the visual attraction and understanding of the visitors; however, effectively analyzing the relationship between them remained a challenge.
Inspired by the city imagery theory (Lynch, 1984), this research combined streetscape cognition with emotional motivation using co-occurrence analysis, and objectively expressed typically liked and disliked streetscape imagery. For example, the significant co-occurrence of landscape attribute street setting and shoot motivation cultural, could be explained as the overall environmental preference established by visitors based on cultural esthetics and appreciation. Studies have found that this was the typical perception attribute of Chinese tourists visiting domestic attractions (Ye et al., 2020).
In fact, both the significant streetscape types and cognitive co-occurrences in this study reflected the attributes of heritage tourism destination imagery, which could be interpreted through tourism anthropology (Ramires et al., 2018). For example, the positive image of heritage building and localizable and the negative image eclecticism building and unreadable were both related to regional culture. The former found an anchor for interaction with historical place, while the latter could not.
Perceptual Bias: Distribution of Streetscape Photos With the Block Units
Figure 10 depicts the frequency distribution of positive and negative streetscape photos /km in the 32 blocks along the tourist bus line 1 route. K-means clustering helped to classify the 32 blocks into four (k = 4) distinct clusters based on the average frequencies of positive and negative streetscape photos/km, to generate a streetscape imagery of the visitors’ preference (Figure 11).

The relationship between streetscape imaginary and space location.

Four block unit clusters based on the frequency of photos/km.
Cluster A presented a strong positive perceived image. The theme focused on the temple (N = 26) and a historical site (N = 8). Cluster B had less positively or negatively perceived images. The positive theme concentrated on a residential house (N = 7) and the railway station (N = 5), while the negative theme concentrated on a shopping mall (N = 8). Cluster C had the most positively and negatively perceived images. The positive theme included residential house (N = 5) and hotel (N = 5), while the negative theme included retail store (N = 6). Cluster D presented strong negatively perceived images. The theme was represented by construction site (N = 16) and shopping mall (N = 6).
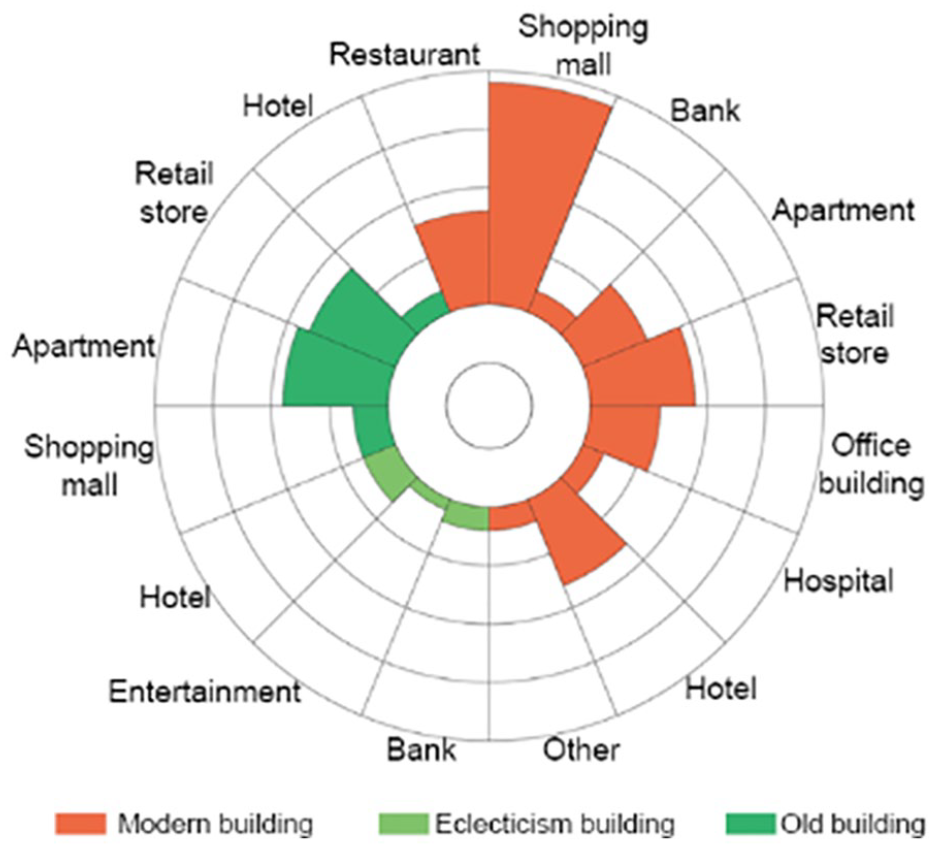
The four radar maps showed in Figure 12 were used as standard distributions to analyze land use. The different shapes revealed the differences between the perceived land use image and the planned land use. Although the planned land for the four block unit clusters, cluster A (64%), cluster B (41.67%), cluster C (55%), and cluster D (77.50%), were mainly for residential land use, the perceived land use image was different. The block unit with more positive photos (cluster A) tended to have a cultural land use image (52.23%), that with fewer positive or negative photos (cluster B) tended to have a commercial land use image (52.23%), that with more positive and negative photos (cluster C) tended to have a transportation land use image (35.41%), and that with more negative photos (cluster D) tended to have commercial (30.12%) and transportation land use images (30.70%).

The differences between the perceived land use image and the planned land use.
It is broadly agreed that visual attractiveness played an important role in shaping the city image (Abu-Ghazzeh, 1997; Filomena et al., 2019; MacKay & Couldwell, 2004; Zhu et al., 2011). In this study, we attempted to cluster the blocks alongside the city tour bus routes into block units, according to the distribution frequency of positive and negative streetscape photos, to compare the differences between the perceived image and the land planning guidelines in each block unit. With respect to the third research goal about correlation between perceived land use and planned land use, our research found differences between perceived and planned land use in all block units (Figure 12). The difference between regional (e.g., historic site) and non-regional imagery (e.g., shopping mall) in shaping block image could be introduced to explain the results in our research. Previous studies had confirmed that the visual attractiveness and symbolism of historical heritage had a positive effect on shaping the image of the city, while noncultural products had difficulty stimulating tourists’ interest (Ramires et al., 2018; Yin & Qian, 2020; Zhu et al., 2011).
Another finding of the research was the important impact of construction sites on the perception of land use. Almost all visitors believed that construction sites had negative visual attractiveness since they changed the existing land use patterns. This result was supported by the “theory of visible stewardship” (Sheppard, 2001). Previous studies found that management and recreational facilities in the forest could not be regarded as a positive contribution to the landscape if they failed to show visible respect for the land and given place.
These findings indicated that urban planners and managers needed to pay more attention to the regional landscape and its positive role in shaping street image, rather than the development of a modern style with globalization, integration, and homogenization, which lacked image identity. Other studies found that clear images and the materialization of collective memories could improve the legibility and distinctiveness of urban landscapes and make residents and visitors feel comfortable, secure, and emotionally involved, to form city identity (Casakin et al., 2015; Lewicka, 2008; Lynch, 1984).
Conclusion
This study was a further exploration of the walking survey method of urban streetscape experience and perception. Previous studies on urban planning and tourist routes usually considered the observation perspective of pedestrians only. And this study employed a method to recognize and evaluate urban streetscape from the perspective of tour bus passengers and proved its effectiveness in streetscape visual attraction research. In particular, it comprehended the interaction between visitors and place in real environment.
Despite the prevailing tendency to study the street environment with big data quantitative analysis captured using GSV (Li et al., 2015; Seiferling et al., 2017), the study demonstrated that bus VEP survey was another way to study street attribution by revealing the engagement of unique image, cognition and emotion. When compared to walking VEP survey, bus VEP expanded the perception range of visual streetscape. Its advantages mainly lied in efficiency and cognitive emotion. Bus EVP survey could explore faster and further than walking EVP, and better reflect the real interaction between people and environment than sensing captured GSV.
The application of VEP method in tour bus extracted the visual cues of streetscape that people liked and disliked, and might be used as the decision-making basis of urban tour bus route planning. Although stakeholders such as residence, commerce, transportation and recreation needed to be considered and included in urban street design, VEP method could employed in evaluating streetscape from the perspective of a particular group in some special studies. If the streetscape attributes of all blocks of the city were evaluated from the VEP perspective of a particular tourist group, favorite tourist bus routes could be designed according to the results, and avoided the least favorite areas at the same time. In addition, the public’s bottom-up perception of streetscape image was very different from the top-down land planning guidelines. Future surveys are expected to focus on combining bus VEP and walking VEP methods to identify and shape urban streetscape after recognizing the limitations. Streetscape image is the main aspect that should be considered by urban planners and policy makers before making urban streetscape planning decisions.
This research was an exploratory attempt and has many limitations. To some extent, the perception depth of bus VEP survey was limited because the respondents by bus were not as free as on foot, and the experience of people interacting with the real environment did not appeal to all senses. In future research, we can try other methods for data collection to expand VEP survey on streetscapes, such as bicycle riding, sound recording, stationary point visits, eye tracking monitoring. In addition, the participants in this study were college students, previous researches had shown that the environmental experience between young and older people, insiders and outsiders, professionals and laypersons, or between physical environments were different, these differences would be reflected on landscape type preferences and shoot motivations (Balomenou & Garrod, 2014; Qiu et al., 2013). In future work, we plan to extend the current findings to a sample of heterogeneous people and explore the perception preferences of streetscape in different urban environments.
Footnotes
Acknowledgements
We would like to thank the 32 participants in our trials on our study.
Declaration of Conflicting Interests
The author(s) declared no potential conflicts of interest with respect to the research, authorship, and/or publication of this article.
Funding
The author(s) disclosed receipt of the following financial support for the research, authorship, and/or publication of this article: This study was funded by the National Key Research and Development Program of China with Project Number 2019YFD1100700, the National Natural Science Foundation of China (NSFC) with Project Number 51778388, Landscape Architecture Discipline Construction Project of Suzhou University of Science and Technology, and Postgraduate Research & Practice Innovation Program of Jiangsu Province with Project Number SJCX20_1129.