
Abstract
We investigate the relation between board diversity and corporate investment decisions. We select four diversity attributes namely, gender, age, tenure, and education diversity to find its impact of corporate investment. Further, we classify these four diversity attributes into surface-level and deep-level diversity to check its impact on investment. Analyzing Chinese non-financial firms over the period of 2003 to 2017, we employ fixed effect regression to test the formulated hypotheses. We deal with the endogeneity concerns and employ several robustness tests. We find that board gender, tenure, and education diversity reduce corporate investment level. Further, we find that gender and age diversity are negatively associated with sensitivity of investment to growth opportunities, while tenure and education diversity are positively related to investment-Q sensitivity. We find that surface-level diversity reduces the sensitivity of investment to growth opportunities, while deep-level diversity positively affects investment-Q sensitivity. Overall, our findings suggest that board’s surface-level diversity is associated with inefficient investment policies, while deep-level diversity improve the corporate investment decisions. This study shows that board diversity play a decisive role in corporate investment decisions. Policies should be devised to mitigate the negative role of surface-level diversity. Furthermore, as deep-level diversity improves investment decisions, organizations and policy-makers should encourage it in order to get benefits of a diverse board. Majority of prior studies consider one dimension of diversity, such as gender, to test its impact on investment decisions. This study shows how surface-level diversity attributes (low job related) and deep-level diversity attributes (highly job related) affect board decisions. This study comprehensively analyzes the impact of board diversity on corporate investment decisions in an emerging economy.
Introduction
Corporate investment has attracted the focus of researchers since the inception of modern finance (Modigliani & Miller, 1958). Various researchers have linked corporate investment policies to different variables, such as financial constraints (Fazzari et al., 1988; Kaplan & Zingales, 1997; Lewellen & Lewellen, 2016; Whited & Wu, 2006), political uncertainty (Chen et al., 2011; Jens, 2017), agency conflict (John et al., 2008; McLean et al., 2012; Stulz, 1990), and ownership structure (Boycko et al., 1996; McConnell & Servaes, 1990). Prior studies have investigated how corporate governance mechanisms can affect the investment decisions; however, they have ignored how board diversity influences corporate investment decisions. As Stein (2003) suggests that two primary sources distort corporate investment policies; that are, agency problems and financing frictions. Due to this agency conflict, managers focus on empire building and invest in projects regardless of the growth opportunities. We propose that board diversity may influence the investment policies by improving monitoring and reducing the agency conflict (Carter et al., 2003; Jensen & Meckling, 1976), and by linking the organization to the external resources as suggested by the resource dependence theory (Carter et al., 2010; Pfeifer & Salancik, 1978).
As some managers have opportunistic behavior, the board plays a critical role in monitoring this opportunistic behavior and activities of the managers (Jensen & Meckling, 1976). This is due to the fact that corporate board functions as a team comprised of several individuals each with their own set of skills. Each team member contributes to the group’s success by utilizing their unique features, knowledge, and abilities (Van Knippenberg & Schippers, 2007). The team members are distinguished by a number of features and attributes, that is, gender, age, tenure, expertise, and education. These members, having the differentiated characteristics form a diverse team. As in this study we focus on the differences in attributes and characteristics of board members, we consider it as diversity in board or board diversity. As corporate boards function as a team, the emphasis should be on how and which features and attributes of the individuals integrate to make the team (Chen, 2013). If the board members’ characteristics are similar, they may be able to rapidly agree on a decision (Marcel et al., 2011); nevertheless, the information extracted from that kind of decision could be little. Diversity on the board can improve information exchange, reduce uncertainty, improve the organization’s resource management, and eventually aid in the development of overall organizational strategy (Hillman & Dalziel, 2003). A group with more diversity will generate a greater number of ideas, increasing the number of alternatives for reaching a conclusion. As a result, variances in the members’ characteristics can help with improved decision-making (Marcel et al., 2011). Several studies have been conducted on the effect of board diversity on different performance outcomes. For example, board diversity and financial performance (Miller & del Carmen Triana, 2009; Reguera-Alvarado et al., 2017; Terjesen et al., 2016; Unite et al., 2019; Vafaei et al., 2015; Van Knippenberg & Schippers, 2007) board diversity and social performance (Coffey & Wang, 1998; Shaukat et al., 2016) board diversity and innovation (Aalbers, 2016; Bernile et al., 2018). This study investigates how diversity in corporate boards influences the investment decisions. Dividing various attributes of diversity into surface-level and deep-level diversity, this study finds that surface-level diversity (gender and age) negatively affects the investment decisions. Drawn from the social identity and similarity-attraction theories, this study suggests that surface-level diversity reduces the group cohesion and weakens the monitoring role of the board to oversight the investment decisions. However, we find that deep-level diversity (tenure and education) improves the corporate investment decisions. Deep-level diversity improves the board’s monitoring role and provide the firm with its knowledge, skills, and experience, which ultimately improves the corporate investment decisions.
This study has several contributions. It extends the corporate governance and investment literature by finding the relationship between board diversity and corporate investment decisions, which is overlooked by previous studies. Moreover, most of the prior studies considered a single attribute of diversity, that is, age or gender, to find its impact of performance outcomes. Only few studies used multiple attributes of diversity to find their combined impact of various performance outcomes. This study contributes to the literature by finding the combined impact of several diversity attributes (gender, age, tenure, and education) on corporate investment level, and sensitivity of investment to growth opportunities, which is overlooked by previous studies. Finally, this study has some implications for regulators and policymakers. This study shows which dimension of diversity improves and which weakens the investment decisions. We observe that deep-level diversity improves the investment decisions; therefore, it should be encouraged. Moreover, policymakers should implement programs to eliminate the adverse impact of surface-level diversity.
Hypothesis Development
Board Diversity and Corporate Investment
Investment is an important corporate decision which creates tensions between managers and shareholders. Hayashi (1982) argue that investment opportunities, which is measured by the Tobin’s Q, should determine corporate investment. However, there are several factors that distort the corporate investment. Stein (2003) argues that financing frictions and agency problems are the two fundamental factors that may result in distortion in the corporate investment decisions. If managers are left with their choices of investment decisions, they may purse their interest at the expense of shareholders’ interest (Jensen, 1986). One way in which managers can pursue their interest at the expense of shareholders’ interest is the willingness of managers to run larger firms instead of profitable firms. Researchers have named this willingness of managers to run large firms as “empire building” (i.e., Jensen, 1986; Williamson, 1964). This empire building can lead to investing in project with negative NPV because of the objective of managers to pursue growth rather than to maximize the firm value. Murphy (1999) argues that running a large firm can provide the CEO more private benefits, and can lead to greater compensation and more prestige. Another factor that distorts the corporate investment and that creates the agency conflict is the short-termism, which states that managers are concerned with their reputation in the labor market which compel them to focus on the short-term performance rather than long-term performance and shareholder’s value (Narayanan, 1985). Due to these private incentives, managers may invest in projects that may not be sensitive to the opportunities. However, shareholders expect that managers should undertake those projects that are sensitive to opportunities and that have positive NPV. Various corporate governance mechanisms can resolve these conflicts. The board’s monitoring role is one of the mechanisms which can alleviate this conflict.
In modern era, corporate boards perform two important tasks. One is to monitor the activities of the managers in order to alleviate the agency problems. The second important task is to advice managers in important strategic decisions. Board is involved in both monitoring and advising activities. On one hand, it is involved in hiring, firing, and setting compensations for the top management. On the other hand, it makes important strategic decisions. For example, directors keep a close eye on investment project and attend the meetings to analyze and approve the proposed investment projects. They also use their expertise and advise top management to undertake an investment project. As board is involved in strategic decisions of the organization, we expect the diversity in board may affect these decisions.
Harrison and Klein (2007) defined team diversity as the distributional differences in the team members compared to common attribute. Prior literature suggest that team performance is both positively or negatively affected by diversity in the team members (e.g., Tsui & Gutek, 1999; Van Knippenberg et al., 2004). Diversity in the demographic attributes improves the performance of the team by providing a great pool of ideas and perspectives, as suggested by the cognitive resource perspective (Williams & O’Reilly, 1998). A team with greater diversity can improve the group performance by providing more knowledge and perspectives as compared to a homogeneous team.
Scholars have divided the diversity attributes into surface-level attributes and deep-level attributes (i.e., Harrison et al., 1998; Milliken & Martins, 1996). The surface-level attributes are composed of characteristics like gender, race, age, while the deep-level attributes consist of characteristics like education, tenure, and functional expertise, among others. Diversity literature recommends that surface-level and deep-level diversity attributes differently affect the team cohesiveness, as surface-level attributes reduce the group cohesion while deep-level attributes improve the group cohesion; however, the impact of surface-level attributes decreases with time and that of deep-level attributes increases (Harrison et al., 1998).
Pelled (1996) classify diversity attributes into those that are highly related to job, and those that are less related to job. Pelled argues that diversity attributes, such as age, gender, and race are less related to job; however, industry background, education, and expertise are highly job-related attributes. On the basis of this notion, those diversity attributes that are less related to job (i.e., gender and age) are considered to be less related to team performance; however, the highly job-related attributes (i.e., tenure and education) are positively related to team performance (Pelled, 1996). Following these classifications, we classify diversity attributes into surface-level (gender and age), and deep-level (tenure and education) diversity.
Surface-level diversity and corporate investment
As mentioned above, the board of directors are expected to perform two critical tasks. First, they are elected to oversee the management in order to reduce the agency conflicts. Second, they are expected to advise the management in critical strategic decisions. Corporate investment is a crucial decision that influences the firm value. If the investment decisions of management are not monitored or advised, they may prefer “empire building” (Jensen, 1986; Williamson, 1964). Due to this reason management may prefer to maximize the growth opportunities instead of maximizing the value for which they invest in projects with negative NPVs. To avoid these problems, the board participates in the investment decision making and give their expert opinions and approval on that. However, board work as a team which is composed of various members having diverse attributes (Webber & Donahue, 2001). A diverse board may have different opinions, perspectives, and information, which can affect the group decisions.
The social identity theory (Turner & Tajfel, 1986) states that individuals place themselves and others in a social category based on specific characteristics such as age, race, beliefs, skills, knowledge, or gender. People belonging to a social category perceive themselves as different from other categories, which results in fitting stereotypes of out-group members (Goldberg, 2005). As members of the in-group perceive that other members in the group have similar values and beliefs, they may openly share the ideas and maybe more cooperative (Harjoto et al., 2018).
The similarity-attraction model postulates that individuals are more appealed and attached to their similar social categories. This leads to out-group discrimination and in-group favoritism, which may obstruct the group decision process (Harjoto et al., 2018). Prior literature reported a negative influence of surface-level diversity attributes on team performance (i.e., Bell et al., 2011; Milliken & Martins, 1996; Riordan & Shore, 1997); however, some researchers document a positive effect of such diversity attributes on team performance (i.e., Hambrick et al., 1996; Watson et al., 1993).
Research on gender diversity suggests that females are more risk-averse, conservative, and less confident in investment decisions (Dwyer et al., 2002; Graham et al., 2002; Shin et al., 2019). We expect that a corporation with more gender diverse board may invest less because of the conservative and risk-averse nature of women on the board. Another vital element of surface-level diversity is the age of the directors. Kang et al. (2007) suggest that age of the directors has a significant impact on board choices. Murray (1989) claims that board members of equivalent ages have similar beliefs and are more aware with the organization’s culture; as a result, they can communicate more effectively and work toward the same objectives. Houle (1990) claims that if the division is efficient, age diversity might give more benefits to the company. He mentioned that older members may contribute their experience to the firm and help it through their external connections; middle-aged members can take on executive-level responsibilities, while younger members gain new skills and expand their knowledge. In comparison to youthful and inexperienced members, Gilpatrick (2000) claims that retired, senior, mature, and experienced individuals are favored to sit on the board. According to studies, persons in their senior years are more risk cautious (Best & Charness, 2015; Josef et al., 2016), and certain events in life such as retirement or marriage can affect a person’s attitude towards risk (Josef et al., 2016). Berger et al., 2014 argue that old age managers are risk-averse as they prefer to take lower risk. Moreover, Holmström (1999) argue that young managers who are more concerned about their career are risk-averse.
Based on these arguments, we expect that board with higher gender and age diversity may invest less due to the risk-averse attitude of women and aged directors on board. Therefore, we hypothesize,
Hypothesis 1a: Board gender diversity reduces the level of corporate investment.
Hypothesis 1b: Board age diversity reduces the level of corporate investment.
We further hypothesize that board surface-level diversity can adversely influence investment-Q sensitivity. As we mentioned, managers invest in projects that may not be sensitive to the growth opportunities, measured by Tobin’s Q. This leads to agency conflict between managers and shareholders (Jensen & Meckling, 1976), which can be reduced through proper monitoring of managers. The board of directors are expected to oversee the activities of managers and make decisions that are aligned with shareholders’ expectations and interests. As corporate boards work as a team and they have to come to one page when they have to make a decision. However, the members of the board have different attributes such as age and gender, which might result in a conflict between them. Studies suggest that the surface-level diversity attributes reduce the group cohesion and performance (Harrison et al., 1998; Milliken & Martins, 1996). Moreover, as we mentioned previously that both social identity theory and similarity-attraction paradigm suggest that surface-level diversity (gender and age) negatively affect the group cohesion and performance due to ingroup/outgroup biases. Therefore, we expect that when there is more surface-level diversity in the board, it will reduce the team cohesion, cooperation, coordination, and information sharing, which negatively affect the group performance (Milliken & Martins, 1996). Due to less cooperation, coordination, and information sharing, the board may not perform its role to oversee the investing activities of managers in a better way. This may allow managers to invest in projects that are not sensitive to investment opportunities, measured by Tobin’s Q. Therefore, we propose the following hypotheses:
Hypothesis 2a: Board gender diversity is negatively associated with the investment-Q sensitivity.
Hypothesis 2b: Board age diversity is negatively associated with the investment-Q sensitivity.
Hypothesis 2c: Board surface-level diversity (gender and age) is negatively associated with the investment-Q sensitivity.
Deep-level diversity and corporate investment
Members of the board have a variety of characteristics, such as tenure and education; we call such characteristics as deep-level diversity. Deep-level traits are associated with the individuals’ cognitive talents, knowledge, and skills. West and Dellana (2009) investigate how cognitive diversity affect the group decision making procedure. They reveal that cognitive diversity improves group decision-making. Webber and Donahue (2001) demonstrate that deep-level (e.g., tenure and education) diversity improves group performance.
Studies argue that deep-level diversity improves the board’s monitoring task. They argue that as directors spend more time on the firm, they collect management-specific and firm-specific knowledge and information, which improve their monitoring and advising role (e.g., Bonini et al., 2017; Celikyurt et al., 2012). Vafeas (2003) presented an expertise hypothesis and suggested that the director’s tenure leads to better industry and firm knowledge, which improve the board’s monitoring role. Bebchuk et al. (2002) suggest that new directors are less critical as compared to long-tenured directors. The expertise hypothesis suggests that the tenure is positively associated with the director’s performance, because directors’ having longer tenure have more knowledge and expertise and are more willing to criticize the CEO. Moreover, Kor and Sundaramurthy (2009) argue that tenure gives the director knowledge and expertise about the firm’s environment. Similarly, Li and Wahid (2018) suggest that boards having higher tenure diversity have better performance. Further, they argue that tenure-diverse board have better monitoring and are less likely to overcompensate.
One of the most important aspects of deep-level diversity is education level. Training and education, according to human capital, and resource dependence theories, make employees more knowledgeable and skilled, allowing them to achieve organizational goals. Simons et al. (1999) contend that educational diversity improves firm performance. Bertrand and Schoar (2003) suggest that the risk-taking propensity of directors increases with educational level. Sanders and Carpenter (1998) state that education background is a vital variable in corporate governance that affect the firm strategic decisions. Auh and Menguc (2006) argue that greater educational diversity leads to more skills and knowledge, which leads to more creative solutions to complex problems and better monitoring. Talke et al. (2010) argue that educational diversity leads to new ideas and innovations, brings more flexibility, and enhances information processing abilities.
From these arguments, we suggest that deep-level diversity (education and tenure) improves the monitoring role of the board. A board with better monitoring will discourage the managers to pursue their interest and empire building. Therefore, we expect that a board with greater deep-level diversity (i.e., education and tenure) will reduce the empire-building tendency and hence will reduce the investment level. Therefore, we developed the following hypothesis.
Hypothesis 3a: Education diversity is negatively associated with the level of corporate investment.
Hypothesis 3b: Tenure diversity is negatively associated with the level of corporate investment.
As the literature suggests that due to the agency problems, managers pursue their interest at the stake of shareholders’ interest (Jensen & Meckling, 1976). Stulz (1990) argues that in order to increases their perquisites, managers invest in projects with negative NPV instead of paying out the cash. When there is weak monitoring, managers will make decisions in order to take private benefits (Murphy, 1999). Furthermore, Bertrand and Mullainathan (2003) argue that when managers are separated from ownership, they will pursue their own interests instead of maximizing the shareholder’s value. However, in the presence of corporate governance mechanisms such as takeover risk, effective boards, and large shareholders, this moral hazard can be reduced.
A corporate board with higher deep-level diversity reduces this agency conflict due to its better monitoring. Literature suggests that deep-level diversity have a stronger effect on group cohesion, process, and performance (Pelled, 1996). Moreover, a board with higher deep-level diversity (i.e., tenure and education) uses its knowledge, skills, experience, and expertise to recommend the projects that have positive NPV. Therefore, we expect that deep-level diversity improves the sensitivity of investment to Q. Hence, we hypothesize:
Hypothesis 4a: Education diversity positively affects the investment-Q sensitivity.
Hypothesis 4b: Tenure diversity positively affects the investment-Q sensitivity.
Hypothesis 4c: Deep-level diversity positively affects the investment-Q sensitivity.
Research Design
Sample Selection and Data Sources
This study selects data of Chinese A-share firms listed on Shanghai stock exchange (SSE) and Shenzhen stock exchange (SZSE) over the period of 2003 to 2017. We got the data for all the variables from China Stock Market and Accounting Research (CSMAR) database. Year 2003 is selected as the starting year because of the availability of board diversity and corporate governance data on CSMAR from that year. Furthermore, the nature of ownership (i.e., private firms and state-owner firms) is precisely defined on CSMAR since 2003. Following previous studies (e.g., Jaslowitzer et al., 2018; Shroff, 2017), we exclude financial firms, such as banks, investment trusts, and insurance companies, from the sample because they have different accounting rules. To eradicate the effect of potential outliers, all continuous variables are winsorized by 1% at both tails. As our sample contains firms that are listed at different years, therefore our data is unbalanced panel. Our final sample consists of 3,488 firms with 30,994 yearly observations.
Variables Definitions and Measurements
Dependent variable
Corporate investment is the variable of interest in this study. Following previous studies, we use capital expenditures (CAPEX) as measure of corporate investment (i.e., Duchin et al., 2010; Jaslowitzer et al., 2018). We calculate CAPEX as the firm’s investment in fixed, intangible, and other long-term assets minus cash receipts from the sale of these assets, divided by beginning total assets. We also use total investment as a measure of corporate investment for robustness check, which is the sum of capital, R&D, and acquisition expenditures minus cash receipt from property, plant, and equipment divided by beginning total assets.
Independent variable
This study investigates how board diversity affect the investment decisions. Majority of previous studies used single diversity attribute to measure board diversity, such as gender. Following previous studies including Webber and Donahue (2001) and Harjoto et al. (2018), we use several diversity attributes and divide them into two categories, such as surface-level diversity and deep-level diversity. Those attributes which are highly related to job are named as deep-level diversity, such and tenure and education. However, those attributes that are less related to job are considered as surface-level diversity, such as gender and age. We used Blau (2000) model to calculate the diversity index, which is calculated using the formula below.

Where D denotes diversity index, P denotes the proportion of members in each group, and i denotes the number of entire categories. The diversity index has a value between 0 and 1. Perfect heterogeneity is represented by a value of 1, whereas perfect homogeneity is represented by a number of 0. As the number of categories grows, so does the diversity index. To calculate surface-level diversity (Surface_D), we sum gender diversity (Gender_D) and age diversity (Age_D), while to calculate deep-level diversity (Deep_D), we sum tenure diversity (Tenure_D) and education diversity (Edu_D). The following section explains how each diversity attribute is calculated.
Gender diversity (Gender_D)
It is measured by dividing gender into two categories, that are, male and female.
Age diversity (Age_D)
It is divided into five age groups: 40 and under, 41 to 49, 50 to 59, 60 to 69, and 70 and up.
Tenure diversity (Tenure_D)
It is divided into four categories: 3 years or less, 4 years, 5 years, and more than 5 years.
Education diversity (Edu_D)
It is divided into five categories: 1 (technical secondary school and lower), 2 (associate degree), 3 (bachelor’s degree), 4 (master’s degree), and 5 (doctoral degree).
Control variables
The Q theory of investment posits that investment is the sole function of investment opportunities measured by Q (Hayashi, 1982; Tobin, 1969). The theory states that firms invest when there are growth opportunities. Following the prior literature, we include growth opportunities measured by Tobin’s Q in the investment equation. However, Fazzari et al. (1988) argue that the internal funds availability also affects the investment as firms are financially constraint. Therefore, we include the cash flow from operating activities as control variable.
Leverage might have negative or positive impact of corporate investment. First, an increase in leverage might increase the bankruptcy risk due to which the investors may reduce their investment. Second, higher debt level might increase in the level of investment because of the access of the firm to external funds. Therefore, following prior studies we also control for leverage (i.e., Ahn et al., 2006).
Corporate cash holdings may also affect the investment decisions. Higher level of cash means there are more funds available to managers to invest in potential projects. Therefore, following previous studies, we control for cash holdings (i.e., Francis et al., 2013).
We also control for firm size in this study. In literature, several proxies are available to measure firm size, such as log of total assets, log of sales, and number of employees. Some researchers argue that size has negative influence on corporate investment (e.g., Bokpin & Onumah, 2009). The reason is that in the larger firms it becomes difficult for managers to manage all the human and financial resources, which may lead to less corporate investment. We take natural logarithm of total assets to measure firm size.
In this study we also control for firm’s age. Prior literature suggests that firm age has positive influence on firm growth (i.e., Cooley & Quadrini, 2001), hence affects the investment decisions. Following previous studies, we measure firm age as the number of years since the listing of the firm (Fama & French, 2001). Following McNichols and Stubben (2008), we also controlled for the assets’ growth of the beginning year. They argue that growth firm address the problem of mismeasurement of Tobin’s Q, and invest more independently of any misstatements. We also control for return on assets (ROA) following prior literature (i.e., Asker et al., 2015). Firm having higher ROA have the potential and are more likely to invest in capital assets. Therefore, we include beginning year ROA as control variable. Asset tangibility is another control variable in the study. Almeida and Campello (2007) argue that tangibility decreases the financial constraint and hence can affect the corporate investment. Therefore, we use the beginning year tangibility as a control variable. Following previous literature, we assume that investment is current year is influenced by previous investment; therefore, we also control for lagged investment (McNichols & Stubben,2008; Shroff, 2017). Finally, we also control for the industry and year effect by adding industry and year dummies.
Model Specifications
Tobin (1969) and Hayashi (1982) argue that the investment is a function of growth opportunities, which is measured by Tobin’s Q. However, after controlling for Tobin’s Q, Fazzari et al. (1988) argue that firms are financially constrained and the investment is sensitive to both Tobin’s Q and internal funds. This gave the standard investment model which is widely used in the investment literature. We also use this standard model which is as follows:

where
To formally test the hypotheses 1 and 3, we augment equation (1) and include the diversity and control variables. The augmented version of equation (1) is as follows:

where
We also attempt to find the influence of board diversity on the investment-Q sensitivity. Therefore, we add the interaction terms of surface-level diversity attributes (gender and age) and deep-level diversity attributes (education and tenure) with Tobin’s Q to equation (3). First, we add all four diversity attributes separately to the model. Next, to test the combined effect of surface-level and deep-level diversity, we add interaction of these two diversity facets with tobins Q to the model. After adding the interaction terms, we estimate the following equation:

where

Where
Empirical Results
Descriptive Statistics
Table 1 provides the description of the data through various summary statistics. The mean of the corporate investment (INV) is 0.066 having a standard deviation of 0.075, which is consistent with previous studies (i.e., Chen et al., 2011). The table also shows descriptive statistics of the various diversity attributes. It shows that the gender (Gender_D), age (Age_D), tenure (Tenure_D), and education diversity (Edu_D) have the mean value of 0.252, 0.598, 0.304, and 0.514, respectively. This suggests that the firms in our sample are more diverse in terms of age and education. The mean of Surface_D (sum of Gender_D and Age_D) is 0.85. However, the mean of Deep_D (sum of Tenure_D and Edu_D) is 0.818, which suggests that the firms in our sample are slightly more diverse in term of surface-level diversity. Furthermore, the table also provides summary statistics of the control variables. The Table provides maximum, minimum, and four percentiles (25th, 50th, 75th, and 95th) to have more detailed view of the data.
Summary Statistics.
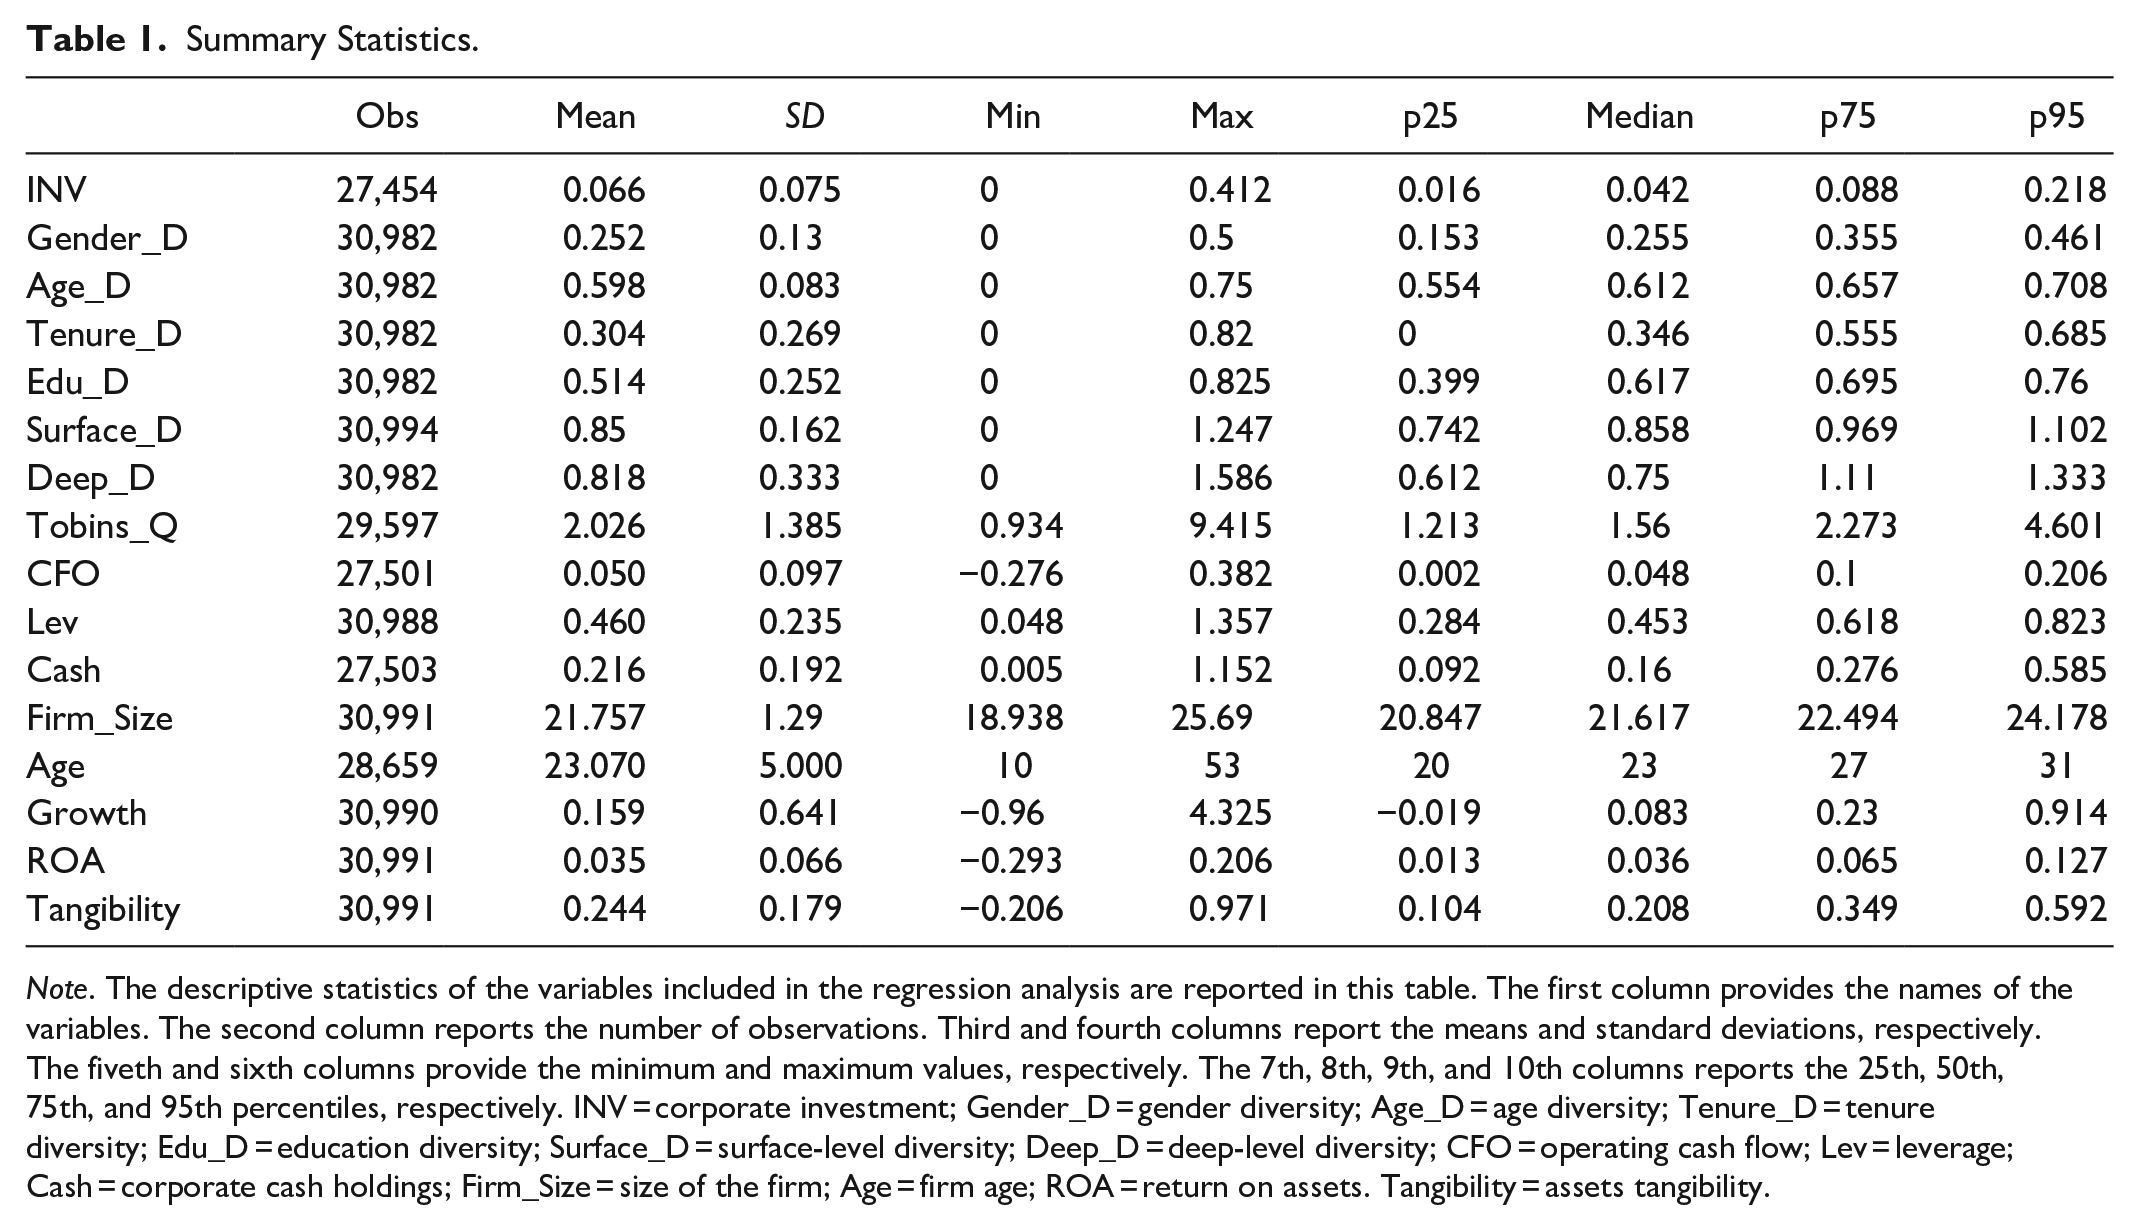
Note. The descriptive statistics of the variables included in the regression analysis are reported in this table. The first column provides the names of the variables. The second column reports the number of observations. Third and fourth columns report the means and standard deviations, respectively. The fiveth and sixth columns provide the minimum and maximum values, respectively. The 7th, 8th, 9th, and 10th columns reports the 25th, 50th, 75th, and 95th percentiles, respectively. INV = corporate investment; Gender_D = gender diversity; Age_D = age diversity; Tenure_D = tenure diversity; Edu_D = education diversity; Surface_D = surface-level diversity; Deep_D = deep-level diversity; CFO = operating cash flow; Lev = leverage; Cash = corporate cash holdings; Firm_Size = size of the firm; Age = firm age; ROA = return on assets. Tangibility = assets tangibility.
Correlation Analysis and Multicollinearity Diagnosis
Table 2 reports pairwise correlations between the dependent and explanatory variables. It shows that all the correlations coefficients are less than 0.8, which suggests that there is no issue of multicollinearity. Table 2 shows that Gender_D, Tenure_D, Surface_D, Tobins_Q, Lev, and Age are negatively correlated with INV, while Edu_D, Cash, Firm_Size, Growth, ROA, and Tangibility are positively associated with INV. The correlation between some of the explanatory variables is also significant but not too much high. For example, Age_D has positive and significant correlation with Gender_D, but is quite low. The correlation of Tenure_D, Tobins_Q, Cash, Age, Growth, and ROA is positive with Gender_D, while Edu_D, Firm_Size, and Tangibility has negative correlation with Gender_D. Tenure_D, Cash, Firm_Size, Age, ROA, and Tangibility have negative correlation with Age_D, while Edu_D is positively associated with Age_D. The correlation of Tobins_Q, Firm_Size, Age, and Growth is positive with Tenure_D, while that of Edu_D, Cash and Tangibility is negative. Cash, ROA, and Tangibility show positive correlation with Edu_D, while Tobins_Q, Firm_Size, Age, and Growth show negative association with it. Overall, Table 2 shows correlations among all the variables included in the study. Most of the correlations are significant but the coefficients are small, which confirm the absence of multicollinearity.
Pairwise Correlations.

Note. The pairwise correlations between the dependent and explanatory variables are reported in this table.
indicates sig at 5%.
Regression results
This section explains the empirical results of the formulated hypotheses regarding the relationship between board diversity and corporate investment. Following prior literature (i.e., Chen et al., 2017; Jaslowitzer et al., 2018) and Hausman test, we employ fixed effect regression. First, we investigate whether board diversity in terms of both surface-level and deep-level attributes affect the corporate investment level. Next, we investigate whether board diversity affects the sensitivity of investment to the growth opportunities.
Board diversity and corporate investment level
We investigate the influence of board diversity on the level of corporate investment. To find whether the board diversity increases or decreases the level of corporate investment, we employ fixed effect regression. The results of fixed effect regression are reported in Table 3. These results show that board gender diversity (Gender_D) reduces corporate investment. The coefficient of Gender_D is -0.021 and is significant and 1%. However, we do not find any significant impact of Age_D on investment level. Further, the board’s tenure diversity (Tenure_D) reduces the corporate investment level (INV). Tenure_D has a negative coefficient (−0.005) and is significant at 5%. Similarly, results show that education diversity (Edu_D) significantly reduces investment level. Tobin’s Q and operating cash flow (CFO) are the important elements of investment equations. The coefficient of Tobins_Q is 0.004 and is highly significant (at 1%). The coefficient of CFO is 0.024 and is also highly significant at 1%. These results are in line with prior studies (i.e., Almeida et al., 2010; Chen & Chen, 2012; Erickson & Whited, 2012). Table 3 also reports the results of other control variables included in the regression model. It shows that the coefficient of leverage (Lev) is negative and significant, but is economically very small. The coefficient of Cash is 0.037 and is significant at 1%. Results in Table 3 shows that firm size is negatively associated to investment level. The coefficient of Firm_Size is −0.015 and is highly significant. Firm age (Age) positively influence investment level as its coefficient is positive and highly significant. Assets growth (Growth) is negatively associated with investment level as its coefficient is negative and highly significant. ROA also shows positive association with investment level as its coefficient is positive and highly significant. The influence of assets tangibility (Tangibility) on investment level is negative as its coefficient is negative and highly significant. Finally, the prior period investment positively affects the current year investment as the coefficient of INVt-1 is positive and highly significant.
Board Diversity and Corporate Investment Level.

Note. Results of the fixed effect regression are provided in this table. The dependent variable is the investment level (INV). The first model is the basic investment model. The second model contains independent and control variables. Parenthesis includes standard errors. Gender_D = gender diversity; Age_D = age diversity; Tenure_D = tenure diversity; Edu_D = education diversity; Tobins_Q = Tobin’s Q; CFO = operating cash flow; Lev = leverage; Cash = corporate cash holdings; Firm_Size = size of the firm; Age = firm age; Growth = assets growth; ROA = return of assets; Tangibility = assets tangibility.
means sig at 1%, **means sig at 5%.
The findings suggest that board diversity including both surface-level and deep-level diversity (except Age_D) reduces the investment level. An 1 standard deviation increase in board Gender_D causes approximately 3.6% decrease in corporate investment level. Similarly, 1 standard increase in board’s Tenure_D causes an approximately 1.8% decrease in investment level. Furthermore, an one standard deviation rise in Edu_D causes approximately 2.6% decrease in investment level. Several reasons can be attributed to this negative relationship between board diversity and corporate investment level. Due to the separation of ownership and control of the firm, there is agency conflict between managers and shareholders. Managers focus on “empire building” pursue their interests and invest in projects that that do not have positive NPV (Jensen, 1986). Board diversity is one corporate governance mechanism that may reduce this agency problem and discourage the empire building. Moreover, from the perspective of resource dependence theory, a diverse board brings more resources, skills, knowledge, and expertise to the organization (Hillman et al., 2000), which creates more diverse ideas and opinions, and improve the corporate investment decisions. However, the reduction in the corporate investment level with increase in board diversity do not provide a clear picture of the improved investment decision. The negative relation between gender diversity and investment level may be due to the reason that women are more conservative and risk-averse (Dwyer et al., 2002; Graham et al., 2002; Shin et al., 2019), and invest less as compared to male (Faccio et al., 2016). Similarly, old-aged people are more risk-averse compared to young people (Best & Charness, 2015; Josef et al., 2016). Hence a diverse board in terms of gender, education, and tenure may reduce the corporate investment. However, shareholders want mangers to invest in projects with positive NPV. This imply that managers should invest in projects when there are growth opportunities. Therefore, we also investigate whether board diversity affects the sensitivity of investment to growth opportunities.
Board diversity and investment-Q sensitivity
In the preceding section, we investigate how investment level changes with board diversity. However, we are also interested in investigating the effect of board diversity on the sensitivity of investment to growth opportunities, which is measured by Tobin’s Q. Therefore, we included the interaction terms of board diversity attributes separately (e.g., Gender_D, Age_D, Tenure_D, and Edu_D) and combinedly (e.g., Surface_D and Deep_D) with Tobins_Q in the regression equations (3) and (4), respectively. Table 4 reports the results of the fixed effect regression model having the interaction terms of all four dimensions of board diversity with Tobins Q. The results indicate that gender diversity reduces the sensitivity of investment to growth opportunities. The coefficient of the interaction term of Gender_D with Tobin’s Q (Gender*Q) is negative (−0.006) and is significant (at 5%). Similarly, the results indicate the age diversity also negatively influence the sensitivity of investment to growth opportunity. The coefficient of interaction of Age_D with Tobin’s Q (Age*Q) is negative (−0.015) and is highly significant. However, tenure diversity (Tenure_D) increases the sensitivity of investment to growth opportunities. The interaction term of Tenure_D and Tobins_Q has positive coefficient (0.003) and is highly significant (at 1%). Similarly, Table 4 shows that education diversity positively moderates the investment Q relationship. The coefficient of Edu*Q is positive and is highly significant. Table 4 also presents the results of the control variables. It shows positive association between Tobins_Q and INV as the coefficient is positive (0.008) and highly significant. CFO also shows positive (0.023) and significant (at 1%) association with INV. Lev shows negative (−0.001) and significant association with INV. Cash is positively (0.036) and significantly (at 1%) related to INV. Firm_Size is negatively related to INV as its coefficient is negative (−0.020) and significant. The coefficient of Age is positive (0.157) and significant, which suggests that it is positively related to INV. Growth has negative association with INV as its coefficient is negative (−0.012) and is highly significant. The relationship between ROA and INV is positive (0.105) and significant. Tangibility has negative association with INV as the coefficient is negative (−0.063) and is highly significant. Finally, INV in the current period is positively associated with the INV in the previous period. The coefficient of INVt-1 is positive (0.294) and is highly significant (at 1%).
Board Diversity and Investment-Q Sensitivity.

Note. First model presents results of the standard investment model. Second model is the main regression model. Third model includes the interaction terms of all four dimensions of diversity with Tobin’s Q. Standard errors are in parenthesis.
p < .05. ***p < .01.
Similarly, we investigate the combined effect of surface-level diversity (sum of gender and age diversity) and deep-level diversity (sum of tenure and education diversity) on sensitivity of investment to growth opportunities. These results are reported in Table 5. The table shows that surface-level diversity negatively moderates investment-Q sensitivity. The coefficient of the interaction of Surface_D with Tobin’s Q (Surface*Q) is negative (−0.011) and is highly significant. Conversely, board deep-level diversity positively moderates the sensitivity of investment to growth opportunity. The coefficient of the interaction of Deep_D with Tobin’s Q (Deep*Q) is positive (0.003) which is significant at 1%.
Surface-Level and Deep-Level Diversity and Investment-Q Sensitivity.

Note. The fixed effect regression results are provided in this table. The first model is our standard investment model. Interaction of Surfac_D with Tobins_Q (Surface*Q), and Deep_D with Tobins_Q (Deep*Q) are added in the third model. Standard errors are in parenthesis. INV = corporate investment; Surface_D = surface-level diversity; Deep_D = deep-level diversity; Tobins_Q = Tobin’s Q; CFO = operating cash flow; Lev = leverage; Cash = corporate cash holdings; Firm_Size = size of the firm; Age = firm age; Growth = assets growth; ROA = return of assets; Tangibility = assets tangibility.
p < .1. **p < .05. ***p < .01.
The findings suggest that surface-level diversity (Surface_D) negatively affects the investment-Q sensitivity, which indicates that increase in Surface_D (gender and age) reduces the sensitivity of corporate investment to growth opportunities. This means that board’s surface-level diversity does not improve the monitoring role and the investment decisions. This can be explained through the lens of the social identity and similarity-attraction theories, which suggest that demographic diversity (i.e., gender, and age) leads to ingroup favoritism and outgroup discrimination, which negatively affect the team performance (Bell et al., 2011). Furthermore, this study finds that board deep-level diversity (Deep_D) positively affect the sensitivity of investment to growth opportunities. This suggests that deep-level diversity improve the monitoring of board in oversighting the investment decisions of the managers. These results are in line with Harjoto et al. (2018).
Robustness check
We employ several additional tests in order to confirm the robustness of the findings. First, following Richardson (2006) we use alternative proxy for corporate investment in Models 1, 2, and 3 of Table 6. Instead of capital expenditure, we use total investment as proxy for corporate investment. We calculate total investment as the sum of capital expenditure, R&D expenditure, and acquisition expenditures minus sales of property, plant, and equipment divided by the beginning year total assets (Richardson, 2006). Results of these models supports main findings and confirm the robustness of our results.
Robustness Tests.

Note. Results of various robustness tests are provided in this table. Models 1, 2, and 3 report results of the regressions having total investment (T_INV) as dependent variable. Models 4, 5, and 6 present results of GMM regression. Standard errors are in parenthesis.
p < .1. **p < .05. ***p < .01.
To deal with potential endogeneity caused by omitted variables, we employ Blundell and Bond (1998) system GMM. In the presence of endogeneity, system GMM produce more efficient and accurate estimators than OLS and fixed-effect, or difference GMM estimators (Wintoki et al., 2012). Results of the system GMM are provided in the 5th, 6th, and 7th columns of Table 6, which also confirms the robustness of our findings.
Reverse causality problem
The findings of the study suggest that board diversity reduces investment level. However, due to the potential endogeneity, there may be reverse causality. It is possible that firms with low investment levels may attract more diverse boards. Therefore, this issue of reverse causality needs to be addressed and it should be confirmed that our findings are not affected by reverse causality. Following Aggarwal et al. (2011), we use change and reverse change test to cope with this problem. It is expected that if board diversity (Surface_D and Deep_D) affect corporate investment, then we expect that increase (decrease) in board diversity should decrease (increase) corporate investment. Results of the change test are provided in Table 7. The dependent variable is change in investment (∆INVt), measured as change in INV over period t to t+1. Similarly, change in independent and control variables are measured. Results in Table 7 indicate that the coefficients of ∆Surface_Dt and ∆Deep_Dt are negative and significant, which support our main findings.
Change Test.
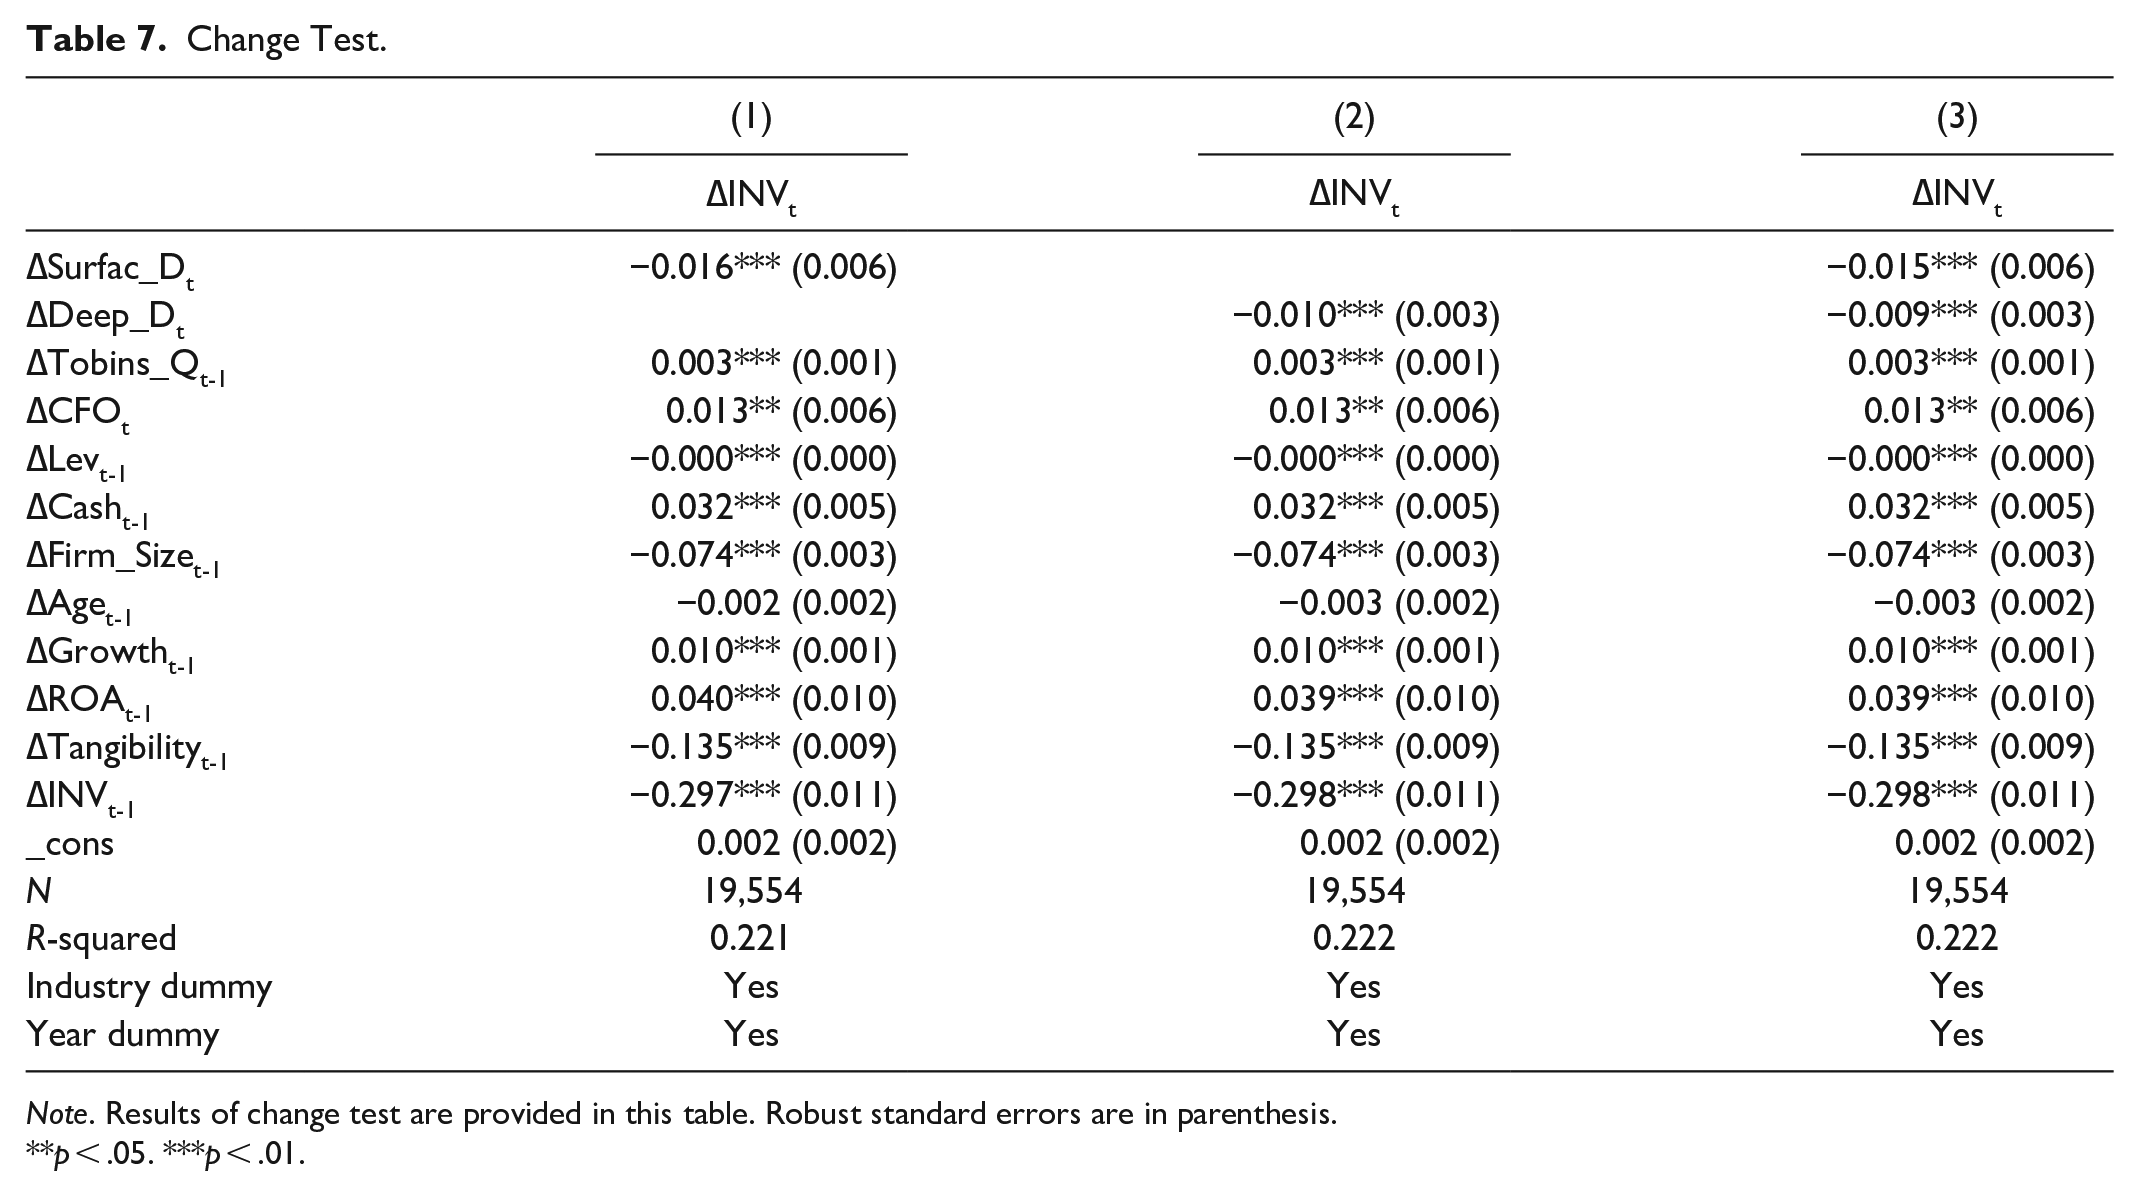
Note. Results of change test are provided in this table. Robust standard errors are in parenthesis.
p < .05. ***p < .01.
To check for the reverse causality, we estimate the equation in reverse direction. The dependent variable is change in diversity (∆Surface_Dt and ∆Deep_Dt), while the independent variable is now change in corporate investment (∆INVt). The results of the reverse change test are presented in Table 8, which indicate that the coefficient of (∆INVt) is insignificant in both equations. This suggest that board diversity affects the corporate investment but corporate investment do not influence the board diversity. Therefore, there no issue of reverse causality.
Reverse Change Test.

Note. Results of reverse change test are provided in this table. Robust standard errors are in parenthesis.
p < .05. ***p <. 01.
Additional control variables
Several control variables were included in our analysis. Other corporate governance variables, however, could have an impact on our findings. We have incorporated various corporate governance variables to address this challenge. We account for CEO duality (CEO_DUAL) which is calculated with a dummy having value of 1 if chairman and CEO are the same, and zero otherwise, institutional investors (INST) which is calculated as the percentage of shares held by institutional investors, board independence (BOARD_IND) which is calculated as the ratio of independent directors, and board size (B_Size ) which is measured as total number of directors on board. Results of the fixed-effect regression with additional control variables are reported in Table 9. These results are in line with our main findings, confirming the robustness of the results.
Additional Control Variables.

Note. Results of fixed effect regression having additional control variables are reported in this table. Standard errors are in parenthesis. INV = corporate investment; CEO_DUAL = CEO duality; B_Size = board size; BOARD_IND = board independence; INST = institutional investors.
p < .1. **p < .05. ***p < .01.
Conclusions
This study analyzes the effect of board diversity on corporate investment decisions. We categorize various diversity attributes into two dimensions of diversity, such as surface-level diversity and deep-level diversity. Using an unbalanced panel of Chinese non-financial firms, we find that surface-level diversity (gender and age) negatively affects the corporate decisions. This study suggests that board’s surface-level diversity weakens the monitoring role of the board to oversight the investment decisions. However, we find that deep-level diversity (tenure and education) improves the corporate investment decisions. A diverse board in terms of tenure and education uses its better monitoring, knowledge, skills and experience to oversight the investment decisions, which ultimately improves the corporate investment decisions.
This study has several policy implications. We observe that board’s surface-level diversity (gender and age) negatively affects the sensitivity of investment to growth opportunities. Firms having higher gender and age diversity should organize training and counseling programs to eliminate the in-group and out-group stereotypes. Furthermore, we observe that deep-level diversity (tenure and education) positively affects investment-Q sensitivity. These findings provide the evidence for the regulators to support more diversity. More specifically, we show that boards having higher tenure and education diversity perform better monitoring and better investment decisions. This study suggests the organizations to increase the diversity, especially the deep-level diversity which is highly job related. The purpose to increase the diversity is to have more diverse representation and to have a large pool of ideas, skills, knowledge, and expertise. The board and management should understand how different types of diversity affect the decision-making process and group performance. By understanding this, they can allocate the resources in better ways to cope with the conflicts and challenges that diversity creates, which will enable the organization to get benefits from diversity.
Limitations and future recommendations
This study has some limitations. This study considers four attributes of diversity as determinants of corporate investment decisions. However, there are other attributes that may also be considered, such as director’s ethnicity. Moreover, this study is conducted in a single country such as China. It can be extended by considering several countries in the panel.
We provide some recommendations for future research. Future studies can be conducted by investigating how the board’s surface-level and deep-level diversity affect financial constraints, which is an essential driver of investment decisions. Studies can also be conducted by investigating the influence of the board’s surface-level and deep-level diversity on corporate financing decisions. Finally, it is recommended to develop a diversity index by adding more diversity attributes, such as ethnicity, income, and geographical location, among others.
Footnotes
Declaration of Conflicting Interests
The author(s) declared no potential conflicts of interest with respect to the research, authorship, and/or publication of this article.
Funding
The author(s) received no financial support for the research, authorship, and/or publication of this article.