
Abstract
Mining problems and exploring rules are the key problems in the learning process, and also the difficulties in education big data. Therefore, taking learning behavior as the research objective, this study demonstrates the collaborative training method of multi view learning interaction process driven by big data, so as to realize the tendency preference diversion of learning behavior. Based on collaborative training method of learning behavior. Through adequate experiments, we get the suitable and valuable rules, constructs the directed topological relationship of tendency preference division, and mines the feasible improvement measures and intervention mechanism. Experiments and practices show that the potential topological relationship can effectively improve and enable learning, and improve the assessment results.
Keywords
Introduction
Online learning platform has become important learning mode (W. W. S. Lee & Yang, 2020; Romero & Ventura, 2020). With the innovation of online technology and data methods, online learning has been fully applied all over the world during COVID-19. Based on the different learning needs, different applicable interactive learning modes are formed, which is inseparable from the analysis and decision of massive data (Hung, 2020; Xia, 2020a).
Researchers have made clear the importance f learning behavior preference, and put forward the key problems(Jovanovi et al., 2021; D. Lee, 2021), which are mainly reflected in two key aspects: the first one is the support of education big data.
In general, we define the learning behavior as a set of many interactive learning activities, every interactive learning activity means the basic interactive means(Hsieh et al., 2020; Waheed et al., 2020). Online learning process in a certain period forms relatively complete learning behavior. Therefore, learning behavior mainly focuses on the continuous flow of interactive learning activities, that needs friendly collaborative training to form effective learner behavior (Xia, 2021a).
Related Work
Interactive learning activities are affected by many factors, and different learning behavior views are formed (Matas-Terrón et al., 2020; Xia & Qi, 2022). Collaborative training of interactive learning activities needs to consider multi views, it is not possible to judge whether learners have effective learning motivation according to their participation frequency (Mumford & Dikilitaş, 2020). However, the learning behavior is formed by continuous interactive learning activities, it will build different correlation rules with the assessment results. Interactive learning activities have potential factors associated with assessment results. With corresponding recommendation mechanism, the tendency preference diversion might enable active learning (Zhang & Lin, 2020). Learners can tag interactive learning activities.
The semi-supervised learning method is mainly based on the untagged data, which is usually divided into three branches: generative method, semi-supervised SVM, and graph semi-supervised learning.
Generative Method
This method designs analysis process based on generative model. It is usually assumed that all the data (tagged and untagged) are generated by the same potential and reasonable adaptive model. The untagged data can be linked with the learning objectives, EM (Expectation Maximum) algorithm is used to solve the maximum likelihood estimation and predict the tendency (Van Engelen & Hoos, 2020; Wawrzyk, 2020). It can achieve better performance when there are few tagged data. However, the potential problems must be accurate and highly consistent with the real data, otherwise the generalization performance will be reduced (Lu & Gong, 2021).
Semi-Supervised SVM
Semi-supervised support vector machine (S3VM) is a combination of support vector machine and semi-supervised mechanism (Han et al., 2020; He et al., 2020; Suzuki & Sato, 2020). When the untagged data samples are not considered, SVM is used to mine the maximum interval; when the untagged data samples are considered, the key problem of S3VM is to divide the tagged data samples into two hyperplanes, that is low-density area and high-density area, the final tag will be its prediction result. This is one effective method of binary classification. However, each pair of untagged data samples need to be assigned in the process of tag search. This process has a huge amount of computation, involves massive data analysis and optimization problems. Therefore, the key issue is to design an efficient optimization strategy.
Graph Semi-Supervised Learning
The learning behavior can be mapped to a graph structure. Each sample can correspond to a node. If there is a strong correlation between two samples, there is an edge between them, and the weight of the edge is the correlation between the nodes (Ansari et al., 2020). A data set corresponds to a graph, and a graph is usually represented as a matrix. This method is very clear in describing and analyzing learning behavior, and it is easy to explore learning behavior and calculate indicators. However, this method requires data storage overhead. In the process of transformation from data set to graph structure, only the training sample set is considered, it is difficult to judge the new data samples in the graph. When new data is added to the training samples, it is necessary to reconstruct the graph and redistribute the nodes, which will introduce additional prediction.
The three semi-supervised methods are based on single learner by using untagged training data, which is not suitable for multi view analysis of learning behavior. The analysis process needs multiple learners and relative independence (i.e., divergence) based on full untagged data.
Multi View Data
In this study, one learning behavior data set is selected to analyze multi view collaborative training. The data set is from the learning behavior records of an open university. his data set is desensitized, which realizes the complete disclosure of data. At the same time, the amount of data is huge, which might be used to comparative study of similar topics. The same learning content in different learning periods produces similar learning views, the learning behavior is classified by algorithm. The data classification process is described as Algorithm 1.

The whole data set is divided into seven categories, and each category corresponds to one subset with different scale and items. The mining and analysis results of the homogeneous items and heterogeneous items are drawn into a graph structure, as shown in Figure 1. There are seven subgraphs, corresponding to seven kinds of learning content. The number on the arc represents the number of different learning interaction paths. The red unit represents the common interactive learning activities contained in different paths. “assessment” is an evaluation method of learning process, “final_result” is regarded as the test objective of interactive learning activities. According to the distribution of interactive learning activities in different learning contents, it includes six types:
(1) C1. It involves two learning periods, forms two paths of interactive learning activities, “content” and “resource” produce the process intersection. It can be seen from Figure 1 that C1 has less interactive learning activities and fewer attributes.
(2) C2. It involves four learning periods, it can be seen from the subgraph, the second and third learning period, a interactive learning sequence is formed, three paths with more interactive learning activities are produced.
(3) C3 and C4. The interactive learning activities are similar, both involve the third and fourth learning periods, and the same content forms an path in these two learning periods respectively.
(4) C5. There are four learning periods, the second, third, and fourth learning period form a path. There are two special interactive learning activities in the first learning period, C5 forms two tendency sequences. Compared with the other three learning periods, the first learning period has significant period differences.
(5) C6. Its learning process is similar to C3 and C4, the three learning periods form one path of learning interactive activities, that is, all the learners form the approximate learning behavior. At the same time, the interactive learning activities are more numerous than C3 and C4, and the participation in the learning process is more extensive.
(6) C7. C7 has the most interactive learning activities, and the intersection of different learning periods forms a complex cooperation of multiple relationships. For example, the heterogeneous items in the second, third, and fourth learning period are related to each other, but there are obvious differences. Finally, four paths are formed. There are 12 kinds of the homogeneous items, the collaborative relationship will be more complex. As can be seen from Figure 1, the sequence of interactive learning activities in the first period is relatively simple.
The learning behavior through online learning platform has strong autonomy, and has certain groupness. At the same time, the learning process is affected by learner, learning content, teacher, learning period, and so on, resulting in different complex paths.

Sequences of interactive learning activities in data sets.
Optimized Collaborative Training
According to the distribution of interactive learning activities in Figure 1, different learning views will be generated based on different paths. Therefore, this study designs collaborative training algorithms .
The homogeneous items of learning interactive activities makes the learning view “compatible,” and “final_result” is viewed as the output target of collaborative training (Fornes-Romero et al., 2020). The interactive learning activities of the seven subgraphs in Figure 1 satisfy the compatibility. Supposing one interactive learning activity sequence is
Collaborative training is a learning method based on divergence. it is necessary to assume that the data has two sufficient and conditional independence views. “Sufficient” means that each view contains enough information; “conditional independence” refers to the independence of two graphs, when satisfying sufficient and conditional independence, the views realize compatible complementarity (Suzuki & Sato, 2020). In data training, the untagged data is as follows: firstly, a classifier is trained on each view based on the tagged data samples, and then each classifier selects the most valuable untagged data to evaluate the expected tag, and provides the expected tagged sample to another classifier. This process is iterated many times until the two classifiers do not change or reach the preset number of iterations.
The collaborative training process of interactive learning activities is not very complex. If the two views are sufficient, and satisfy conditional independence, according to the needs of data analysis, the generalization performance of weak classifier can be greatly improved by using untagged samples through collaborative training. However, the inherent relevance of interactive learning activities makes the conditional independence. A large number of experiments show that the collaborative training can ensure that the conditional independence is very weak, and still can effectively improve the generalization performance of weak classifiers.
The data analysis of collaborative training is described as Algorithm L-CT.

The classification confidence of collaborative training depends on the base learning algorithm ξ. If naive Bayes classifier is used, posterior probability can be transformed into classification confidence; if SVM is used, interval size can be transformed into classification confidence. Since L-CT algorithm is based on the multiple learners with significant divergence and moderate performance, the key step of analyzing interactive learning activities is to increase the pseudo tagged sample size through multiple iterations, so as to reduce the influence of model hypothesis and data set on collaborative training.
Experimental Process
In order to test the collaborative training effect of L-CT, three algorithms are selected, Semi-Supervised Support Generative Methods(S3GM), semi supervised support vector machine(S3VM), and semi-supervised support graph learning(S3GL). According to the collaborative training results of each data subset, two views of interactive learning activities are selected, and the Mean Classification Accuracy (MCA) is recorded and calculated as the performance indicator.
The seven subgraphs of interactive learning activities in Figure 1 are used as the data sets. L-CT and three comparison algorithms are respectively used in seven datasets with 10 fold cross validation. The experiments are repeated for 300 times, and then MCA is obtained. On the basis of subset standardization, the subset is randomly divided into two parts according to the ratio of 7:3, which are used as training set and testing set. At the same time, 1/10, 2/10, 3/10, 4/10, and 5/10 samples are randomly selected from the training set, and the rest are untagged samples. Table 1 shows the relevant description indicators of seven data subsets.
Indicators of Data Subsets.

According to the empirical rules of relevant references, the intercept is set as
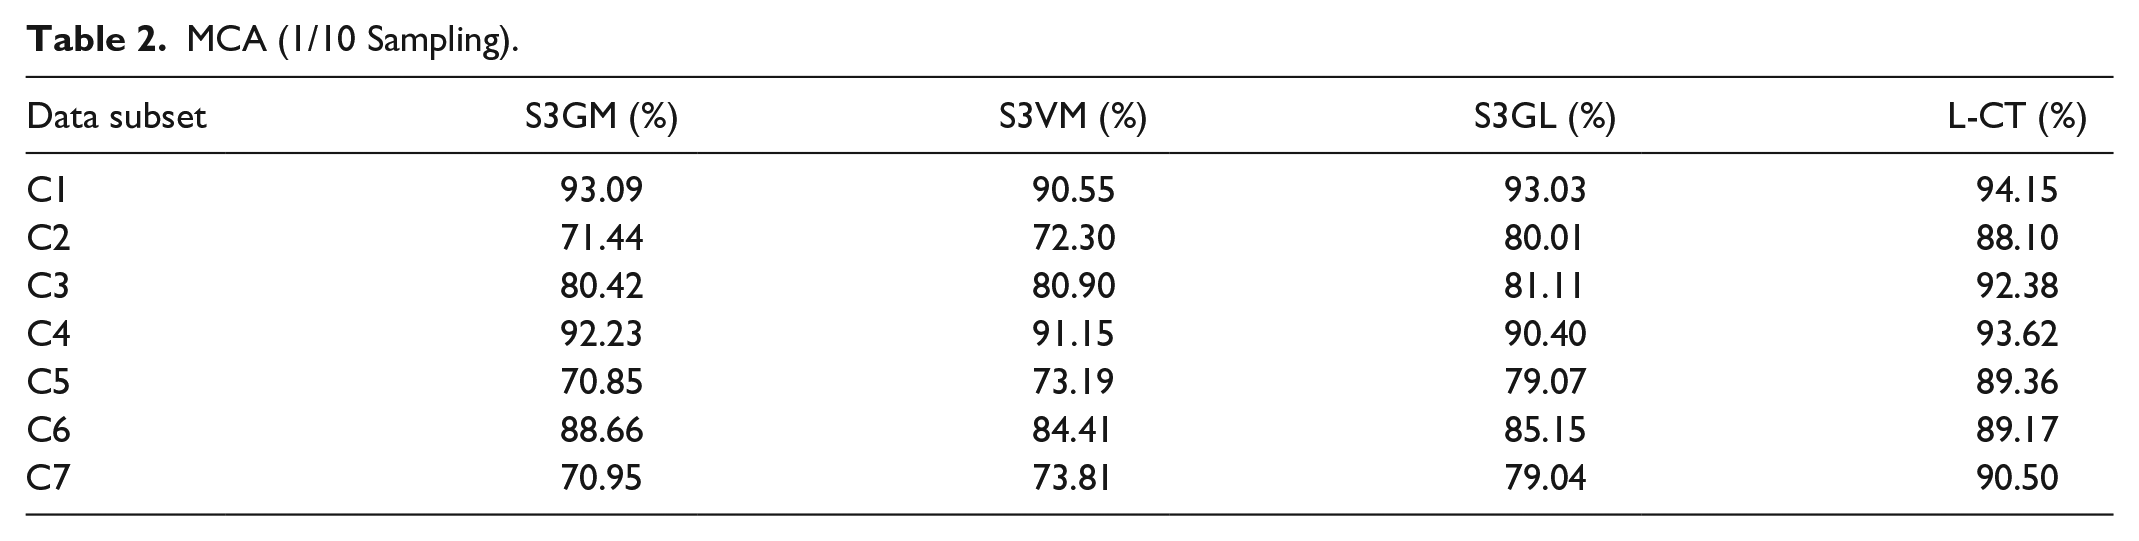
Two learning views of seven data sets are taken as the test objectives. When the proportion of tagged samples is 1/10, MCA of the four algorithms is tested. The MCA is shown in Table 2. It can be seen that L-CT has advantages in the collaborative training of seven data sets, and the MCA range of C2, C3, C5, and C7 is greater. The collaborative training process of multiple learners can maximize the consistency and global optimization of untagged samples, and determine the learner that can get the optimal classification. The semi-supervised learning of multiple learners can evaluate the learning process through multiple iterations. Compared with the single learner algorithm, it might improve the accuracy of multi view data analysis.
MCA (1/10 Sampling).
In the process of semi-supervised learning, the selection ratio of tagged samples will also affect the classification, which makes MCA change greatly. In the process of experiment, it is necessary to fully verify and compare different proportions of tagged samples. On the basis of Table 1, MCA is statistically analyzed, and the corresponding data scatter diagram was drawn, as shown in Figure 2. With the increase of the proportion of tagged samples, MCA will gradually increase. In the process of semi-supervised learning, the more sample size of iterative analysis is, the more accurate the training results of the learners are. With the help of multiple iterations, the best learner that can independently differentiate the samples is finally determined.

Different tagged sample ratio on MCA.
In Figure 2, the quadratic polynomial trend line of L-CT is added respectively. From the shape and trend, we can see that MCA trained by L-CT are more stable, the algorithm is reliable and robust. For C1 to C4, five sampling ratios make the interval of MCA larger; for C5 to C7, the MCA difference is larger when the sampling proportion is 10%, and the difference becomes smaller with the increase of sampling proportion. In other words, the increase of sampling ratio might improve MCA. The MCA of L-CT is the most stable for the sampling of different proportions of data sets, which can better ensure the high quality of data analysis. The collaborative training is effective, and the data training results and prediction have a strong reference value.
Experimental Results
Combining with the results of data analysis, the relationship is demonstrated from the perspective of the tendency preference. The specific method is as follows: the relative global optimal activity scheduling sequence is recorded, and the correlation weight between the activity sequences is calculated. Based on the overall behavior topology of the learning content, the implicit potential learners’ tendency preference is obtained, which is an important reference for constructing the basic learning behavior.
In order to better display the experimental analysis results of learning behavior, this study has visualized the processing, and the process is as follows:

Through the iterative analysis and data processing of Step 1-Step 6, the visualization results of seven data sets are obtained, as shown in Figures 4 to 10. The maximum intensity correlation description of all interactive learning activities is realized. The direct topological relationship between interactive learning activities is represented as a directed arc. The gray arc represents the loose relationship. From the topological structure of the seven graphs, the behavior process of different subsets produces the structure with different topological complexity. The relationship in Figure 4 is the simplest and that of Figure 10 is the densest. About the mapping between learning behavior and “assessment” or “final_result,” the seven graphs are different. The characteristics of visualization results are described as follows:
(1) Tendency preference diversion of C1. As shown in Figure 3, there are less interactive learning activities in the whole diversion topology, and the intensity correlation is mainly realized around “forumng” and “content.” The correlation strength of “url” is the weakest, and less participation is generated through “resource.” and gradually strengthen learners’ tendency to participate in the learning process.
(2) Tendency preference diversion of C2. As shown in Figure 4,interactive learning activities are much richer than C1. Activities that reflect learners’ strong interaction, such as “questionnaire,” “forumng,” and “collaborate.” In the whole topological sequence, “forumng,” “homepage,” and “content” are more likely to initiate other interactive learning activities. “Quiz” has become a major topology tendency, that drives the active participation of other activities.
(3) Tendency preference diversion of C3. As shown in Figure 5, “collaborative” has weak relevance with other activities. In the topological relationship of behavior process, “quiz” compared with C2 does not lead to the participation of interactive learning activities, on the contrary, it increases the possibility of using “subpage” as a tendency activity, “forumng” and “homepage” play an important role.
(4) Tendency preference diversion of C4. As shown in Figure 6, it is relatively simple to analyze the structure of interactive learning activities. The intensity relationship between activities is relatively small. Similar to C3, “homepage” plays an important role to realize the correlation of other interactive learning activities. There are few interactive activities. “Quiz” does not stimulate the participation frequency of other activities.
(5) Tendency preference diversion of C5. As shown in Figure 7, although “forumng,” “homepage,” and other interactive learning activities are still dominant compared with Figures 3 to 6, C5 increases the intensity and frequency of new interactive learning activities. The relationship between nine interactive learning activities is more complex and frequent, and the frequency of interactive interactive learning activities is larger. There are activities such as “externalquiz” that actively stimulate other activities.
(6) Tendency preference diversion of C6. As shown in Figure 8, the constituent activities and relationships of the whole behavior process are similar to C5, but the interactive learning activities do not form a strong correlation with others. For example, “collaborative” and “wiki” have the characteristics of both initiative and orientation. “Subapge” is one oriented activity, the personalized learning interactive activities are associated with the behavior process. In terms of individual activities, the tendency preference of C6 is significantly different from C5.
(7) Tendency preference diversion of C7. As shown in 9, the tendency preference diversion of C7 is the most complex, involving 18 interactive learning activities. Moreover, nearly all of these activities have established a tendentious correlation, which is directly related to the high frequency. The data training of C7 is the most complex in terms of data completeness and extensiveness. It can provide more tendency preference guidance for interactive learning activities.
About “assessment” and “final_result,” the correlation of the tendency preference diversion constructs strong weight, and is divided into two types: in Figures 3 to 6, TMA (Teacher Major Assessment) and learning behavior realize strong mapping relationship; in Figures 7 to 9, CMA (Computer Major Assessment) and TMA realizes strong relationships. The topological structure with appropriate assessment means might drive the learners to pass the assessment, and realizing the benign tendency of learning behavior and preference diversion. According to the analysis results of “assessment,” the seven visualization graphs can be divided into two series. In fact, Figures 3 to 6 correspond to the theoretical learning contents, and Figures 7 to 9 are engineering learning contents, which are consistent with the modeling of tendency preference division. Through the collaborative training, the learning content tends to be differentiated, and the accuracy is relatively high. In addition, the interactive learning activities in Figures 3 to 9 do not form a maximum complete graph, that is, not any two activities have a direct relationship, but with the help of third-party activities, the potential direct relationship can be realized.

Tendency preference diversion of C1.

Tendency preference diversion of C2.

Tendency preference diversion of C3.

Tendency preference diversion of C4.

Tendency preference diversion of C5.

Tendency preference diversion of C6.

Tendency preference diversion of C7.

Participation curve of interactive learning activities of DM.
The Empirical Study of Tendency Preference Diversion
According to the results of the experiment, the tendency preference is influenced by the learning content. The tendency preference diversion of similar learning content (theoretical or Engineering) has coincidence, and similar learning content may produce different activities and relationships (Fayoumi & Hajjar, 2020; Khan et al., 2020). Through the collaborative training of learning behaviors, the learning behavior has group tendency. It has a powerful data-driven significance to guide and construct relatively effective learning behaviors in a short time (Xia, 2021b).
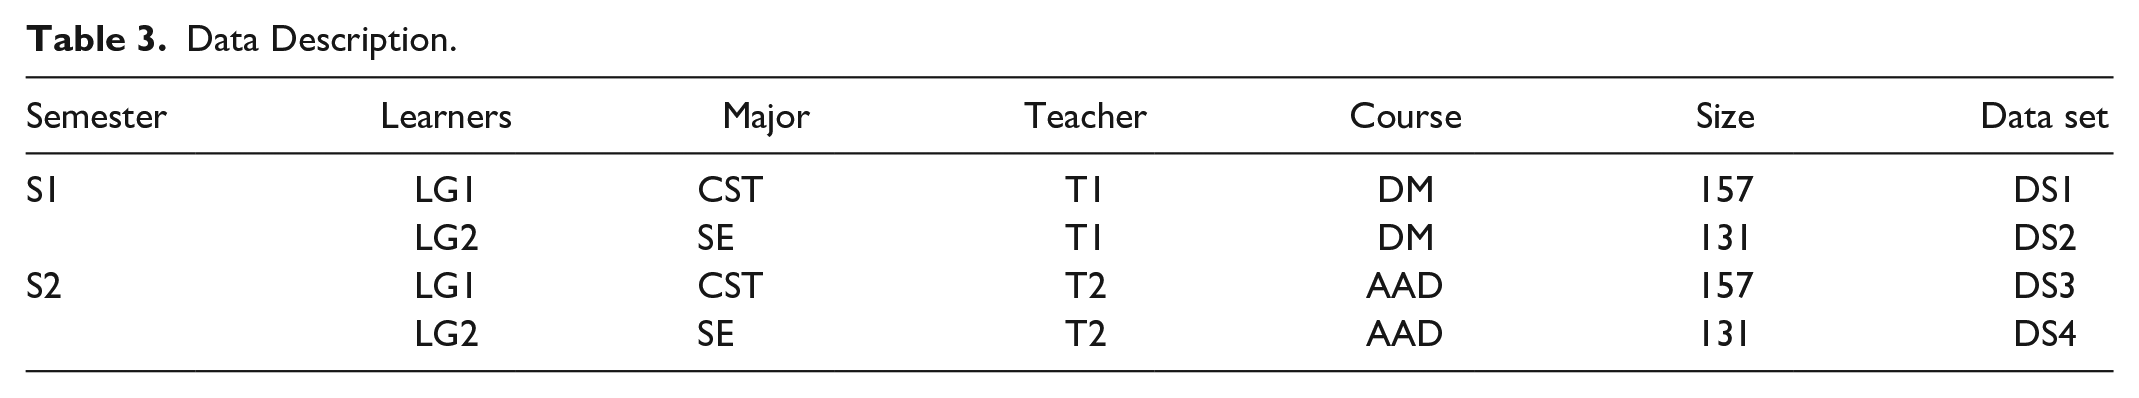
The results of C2 and C7 are the most complex topological relationships in the collaborative training of tendency preference diversion. We construct the appropriate guidance mechanism according to the course content. Two corresponding testing courses were selected: Discrete Mathematics (DM) and Algorithm Analysis and Design (AAD). The relevant major data of computer science and Technology (CST) and software engineering (SE), two different periods (S1, S2), two learner groups (LG1, LG2), and two different teachers (T1, T2) are collected in one university, the learner group is the data classification condition, a total of four data sets are formed, and the data scale is similar, as shown in Table 3.
Data Description.
According to the tendency preference diversion in Figure 5, the teacher of DM constructs two learning discussion groups, and customize the functions of the groups. Four kinds of online learning interactive activities, “forumng,” “content,” “questionnaire,” and “quiz” are designed. The teaching mode is mainly designed by teacher, and the assessment is TMA. According to the tendency preference diversion in Figure 10, the teacher of AAD designs the learning method driven by the course projects, and used the flipped classroom to introduce the classic online teaching video, which increases the learners’ participation. In addition to “forumng,” “content,” “questionnaire,” and “quiz,” there are also auxiliary interactive learning activities related to the projects, such as “dataplus,” “dualpane,” “htmlactivity,” etc. The assessment is divided into two parts: CMA and TMA. The comprehensive assessment of course projects is CMA, TMA evaluates the key knowledge of the course. At the same time, in the teaching process of the two courses, “questionnaire” and “quiz” are set up, respectively.
After a complete learning period, the data of interactive learning activities of the two courses are obtained, and the course assessment is completed. Score ≥60 means that learners pass the assessment, the data proportion of learners passing the assessment is obtained through statistical analysis, as shown in Table 4. It can be seen that the distribution proportion of DS1 and DS2, DS3 and DS4 in different score ranges is similar. On the whole, the learning process of the two courses drives the better learning effect. But in the same course, there are differences in the distribution of local ranges. AAD is significantly higher than DM in terms of pass rate and excellent rate. Of course, the multi-dimensional assessment method depends on the course content, but the course projects can significantly improve the participation, it inspires learning tendency preference.
The Results of Learners Passing the Assessment.

We take Participation as the observation variable and follow the frequency of statistics once a week, involving a total of 19 weeks, and each week is set as an independent variable.
About DM, the teacher mainly focuses on the first 18 weeks, the 19th week is the ending stage of course learning, and take a quiz every three weeks. Taking the learners who have passed the assessment as samples, the change curve of of participating interactive learning activities is drawn,as shown in Figure 10. we can draw the following conclusions: (1) the change curve of interactive learning activities is approximate; (2) the participation of learners major in SE is significantly higher than CST, that is, the learners of engineering majors have a stronger sense of interaction and cooperation; (3) in the 19th week, the participation of interactive learning activities will be greatly improved, the participation degree of “quiz” is obviously significant, which realizes the tendency preference under the guidance of “quiz”; (4) the participation of interactive learning activities is affected by the periodic quiz, and the participation of other interactive learning activities forms peak obviously in the quiz week, learners’ participation is relatively passive.
About AAD, the teaching process realizes the combination of course learning and project training, with one project per week. Taking the learners who have passed the course as the sample, the change curve of interactive learning activities is drawn, as shown in Figure 11. We can draw the following conclusions: (1) each interactive learning activity is on the rise with the increase of time; (2) the time can be divided into four stages: 1 to 6, 6 to 10, 10 to 16, and 17 to 19 weeks. The curve of the first and third week is approximately stable, and the second and forth week are in the rising, according to the different interactive learning activities, there are related rising or stationary states. This is directly related to the difficulty, comprehension, and knowledge of the project; (3) no matter which major, “htmlactivity” forms a greater participation; (4) the interactive learning activities are more involved in Figure 11, and the participation of interactive learning activities is no longer driven by “quiz” on the whole, course projects play an important role; (5) the participation of SE learners is higher than that of CST.

Participation curve of interactive learning activities of AAD.
Projects might stimulate learners to participate in interactive learning activities, which makes all activities related to projects have been fully participated. Based on the needs of learners’ projects, the correlation tendency preference between activities is realized. This learning preference will be transformed into learning habits gradually.
Conclusion
Since education big data has become the foundation of future education development and intelligent education reform, multi-dimensional data analysis has been needed from theory to practice, from model to process (Corral et al., 2021). However, to accurately integrate education big data into education process and decision, we need to mine the fundamental problems from the data to improve the learning process.
At the same time, education big data is different from other commerce big data (Xia, 2020b). An important research object is learner, which determines the dynamic and uncertainty of data. The model optimization and algorithm design realize continuous learning behavior modeling and relationship analysis.
Compliance With Ethical Standards
The authors certify that there is no conflict of interest with any individual/organization for the present work.
Footnotes
Acknowledgements
Thanks for the technical support provided by the laboratory of School of Software of Tsinghua University, the faculty of education of Shandong Normal University, as well as the theoretical guidance and practical reference provided by Qufu Normal University.
Declaration of Conflicting Interests
The author declared no potential conflicts of interest with respect to the research, authorship, and/or publication of this article.
Funding
The author disclosed receipt of the following financial support for the research, authorship, and/or publication of this article: This study is supported by National Office for Philosophy and Social Sciences “Research on the integration and classification of moral education documents in modern China”(Grant No. BEA190107).