
Abstract
The Indian retail industry is witnessing transformation from unorganized to an organized one. The changing and vibrant retail industry poses significant challenges to the retailers to withstand in the competition and to have their business organized. This research work provides an insight over the organized supermarket store image factors and its impact on shoppers’ perspective. This research work connects the store image attributes dimension and its impact on shoppers’ attitude to predict their in-store behavior in retail context. The researcher attempts to create a model by relating the mentioned variables through an extensive literature review. The model has been tested empirically. Confirmatory factor analysis (CFA) and Path analysis confirms that the store attributes dimension impacts shoppers’ attitude which in turn determines the perceived value. Further it confirms that perceived value determines the purchase intention among shoppers in a supermarket outlet.
Introduction
The Indian retail industry is experiencing a drastic fundamental change because of the changing Indian consumer behavior (Goswami & Mishra, 2009). The emergence of new retail formats and the rapid transformation of unorganized retailers into organized retail outlet shows twice the growth for modern retailing in India (IBEF, 2018) which significantly influences and changes the Indian shopper attitude and their in-store behavior. The Indian food and grocery industry ($380 billion worth) is ruled by kirana shops with the market share of 98% and the rest are covered by supermarkets (IBEF, 2018). Kirana shops are mostly small in size located closely to the residential area (street corners) runs in a space of less than 500 sq.ft (Dilsher, 2018). They tend to sell varieties of local products in a limited space, operated by the owner itself. As they are closely located, their market is less but have a close relationship with their customers knowing what products and services are needed by them. At present the transformation is seen among the Indian consumers preferring to the shops in the supermarkets because of their changing attitude which are fueled by a variety of store attributes offered by organized supermarkets and for kirana shops it is limited (Goswami and Mishra (2009). It is predicted that the growth of supermarket players will be doubled before 2020 (USDA 2018) because of its acceptance by the Indian consumers toward new retail formats especially in Tier II and III cities.
In total, there are 8,500 supermarkets in India as on 2016 which shows drastic growth when comparing with the year 2006 which stood at 500 (IBEF, 2018). There is a lot of space for the supermarket players to enter Tier II markets by establishing their business in an organized format (IBEF, 2018; USDA 2018). This study would help the existing supermarkets to know what are the attributes which attract shoppers to create competitive advantages and for the new supermarket business starters on the attributes to be focused. This study takes a broader perspective in terms of store image dimensions and its impact.
In today’s scenario, the Indian retailing industry is dynamic, facing a stiff competition and the retailers are adopting various methods to attract shoppers and require their stores to be distinct. One such method is the store image which is based on store attributes. The customers have various choices to select a store for shopping which is mostly based upon their attitudes over various store attributes in store environment which forms an image in their minds (Martineau, 1958). Store image concept was first proposed by (Martineau, 1958) “the way in which store is defined in the minds of customers.” His definition conquered a large number of research work in store image–related aspects on identifying the store attributes and its dimensions on shoppers perspective to enhance the store environment (Saraswat et al., 2010; Barich & Srinivasan, 1993; Hopkins & Alford, 2001; Paulins & Geistfeld, 2003; Sanjeev Tripathi, 2016). The evaluation of the store for the shoppers is based on the store attributes in the store environment which provides an overall store image which is cognitive in nature and for store choices (Kumar & Kim, 2014; Sinha & Banerjee 2004; Thang & Tan, 2003).
The shoppers behavior is based on their attitude which is fueled by the store environment attributes which can be tangible or intangible by nature (Barich & Srinivasan, 1993; Dirk, 2007). Larger number of research work has contributed on store image formation study with reference to store attributes (P. Ghosh, 2009) and short fall is seen on the impact of store image over shoppers behavior through conative. This article focuses on identifying effective store image attributes and dimensions over store image formation and its impact on shoppers behavior relating to their attitude. The outcome of the study will be helpful for the retailers to manage their retail outlet with limited store attributes components and expect a favorable behavior among shoppers.
The research work starts with an insight that the store attributes dimensions perceived by the Indian shoppers is unique and different in their attitudes in perceiving image components. A model was created to identify the relationship between the taken variables and to address the following objectives:
To identify the effective store image attributes and its dimensions that affect Indian shoppers’ attitude in selecting supermarkets.
To identify the role of shoppers’ attitude in the development of store image attributes, perceived value, and purchase intention.
To identify the relationship between store attributes dimensions, customer attitude, perceived value, and purchase intention.
Store Image Dimensions
Ambience and entertainment
Store ambience is related to the store environment design which includes physical characteristics. It provides an overall visual experience and creates an image about the store to the shoppers. Past research evidences that ambience distinct stores and shoppers do look on the in-store attributes while doing shopping. (Francioni et al., 2018). To enhance the shopping experience, the ambience and factor play pivotal role (Jinfeng & Zhilong, 2009; Sinha & Banerjee, 2004). Some of the components are while purchasing, proper lighting in the store directly creates attraction over the products and shoppers have possibility to do purchase. Appealing, decoration, music playing, and proper temperature maintenance in the store environment will provide pleasant ambience and good shopping experience (Bielen & Demoulin, 2007; P. Ghosh, 2009; Mattila & Wirtz, 2001) which create distinct retailers in the minds of shoppers (Sweeney & Wyber, 2002). Beyond internal, the external outlook of the shop attracts (Ward et al., 1992) like parking facility (Chen & Hu, 2010) determines how long the shoppers will be in store (Wakefield & Baker, 1998; Wang & Ha, 2011). Entertainment in the store environment is what shoppers look for additionally which in turn leads them to spend a longer time in the outlet (Babin & Attaway, 2000; Sinha & Banerjee, 2004). Therefore, the ambience and the entertainment factor are important for the store and are likely to influence the shoppers’ attitude.
Staff
Many studies pointed out the importance of staff in store environment. Shoppers experience services which may differentiate store by store psychologically (Jinfeng & Zhilong, 2009). The friendliness and politeness what the store employees show to the shoppers get to engage with them closely (Saraswat et al., 2010). Sales person’s knowledge over the merchandise significantly contributes for attracting shoppers on selection of products (Yoo et al., 1998). One of the important features under decision-making for selection of a store is based on the services provided for the shoppers by the retailers which are literally related with the employees (P. Ghosh, 2009). The shoppers’ perception toward employees is also based on the number of employees in store. Sufficient number of sales person in a store is considerably important (Paulins & Geistfeld, 2003). Staffs are considered to be one of the important store image dimensions which influences the shoppers’ attitude.
Merchandise
Merchandise mix is the focal point of every shoppers to select retail outlet for shopping (Carpenter & Moore, 2006; DelVecchio, 2001) which consists of variety, availability, and uniqueness (Thang & Tan, 2003). The shoppers at large look for quality of the merchandise which is related to the value for the money they are going to sell (Erdem et al., 1999; Hu & Jasper, 2006; Verma & Gupta, 2004). On extension to this visual display of merchandising (Park et al., 1989), fashionable (Shim & Kotsiopulos, 1992), and branded products (Porter & Claycomb, 1997) contribute under merchandise selection.
Convenience
Convenience is what shoppers’ look for while selecting retail outlets which are a crucial factor (Koksal, 2007; Thang & Tan, 2003). Shoppers consider convenience in terms of distance of the store from their residence (Arnold et al., 1983; Sinha & Banerjee, 2004) and location of the store (Oppewal et al., 1997; Silva & Giraldi, 2010). Further how easy the store is accessible for the shoppers with transportation facilities and shorter duration are seen under convenience (J. O. Kim and Jin, 2001). In the convenience store, dimensions high in speedy check is also counted (Hu & Jasper, 2006).
Status
The function factors of the store like physical appearance and intangible element like store reputation over the years, attract shoppers significantly (Gómez et al., 2004). Shoppers look for status as a value factor on selection of store (Erdem et al., 1999). The shoppers consider the selection of shopping store which may enhance their social status. (Teas, 1994)
Other services
Retailers do various services to the shoppers which will not end at the store environment itself. When the shoppers are out of the store after purchase, it is noted that the retailers still carry out their post purchase service connections (Birtwistle et al., 1999). The return or the exchange policy, refunds for the products what the retailers frame to benefit shoppers also contributes (Gómez et al., 2004).
Advertisement and promotion
Frequently shoppers look for promotional activities done by retailers (Hutcheson & Moutinho, 1998). The shoppers attitude over store is based on the advertisement (Fox, 2004; A. Ghosh, 1990; Jantan & Kamaruddin, 1999). Advertisement must be on informative basis and be useful for planning the shopping prior (Hansen & Deutscher, 1978; Thang & Tan, 2003). Shoppers look for weekly special events which distinct retailers (Arnold et al., 1983).
Price
By considering the different variable toward store image dimensions, price is considered to be widespread for store image formation (Diallo, 2012). Shoppers attitude toward store is influenced by price of the merchandise for store selection to shop (Mitchell & Harris, 2005; Moore & Carpenter, 2006). Pricing is based on the retailers decision which is complex in nature and it should match with the value of the products (Zielke, 2010). Many literatures contribute to address the complexity of pricing attribute (Desmet & Nagard, 2005) and fixing of price is to be reasonable (Hassan et al., 2010). Low price significantly attracts shoppers (Baltas & Papastathopoulou, 2003).
The shoppers supermarket choice is based on the attributes offered in the store environment by different supermarketers. The supermarket-related literature have found out different attributes related to store image dimensions which vary from one to another (Alhemoud, 2008; Desai & Phadtare, 2017; Oghojafor et al., 2012; Prasad & Aryasri, 2012). This provides a need for identifying the effective store attributes on Indian shoppers perspective toward supermarket selection.
Development of Hypothesis
Store Image and Customer Attitude
Attitude of a shopper determines favorable or unfavorable response toward a store (Ajzen, 1989). Evaluating the store attribute which is attitudinal is the input for the store image formation among shoppers (Steenkamp & Wedel, 1991). Store image is attitude based on the overall impression what a customer has about a store is based on store attributes (Semeijn et al., 2004). Shoppers evaluate attributes of store which forms a set of attitudes. According to Engel and Blackwell (1982), the customers tend to do shopping in a store more likely when their attitude is positive as a result of evaluating store cues in the store environment. Customers are found to have favorable attitude toward store attributes which forms an image on shoppers mind (Hu & Jasper, 2006). Retail environment attributes are gestalt in nature which significantly influences customers’ attitude (Mattila & Wirtz, 2001). Attitude leads to search of information about the store which is based on store attributes and also leads to selection of stores and the shopper’s behavior (Bloemer & de Ruyter, 1998; Dick & Basu, 1994). According to Ajzen (1989) attitude concept is directly reflected among consumers on behavioral intention basis: Conative attitude (positive/negative) forms an intention among the customers, and they act according to their intention (Eagly & Chaiken, 2007). Mehrabian & Russell (1974) proposed SOR model where the S—Stimli, O—Organism, and R—Response which are psychology in nature and attitudinal based represents the behavioral intention of the shoppers (Bagozzi, 1981; Mattila & Wirtz, 2001; Osman et al., 2014; Schreuder et al., 2016; Thang & Tan, 2003; Walsh et al., 2011). The customers’ evaluation of a store whether to shop or not is his or her attitude contributed by effective store attributes.
Shoppers Attitude and Perceived Value*
Perceived value (PV) is based on the customers attitude between what customer gets (utility) and what they sacrifice for it which contributes for purchase decision as it may occur in prepurchase stage (Woodruff, 1997). More the PV for the customers from the retailers while shopping, much stronger for the shoppers to purchase (Sweeney & Soutar, 2001). The argument of PV study is between two items the price and quality (Zeithaml, 1988) which is too short and larger number of components used to study customer PV (Bolton & Drew, 1991; Sweeney & Soutar, 2001). Many research works connected attitude over PV and examined empirically in retail setting (M. S. Kim & Hunter, 1993; Ruiz-Molina & Gil-Saura, 2008; Shukla, 2012; Swait & Sweeney, 2000; Salehzadeh & Pool, 2017; Sweeney & Soutar, 2001).
Thus, shoppers’ attitude toward the store attributes contributes to identify the PV. Thus the following hypothesis is framed (Figure 1).

Conceptual model.
PV and Purchase Intention
Purchase intention (PI) is attitudinal based with reference to the buying behavior of the shoppers (Ajzen, 1991; Armstrong et al., 2000; Wu, Yeh, & Hsiao, 2011). PI is the possibility of product/service to be purchased (Diallo, 2012; Fandos & Flavian, 2006; Wu, Lin, & Hsu, 2011). Customers overall experiences on the store and the confidence over it makes favorable and leads to PI which is attitude based (Armstrong et al., 2000; Cristina & Jean-Pierre, 2017; Fandos & Flavian, 2006). The outcome of the shoppers evaluation while interaction with the store is the PV which later approve or disapprove each interaction for PI as per transactional theory (Thaler, 1985). In decision-making process for a shopper, the PV reflects on PI (Collins-Dodd & Lindley, 2003). Many have studied the impact of PV on PI (Calvo-Porral & Lévy-Mangin, 2017; Chang & Wildt, 1994; Kuoa et al., 2009; Snoj et al., 2004).
Variables Measurement
This study was descriptive in nature and structured questionnaire was prepared to collect the data. The items were measured using 5-point Likert-type scale (“1” strongly disagree to “5” strongly agree). Store image attributes consisted of eight dimensions which included 29 items, which were finalized using the results of pilot study and experts’ opinions. The pilot study was conducted with 30 samples. The validity and the reliability of the measurement items of store image attributes were studied using exploratory factor analysis (EFA), and the result is shown in Tables 1 and 2. The shoppers’ attitude measuring elements are three in number adopted from Koo (2003). To measure the variables for PI and PV, pretested questionnaire were taken for the study. So the validity and reliability of these variables have been already pretested. The PI scale consists of three items adopted from Mbaye Fall Diallo et al. (2015). The PV consisted of two items adopted from Sweeney and Soutar (2001).
Big Supermarket Players in India.

Source. IBEF (2018).
Demographic Profile of the Samples.

Source. Primary data.
Sampling
The hypothesis taken in the study is tested using the data collected from the shoppers of supermarkets located in Tire II cities of Tamil Nadu. Tiruchirappalli, Madurai, Coimbatore, Salem, and Tiruppur are the tire II cities located in Tamil Nadu (Maps of India 2015). Supermarket intercepted survey among the shoppers of the aforementioned tire II cities are considered as population of the study.
The sample taken for the study is 442 suggested by the below mentioned formula as the exact population is not known (sample standard deviation obtained from the pilot study). To collect the data from the five tire II cities in Tamil Nadu each place was considered as strata group. Ninety samples were taken from each place. Convenience sampling method was used to pick the samples.
Data collection
For the study, a brief introduction was given to the shoppers who came to the supermarkets located in the aforementioned cities after meeting them in person and getting concern from them. A questionnaire was given to them for filling up. Questionnaire was presented in two languages, Tamil as well in English to help the respondents to better understand the variables. Larger number of shoppers accepted the invitation for filling the questionnaire as the supermarket was crowed and hence the researcher adopted convenience sampling. It took 1 month for data collection and was completed on August 2018. A surprise gift was given to the respondents before they started filling the questionnaire which motivated them to spend sufficient time on each question. In total, 450 filled questionnaires were received back, in which eight were unfilled and were not considered for the study.

where Z is the standardized score at 95% confidence level = 1.96, S is the maximum sample standard deviation among all the items given in questionnaire from preliminary study of 30 samples = 0.536, E = acceptable sampling error 5% = 0.05.
Hence,

Factors and Store Attributes Adopted in the Study
Ambience and Entertainment
Appealing
Decorative
Proper temperature
Big in size
Staff
Appearance
Friendly
Knowledgeable
Sufficient number of employees
Merchandise
Value for money
Specialized products
Variety
Convenience factor/ease of shopping
Easily accessible
Availability of transportation
Delivery
Providing carry bags
Status
Good history
Store is reputed
Reliable
Enrich status
Other services
Exchange policy
Return
Speedy complaint handling
Advertisement and promotion
Informative
Helps to plan shopping
Conducts special events
Attractive display
Price
Price is low
Reasonable price
Source: researcher
Data Analysis
The primary data of the research through survey were gathered from 442 shoppers from tier II cities. The sampled shoppers included mixed demographic profile of gender, age group, educational qualification, religion, monthly income, geographical location of the residence, and so on. This was done to avoid bias on the results which were based on the profile of the samples.
Table 3 presents the demographic profile of the samples chosen for the study. About 55.66% of the samples are male, and rest (44.34%) of them are females. It is also found that significant proportion (52.94%) of them belong to the age group of 26 to 50 years, nearly 30% of them belong to the age group of up to 25 years, and few (17.87%) of them are aged above 50 years. Around 10% of them are ITI/diploma holders, whereas 44.57% of them are undergraduates, 40.27% of them are postgraduates, and only 4.75% of them come under “others” category. Around 51.58% of them belong to the “Hindu” religion, 27.60% of them are “Christians,” 17.19% of them are “Muslims,” and only 3.62% of them belong to other religions. About 60% of them earn Rs. 40,001 to Rs. 80,000 per month, whereas 22.17% of them earn above Rs. 80,000, and only 17.19% of them earn up to Rs. 40,000 per month.
Exploratory Factor Analysis for Store Image Attributes.

Note. Extraction method: principal component analysis. Rotation method: Varimax with Kaiser normalization. AE = ambience and entertainment; SF = staff; ES = ease of shopping; SS = status; OS = other services; AP = advertisement and promotion; PE = price; ME = merchandise.
Rotation converged in seven iterations.
Statistical analysis of the constructs
The relationship between store image attributes, customer attitude (CA), PV, and PI was examined through the two-step structural equation modeling (SEM) approach. Confirmatory factor analysis (CFA) and path analysis were executed to measure, validate, and test the chosen constructs and their relationships (Hair et al., 2006).
Confirmatory factor analysis
As part of the first-step, EFA, reliability analysis of constructs, and CFA were executed. EFA was used to extract the relevant attributes contributing to the store image construct. The eight attributes were extracted with principal component analysis (PCA), Varimax rotation, and eigenvalue more than 1. The eight attributes together explained around 82.32% of total variance in the store image construct. The Kaiser-Meyer-Olkin (KMO) measure of the analysis is 0.829, which indicates sample size is adequate for the analysis. The items with more than 0.5 loading to the store image construct were termed as follows: Ambience and Entertainment (Attribute 1), Staff (Attribute 2), Merchandise (Attribute 3), Ease of Shopping (Attribute 4), Status (Attribute 5), Other Services (Attribute 6), Advertisement and Promotion (Attribute 7), and Price (Attribute 8).
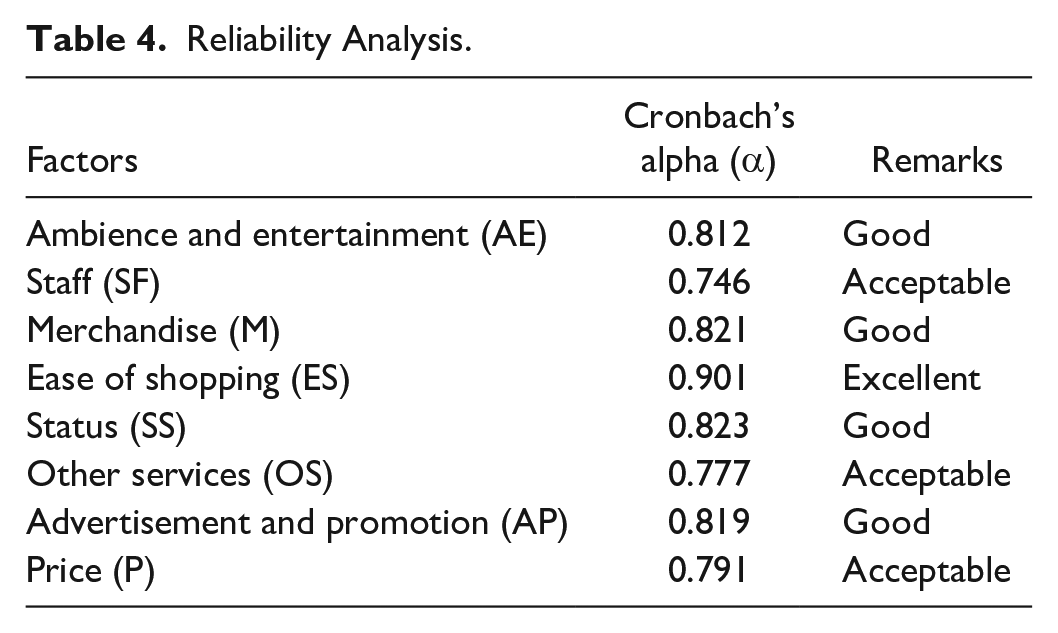
The reliability of the chosen factors of the research is presented in Table 4. The Cronbach’s alpha coefficient of all the chosen factors is greater than 0.70 which specifies that the measures are reliable.
Reliability Analysis.
The outcome of the CFA supports the store image attributes research model with CA, PV, and PI. Table 5 presents results of CFA with regression weight of the items and t values, and it is also found that the standardized regression coefficients (or weights) are significant at 1% level of significance.
Confirmatory Factor Analysis.

The parameter estimation of the measurement model was done using maximum likelihood estimation (MLE) with the help of IBM AMOS 22.0 software. The results of the measurement model designate the right fit of the data with the model.
The fitness indices of the model are described as given below. Chi-square statistic = 3.584, degrees of freedom = 424, p value = 0.351. The values of goodness of fit index and adjusted goodness of fit index are 0.924, and 0.912 respectively, which are more than 0.90 and indicates perfect fit of the model with the data. Similarly, the values of the comparative fit index and Tucker–Lewis index are 0.935, and 907 which are greater than 0.90 correspondingly, whereas the root mean square error of approximation, and root mean square residuals are 0.025 and 0.038, respectively, gives crystal clear picture that data store image attributes model extracted through EFA is having perfect fit with the data.
Path analysis
As part of the second-step in SEM approach, path analysis, and hypothesis test are executed. Store image of the retailers are measured through eight attributes such as Ambience and Entertainment (AE), Staff (SF), Merchandise (M), Ease of Shopping (ES), Status (SS), Other Services (OS), Advertisement and Promotion (AP), and Price (P). The other factors of the research CA, PV, and PI was measured through three items, two items, and three items, respectively.
The estimation of the measurement model was measured through MLE method with the help of IBM AMOS 22.0.
The fitness indices of the model are described as given below. Chi-square statistic = 3.157, degrees of freedom = 21, p value = 0.282. The values of goodness of fit index and adjusted goodness of fit index are 0.918 and 0.903, respectively, which are more than 0.90 and indicates perfect fit of the model with the data. Similarly, the values of the comparative fit index and Tucker–Lewis index are 0.902 and 913, respectively, which are greater than 0.90 correspondingly, whereas the root mean square error of approximation and root mean square residuals are 0.018 and 0.033, respectively, proves that the store image attributes of the retails shop is having impact on CA, PV, and PI. The structural (or path) model provides a good fit to the data.
The results of the hypothetical relationship mentioned in the model are discussed below. The relationship between store image attributes, CA, PV, and PI are examined using standardized coefficients (or weights) in the conceptual model (Figure 2). The structural relationships between the aforementioned constructs are shown in Figure 3. The standardized regression coefficient between store image attributes and CA is 0.763 which is significant at 1% level and specify that the chosen key attributes of the retail shops contributes to the formation of positive attitude of the customer toward store image and both these constructs are positively related. Therefore, it is recognized that the hypothesis (H1) is accepted. Similarly, the positive CA toward the retail stores, and its products and services results in positive effect PV from the stores with the coefficient of 0.97; therefore, hypothesis (H2) also accepted. It is found that the positive PV creates positive PI (i.e., stimulates customers to purchase from the selected stores) has the coefficient value of 0.94, which confirms the hypothesis (H3), and the aforementioned hypothesis are significant at 1% level.

Confirmatory factor analysis model.

The structural relationship between store image attributes, customer attitude, perceived value, and purchase intention.
Findings and Discussions
Statistical analysis on the primary data collected indicated that according to the demographic profile accounted that 52.94% of respondents belonged to the age group of 26 to 50 years. Around 60.63% of the shoppers who visited the supermarket were earning monthly income ranging from Rs 40,000 to 80,000. According to the EFA, the eight attributes together explained around 82.32% of total variance in the store image construct. The KMO measure of the analysis was 0.829 which indicated sample size is adequate for the analysis.
Eight effective store image attribute factors which were identified using EFA provided positive attitude about the store in the minds of the shoppers. The factors are Ambience and Entertainment (0.812), Staff (0.746), Merchandise (0.821), Ease of Shopping (0.901), Status (0.823), Other Services (0.777), Advertisement and Promotion (0.819), and Price (0.791). Further path analysis has confirmed the chosen key attributes of the retail shops which contribute to the formation of positive attitude with regression coefficient value is 0.763. Regression coefficient value of 0.97 indicated that there is a relationship between positive attitude about the store and increasing PV among the shoppers. Furthermore, it is confirmed that PV increases the PI among the shoppers with the regression coefficient value of 0.94. Hence, the conceptual model taken for the study is proved empirically.
Prior research studies have taken into consideration store image attributes and PV relationship directly and they have not often considered attitude variable. In this context, the store image attributes which are functional to the shoppers influence their attitude and increases the PV. Furthermore, the store attributes are large in number especially for organized retailers. Taking this fact into consideration, this study addresses this question: With the set of attributes whether retailers can create a positive attitude among the Indian shoppers which will lead to increase in the overall impression about the store? The answer is “Yes,” store attributes have the ability to influence attitude, PV and PI among the Indian shoppers. The contribution from this study articulates that the formation of PI, PV, and attitude is based on a set of dimensions of store image attributes offered in a store environment. Highlighting the major findings of the paper, store attributes play a vital role in boosting the value about the store among the shoppers and create an intention to purchase.
The shoppers who visit supermarket for shopping under “ambience” factor are considering the size of the outlet, that is, big in size created positive impression and how far it is decorative is seen to be an important factor. Furthermore, based on “merchandise,” shoppers look for specialized products in category with varieties of alternate choices. As the supermarket deals with larger number of product varieties, the shoppers are in need of knowledgeable “staff” in terms of identifying the products required and choosing from alternates. Larger customer count is confirmed when the supermarket “eases” the shopping in terms of transportation available and providing carry bags at the time of purchase. Beyond the functional attributes, shoppers prefer to do shopping in a supermarket which has good reputation and the years of existence as it is related with their “status.” Shoppers do share their shopping experience with their circles. Supermarkets in India can do “advertisement and promotion” in terms of conducting special events (e.g., festival related) and displaying the products in an attractive way may create positive opinion about the store. The Indian shoppers especially in Tier II cities do compare the price of the products charged by different supermarkets. A positive impact is created when they pay a low “price” for the products they purchase.
This study has empirically proved that shoppers attitude is based on store attributes and its dimensions which play a vital role on providing higher value for the shoppers and confirming—once a shoppers enters the supermarket he or she will do purchase fueled by effective store attributes. Supermarket retailers can manage their store by focusing on the aforementioned attributes which will provide positive attitude among the shoppers. This in turn leads to perceive value at the end. The entire store environment will increase the PI. The theoretical conceptual model developed through observation and shopping experience of the shoppers has been proved empirically through statistical analysis.
Theoretical Implications of the Study
Retail industry in India is transforming into a more organized sector. Many big players both national and international have entered into this arena. Franchisees have increased and chain of stores are also increasing. To achieve a competitive edge, retail firms have to focus on the physical evidence in the form of service scope or retail environment. This would mean that store image can be enhanced more on the appearance and various attributes discussed in this article.
Same type of study can be taken up in other types of retail outlets like Gem and Jewelry, Apparel, Footwear, and so on. Furthermore, the research can be done in Tier I cities like Chennai, Mumbai, Delhi, and so on, where different consumer profile exists. This would provide new insights on store image attributes. On the shoppers behavioral part, other variables like customer satisfaction, relationship between customer loyalty, and retail store image attributes can be studied.
Conclusion
This study contributes toward shoppers behavior in retail setting with store image attributes as an important element. Store image attributes attract shoppers to do shopping in a retail outlet. As an extension to the past research, this research work accessed the shoppers’ behavior using PV and PI with store image attributes as an influencing variable. Eight effective store image attributes factors were identified using EFA which attract shoppers and also provide positive attitude about the store in their minds. The factors are Ambience and Entertainment, Staff, Merchandise, Ease of Shopping, Status, Other Services, Advertisement and Promotion, and Price. Thus focusing on the aforementioned store attributes retailers can increase their customer footfalls. Furthermore, the SEM Path Analysis confirms the relationship between Store image attributes, CA, PV, and PI.
Footnotes
Declaration of Conflicting Interests
The author(s) declared no potential conflicts of interest with respect to the research, authorship, and/or publication of this article.
Funding
The author(s) received no financial support for the research, authorship, and/or publication of this article.