
Abstract
Air passenger traffic prediction is crucial for the effective operation of civil aviation airports. Despite some progress in this field, the prediction accuracy and methods need further improvement. This paper proposes an integrated approach to the prediction of air passenger index as follows. Firstly, the air passenger index is defined and classified by the K-means clustering method. And then, based on mutual information (MI) principle, the information entropy is used to analyze and select the key influencing factors of air passenger travel. By incorporating the MI principle into the support vector regression (SVR) framework, this paper presents an innovative MI-SVR machine learning model used to predict the air passenger index. Finally, the proposed model is validated by air passenger throughput data of the Shanghai Pudong International Airport (PVG), China. The experimental results prove MI-SVR model feasibility and effectiveness by comparing them with conventional methods, such as ARIMA, LSTM, and other machine learning models. Besides, it is shown that the prediction effect of each model could be improved by introducing influencing factors based on MI. The main findings are considered instrumental to the airport operation and air traffic optimization.
Keywords
Introduction
The global “digital divide” status quo is quickly changing with the progress in artificial intelligence (AI) technologies and their application area expansion. Nowadays, AI has been under researched, the heart of AI technologies is machine learning (ML), which has branched into shallow and deep learning (Gunning & Aha, 2019). Modeling these areas is often an approximation of the objective phenomena involved by machine learning methods. Examples of shallow ML models are the support vector machine (SVM) invented by Cortes and Vapnik (1995), and neural networks (NN). Numerous shallow ML models have been deployed in many research fields, including speech and natural language processing, computer vision, and public opinion mining (Barth et al., 2019; Chen et al., 2020; Guo & Zhang, 2020; Niu et al., 2020; Ullal et al., 2021; Zou et al., 2019). The linear and nonlinear shallow models have gained impressive results in regression and prediction studies, including the prediction of airport passenger throughput with high accuracy (Li, Han, et al., 2018; Li & Jiang, 2020; Sun, Lu et al., 2019). Such linear models as autoregressive integrated moving average (ARIMA; Li, Han, et al., 2018) and gray model (GM; Li, 2014) have achieved significant predictive results. However, nonlinear models, including the BP-neural network (Dantas et al., 2017), recurrent neural network (RNN; Başaran and Ejimogu, 2021), long- and short-term memory network (LSTM; Greff et al., 2017; Kong et al., 2017; Li & Cao, 2018), and support vector regression (SVR; Liang et al., 2015; Li, Ni, et al., 2018; Sun et al., 2011, 2014; Tuo, 2012) were found to be more robust than linear ones due to their strong fault-tolerance levels.
Current airport passenger throughput prediction literature portrays the predominance of research output from mature western aviation markets. These markets possess high statistical regularity (Sun, Lu, et al., 2019; Sun, Wei, et al., 2019), and therefore, predictive models used may not generally be appropriate for emerging markets. To overcome the statistical irregularity in developing markets, the mutual information (MI) principle of the probability and information theories, which reflects not only linear but also a nonlinear correlation between variables is used in this study for the airport passenger throughput prediction for the PVG, which is a typical international hub airport in mainland China. The superior predictive capacity of blended MI and ML models is discussed in the literature (Chernyshov, 2013; Sharmin et al., 2019). Using the achievements of prior studies, this paper not only focuses on passenger throughput of civil aviation airports but also processes ancillary data related to passenger throughput, to obtain a comprehensive visual representation of air passenger travel. Based on relevant literature, the current study combines the information theory knowledge with the SVR method and calculates MI to enable the selection of key influencing travel characteristics to build the blended MI-SVR model. The main goal of this blended model development is to achieve a better forecast that accurately guides passengers’ choice of travel time, given the selected influencing features of air travel.
Machine learning abilities can take digital marketing to new heights with their AI making all the difference. Of course, ML methods are more and more widely applied to air passenger transportation. In terms of route flow, the gray model is used for route passenger flow prediction (Xia et al., 2016), while classical neural network models and other blended models are exploited for the hybrid prediction of airport passenger and freight route flows (Sulistyowati et al., 2018). The regional aviation passenger flow aspect is covered by the neural networks and SVR models (Sun, Lu et al., 2019), which effectively predict the regional aviation market trends of the short- and long-term passenger flow. The effective strategy, which allows a regional aviation company to increase the hub passenger flow influence in the existing route network, was proposed (Tuo, 2012). Air passenger flow characteristics are quite accurately predicted based on the time sequence columns (Kong et al., 2017; Li & Cao, 2018; Sun et al., 2014; Ullal et al., 2021) and nonlinear vector autoregressive neural network (Li & Jiang, 2020). Jun et al. (2010) stated that comprehensive gray correlation method was adopted to analyze the factors influencing air passenger volume, identify the main ones, and elaborate the respective multiple regression model. As follows from the above brief survey, the attempts to improve the model prediction accuracy in this field involve either a refinement of a particular single model or blending of several models, to achieve better results.
The MI approach can reflect both linear and nonlinear correlations between variables. The efficiency of feature selection based on MI (Kinney & Atwal, 2014; Sharmin et al., 2019) and ML field (Cai et al., 2021; Chernyshov, 2013; Sun, Wei et al., 2019) is well-known. In contrast to the previous studies, based on the analysis above and to resolve the airport passenger forecasting problem, this article contributes to the existing body of literature in two respects: first, a new air passenger index and evaluation method is proposed. Second, a novel air passenger index prediction approach, combining mutual information and original SVR method, will be applied to predict airport air passenger index.
This paper analyzes the air passenger throughput of a civil aviation airport and processes the air passenger throughput as the basic data. Thus, it can directly reflect the travel situation on air passenger flow and provide auxiliary data for the monthly decision-making of civil aviation airport’s operation service. Besides, available methods mostly take into account the accumulated historical data and neglect other related factors that affect the travel of air passengers. Based on the research of other scholars, this paper introduces the knowledge of information entropy and SVR method, selects key influencing factors through the calculation of MI to build an ML prediction model, using this way to find a better prediction method for the travel schedule selection by which passengers choose and provide the relevant reference basis.
The rest of this paper is structured as follows. Section 2 clarifies the research topics and methods to address them; section 3 introduces the MI and SVR original theory, and then presents the blended MI-SVR model. Section 4 analyzes the passenger throughput and weather data of the PVG, to verify the MI-SVR model’s feasibility and effectiveness, in addition, the methodology is used to evaluate in the PVG air passenger index. Section 5 concludes the paper and discusses future research avenues.
Research Topics
The rising demand for civil aviation airports has created enormous operation and management databases that exhibit significant differences between particular airports. Therefore, it is crucial to identify the contextual factors of particular airport’s service capabilities that would facilitate the provision of required support to airports’ operations and management and furnish solutions for the public air traffic optimization. This implies the necessity to convert the raw data on air passenger throughput to the air passenger index (API), which takes into account the airport’s capacity and variability in passenger traffic volumes. The following definitions provide the mathematical representation of API and the level of air passenger index (LAPI).

where

Where
The API and LAPI indexes of civil aviation airports are instrumental in optimizing their operation and management solutions and improving their services. They are incorporated into the blended MI-SVR model elaborated in this study.
Related Theory and Model Elaboration
Mutual Information Theory
The information entropy is a key indicator in the information theory, which was introduced by Shannon in 1948 (Fan et al., 2013) based on the following concept: the more ordered is a system, the smaller is its information entropy and vice versa. Therefore, information entropy can be used to measure the degree of system uncertainty (or degree of ordering) (Fan et al., 2013; Gao & Wu, 2020; Ma & Ma, 2018; Zhang et al., 2016) Information entropy can be derived via the following formula:

where
Let the joint probability distribution of the random vector

Assuming that the joint probability distributions of

Thus, MI can be expressed as an entropy value for which the variable

By combining formulas (3)–(6), the complete expression of MI can be reduced to the following form:

Support Vector Regression (SVR)
The support vector regression (SVR) is a widely used ML prediction method, which adopts the principle of minimizing structural risk rather than minimizing empirical risk. This allows one to effectively mitigate numerous problems, such as “dimensional disaster” and traditional pattern recognition (Farber et al., 2016; Li, Ni, et al., 2018; Nieto et al., 2013; Qingyang et al., 2012; Sun et al., 2011, 2014; Tao et al., 2020; Yang et al., 2017). The general linear regression model can be expressed as follows:

where

where C is a regularization constant for performing a compromise calculation on the front and the back. The former term (front) indicates that all predicted values fall within the error range, as much as possible in the model structure. The latter (back) applies the

In the actual API data, a certain value may exceed the normal trend due to external reasons and become an outlier. In this case, the “hard interval” defined above is no longer applicable. Therefore, in the case of serious deviations from the actual value, slack variables


Using the dual principle and introducing Lagrangian multipliers
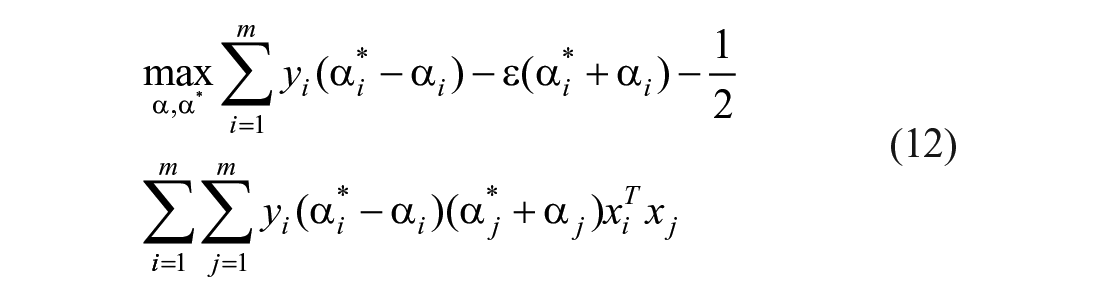

When the predicted value of the API falls into the


For the API time series data with a nonlinear trend, the SVR can map the sample to the high-dimensional space through the nonlinear mapping function

where gamma is the Gaussian radial basis kernel function parameter (
The RBF function application improves the SVR nonlinear prediction ability. Eventually, the SVR regression function takes the following form (Zhou, 2016):

Model Elaboration
Based on the preliminary data preprocessing, the raw data were converted into the corresponding information entropy values. All data were then normalized to permit the elimination of dimensions in the data unrelated to the API. These dimensions/factors were defined as those with small influence according to the ranking of MI values. Next, the key influencing factors were selected to set the ML model’s foundation based on the MI principle and improve the prediction given smaller dimensions. The graphical representation of the MI-SVR model elaboration procedure is given in Figure 1.

MI-SVR model elaboration process and its application to API prediction: (a) the key influencing factors selected based on mutual information and (b) blended MI-SVR model application process.
The following steps were required for constructing the MI-SVR model for the API prediction.
Empirical Analysis
Numerical Experiments
Data acquisition and processing
Using the API definition in Section 2, the raw data was considered representative and suitable for modeling without missing values. The data used for the experiments had to be converted into the form consistent with the constructed model’s input dimension. In this study, the original air passenger throughput values were converted to API. The dataset used in this paper included the complete raw data on daily air passenger throughput, maximum temperature, minimum temperature, weather, wind direction, and wind power for the PVG, which covered 20 months from January 1, 2017, and August 31, 2018. The weather, wind direction, and wind power data had a textual format, while the temperature data were graded to indicate different temperature levels. The data conversion results are summarized in Table 1.
Data Preprocessing Correspondence Table and Pre-Processing Raw Data From This Table.
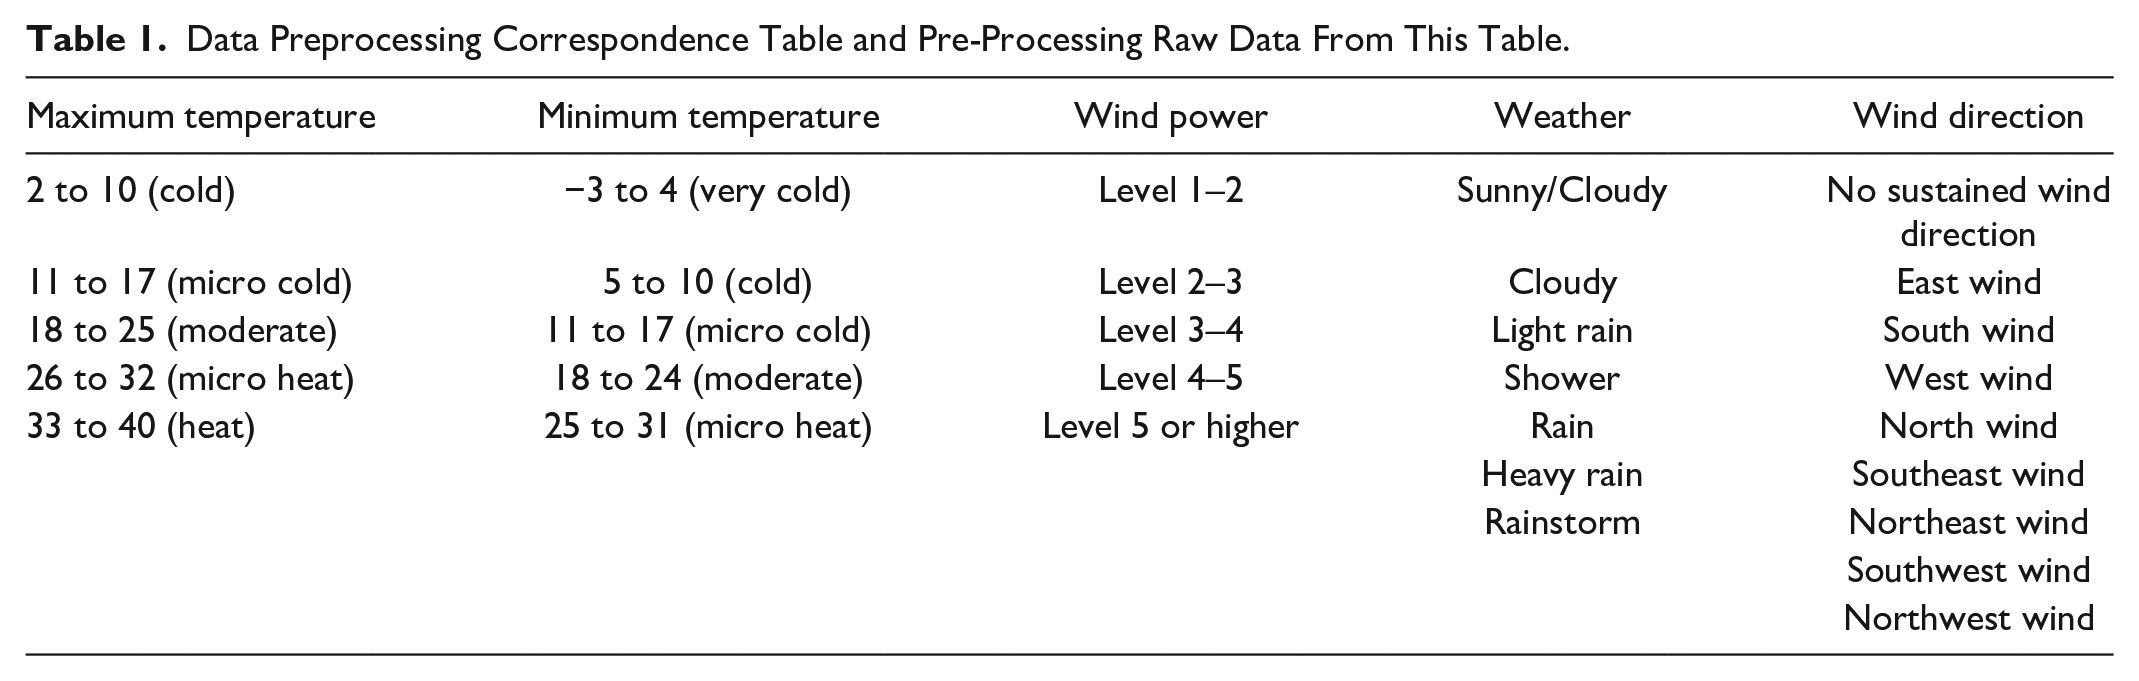
For the airport operation data modeling based on the theory of information entropy, this study converted the five categories of data into their corresponding information entropy values. Then, the total passenger throughput data were calculated according to formula (1), and the standardized passenger volume value was classified as the API by the K-means clustering algorithm. The classification results are listed in Table 2. Finally, the MI values of the transfer passenger travel index level and the five key influencing factors were calculated separately. The latter factors controlling the API were the maximum temperature, minimum temperature, wind direction, weather, and wind power. The MI values of these factors in the API are given in Table 3.
Using K-means Clustering Algorithm to Classify API and its the Levels.

MI and the Ranking of the MI Values.

From the Table 3, it can be concluded that the least impact on the API is wind power. Through statistical analysis of wind factors, it was revealed that the proportion of wind level above level 5 is only 2.3%, while nearly 88% of the data is not higher than level 3 (level 3–4). Therefore, the influence impact of wind power on the nearly API is relatively small.
Error analysis method
To analyze different model prediction results, this study used the mean absolute percentage error (MAPE) and root mean square error (RMSE), which can be derived via the following equations:


where
Discussion
Selection of key factors
The RMSE and MAPE values obtained via the MI-SVR model were 0.1030 and 11.44% for the maximum temperature as a single influencing factor. Those for the minimum temperature were 0.1016 and 11.18%, respectively. The minimum temperature effect was found to be slightly higher than that of the maximum one. The analysis also showed that the Pearson correlation coefficient between the maximum and minimum temperatures was 0.581, and a close correlation within the 99% confidence interval was observed.
From Table 3, it can be concluded that wind power had the least impact on the API. The wind power factor’s statistical analysis revealed that the share of recorded wind power above level 5 was only 2.3%, while the remaining 88% of the data corresponded to levels 3 and 4. Therefore, the wind power effect on the API was relatively weak.
Given these findings, three key influencing factors, namely the minimum temperature, weather, and wind direction, were selected for incorporation into the forecast of the air passenger index to get more accurate prediction results.
The experimental data used in this study were subdivided into two parts. The first part covered 19 months (577 days) of API data from January 1, 2017, to July 31, 2018, and was applied to the model training. The second part covered the remaining month (August 1–31, 2018) of the dataset and was adopted as a test set for verifying the model fitting effect. The numerical experiments were realized via the Python 3.6 software and produced some noteworthy results. After numerous numerical experiments, it is found that when the specific parameters of the model were set at certain values, the error terms of the overall effect of both the training and test sets reached their minimum values. The model-related parameter settings are listed in Table 4.
SVR Model Parameter Setting.

Comparative experimental analysis
This study proposed blended MI-SVR model was tested with the account of influencing factors and without their account (as a single original SVR model). For comparison, commonly used LSTM and ARIMA single model, as well as their blended variants, namely the GM(1, 1)-BPNN and SVR-ARIMA models (Liang et al., 2015; Tuo, 2012), were applied to the training and test datasets. The actual and predicted values of the above six prediction models were calculated, as shown in Figure 2, where the left part of the black dotted line depicts the respective model fitting effect on the training set, and the right part corresponds to the prediction results on the test set. The MI-SVR model outperformed the LSTM and ARIMA single model, which only met the general trend of the data but did not fit well with the higher and lower values. The blended MI-SVR model had a better prediction effect than single models by introducing the conditional entropy of influencing factors.

Comparison of actual values and predicted values of the different model: (a) ARIMA, (b) ARIMA + conditional entropy, (c) LSTM, (d) LSTM + conditional entropy, (e) SVR, and (f) SVR + conditional entropy.
The MAPE and RMSE values of the six models calculated via equations (17) and (18), respectively, are listed in Tables 5 and 6. It is seen that all blended models had a better prediction effect than single ones and others blended variants models, such as GM(1, 1)-BPNN and SVR-ARIMA models.
RMSE and MAPE Comparison of Different Models.

Comparison With the Prediction Effect of Others Blended Variants Model.

In summary, since MI is the random event correlation analysis method, the MI value can track the existence of a potential relationship. Thus, screening key influencing factors for API prediction based on MI provided the necessary conditions for improving the model’s predictive accuracy. After the analysis of each model and the introduction of the highest temperature, the lowest temperature, and the wind direction as influencing factors, the overall prediction effect of each model was significantly improved. It is noteworthy that the MI-SVR model designed in this paper had the best prediction accuracy among other tested single or blended prediction models.
Air traffic volume analysis
The developed MI-SVR model was applied to analyze the API evolution in the PVG during a more extended period, namely 130 months, from January 2008 to October 2018. For brevity’s sake, only the most prominent features, which are considered instrumental in guiding operational and managerial decisions, are presented in this study. Figure 3 depicts the LAPI values in each month.

The LAPI of PVG from January 2008 to October 2018.
✓ January and February of each year correspond to the “dead season” of the PVG, and API values are the lowest in those months, which closely correlates with the Chinese New Year festivities, during this time, many people prefer to reunite with their families rather than travel. Airport operation managers can refer to the LAPI to make optimal operation and maintenance plans. In other words, this period can be used by the airport management for performing expansion or upgrade works on its core and ancillary facilities.
✓ Fairly stable API values are observed in the period from March to June, November, and December, these months are relatively busy months for major airlines, this period airport can arrange fixed service resources to guarantee operations, and airlines can draw up scientific flight plans.
✓ The busiest period for each year is from July to October. From a global standpoint, this period corresponds to the summer vacation travel period. From a local standpoint, this period is the most lucrative for Shanghai’s major tourist attractions.
Conclusions and Future Research Avenues
Conclusions
The current study attempts to deal with the operational and managerial challenges induced by the airport passenger throughput increase. In order to achieve this goal, the data on airport passenger throughput were converted into the corresponding API and LAPI values. They were evaluated by the K-means clustering method, which indicates the passenger flow at civil aviation airports. The LAPI provides certain decision-making references for the general public to choose travel time and transportation options.
Aiming at the prediction of API in civil aviation airports, this paper proposes a blended MI-SVR model, takes account of the key influencing factors for improving the prediction results. Influencing factors selected in this study includes minimum temperature, weather conditions, and wind direction. By way of experimental simulation, the model was verified on the daily airport passenger throughput data of PVG. The prediction results of the proposed MI-SVR model were compared with those of such popular ML prediction models, such as LSTM, ARIMA, SVR-ARIMA, and GM(1,1)-BPNN models. Based on the proposed MI-SVR method, experiments were carried out on historical airport passenger throughput. Experimental results illustrate the effectiveness and advantages of the proposed method. The main findings of the comparison results are as follows:
(1) The results provided by the proposed model outperform other tested single or blended models by the overall prediction accuracy.
(2) The original SVR for predict problems is extended, and the MI-based influencing factors of API prediction are scientifically viable.
(3) In contrast to single (LSTM and ARIMA) models and blended (SVR-ARIMA and GM(1,1)-BPNN) models, the proposed MI-SVR model achieved relatively better prediction results.
(4) The LAPI evolution at PVG conforms to the rising annual population patterns.
Finally, the MI-SVR model provides an effective reference method for evaluating API in airport construction, operation, and management. For example, the maintenance schedule of airport facilities and equipment, ground service, and aircraft allocation can be optimized with API. The effectiveness of MI-SVR model is demonstrated for API prediction and the results are very satisfactory. This study will relieve both airport operators and managers, as well as passengers, of possible performance deterioration.
Future Research Avenues
In the follow-up studies, more possible influencing factors data would be collected and processed to establish a dynamic air trip prediction model. Besides, more datasets, such as high-speed trains network, highway network, air traffic control, and origin-destination demand, will be incorporated into the methodological framework. Furthermore, we plan to investigate the applicability of this methodology to datasets of other civil airports, in other words, to improve the model training quality, there is a need for more data. We also encourage other researchers to explore these directions for civil aviation development.
Footnotes
Acknowledgements
We thank the editors and any reviewers for their helpful comments.
Author Contributions
Conceptualization and Formal analysis, Honglin Xiong; Writing—discussion of the original draft, Chongjun Fan. and Collins Opoku Antwi; Data curation, Yun Yang; Methodology, Chongjun Fan; redrafting and editing, Collins Opoku Antwi and Xiaomao Fan; discussion of reviewer(s)’ Comments and giving important suggestions, Chongjun Fan and Hongmin Chen.
Declaration of Conflicting Interests
The author(s) declared no potential conflicts of interest with respect to the research, authorship, and/or publication of this article.
Funding
The author(s) disclosed receipt of the following financial support for the research, authorship, and/or publication of this article: This research was supported by Key (Key grant) Project of Chinese Ministry of Education (Grant No. 20JZD010), the National Natural Science Foundation of China (Grant No. 71774111), and the Key fund projects of Shanghai Municipal Education Commission for scientific research and innovation (Grant No. 14ZZ131).