
Abstract
In this paper, we establish the process of building up knowledge in oil markets using market observables from oil derivatives trading activity and a measure of academic publication volume. We establish the way in which knowledge feeds back into market activity via the channels of different regulation policies. Employing a textual analysis based on information from Web of Science and Scopus databases, we build our knowledge proxy using the total number of publications, and run a cointegration test for the 2000 to 2020 period against two measures of trading activity. We find leadership of the market activity variable when considering the whole sample. The influence of knowledge on market activity is captured in the aftermath of the Global Financial Crisis. Furthermore, the interaction of both variables is reinforced in 2014 after the final implementation of the Volcker rule and during the onset of the crude oil price collapse. Our results shed light to the need of monitoring the joint dynamics of publishing and trading activity to improve the resource allocation and financial product innovation process.
Keywords
Introduction
Over the past three decades, large literature has emerged addressing the determinants of crude oil prices since the detection of their drivers is decisive in the optimal allocation of economic resources and trading activity. The 2008 boom and bust episode, coupled with the almost simultaneous development of the Global Financial Crisis (GFC), focused the attention on the impact of the crude oil market in the global financial systems, and provoked massive research (see Smyth & Narayan, 2018) and a parallel rise in the trading activity.
In general, academic papers use market information to build improved financial theories that then contribute to a better understanding of the financial markets and the global economy. In this paper, we analyze the relationship between research publications and trading volumes, specifically in the crude oil field, to establish the way in which knowledge feeds back into market activity and vice versa.
There are several reasons that explain the rapid surge in oil trading activity over the first two decades of the new century. Among them, portfolio diversification purposes, in the context of the GFC, given the low correlations that commodities exhibit with other financial assets have played a significant role (see Cheng et al., 2015; Gorton & Rouwenhorst, 2006). Besides, the permissive regulation during the pre-crisis years also became a main driver of the increased amount of liquidity into commodity markets, especially seen in the oil one (Caballero et al., 2008; Gkanoutas-Leventis & Nesvetailova, 2015). This process ended in the aftermath of the GFC with the introduction of the Volcker provision and the Dodd Frank Act limiting proprietary trading by commercial banks. Since the Volcker rule took effect in 2014, overall market liquidity changed, including volumes traded in the oil futures and options markets.
However, the relevance of the oil market is not only evidenced by the vast amounts of trading volumes but also by the quantity and quality of papers published in this area. Unfortunately, while the determinants of the crude oil price and market fundamentals have received enormous attention in the academic literature over the last two decades, the focus on the relationship between market activity and academic publications is limited. The work of Brooks et al. (2019) as well as McLean and Pontiff (2016) constitute important exceptions. The former uses a mixed method approach to address the impact of research on the financial industry and society analyzing the best publications and topic trends in the top ranked journals. The later analyzes post publication return patterns to assess the predictability of cross sectional stock returns. In a related vein, Smyth and Narayan (2018) provide a survey of the literature that scrutinizes the effect of oil prices on stock returns highlighting the massive increase in oil publications seen over the last two decades.
The relevance of the research activity as another measure of the importance of the crude oil market is given by its influence in the market activity. That is: academics attention arises from changing market volumes and prices (due to demand and supply factors) and their interest is crystallized in increased research activity and papers published. As a result, the knowledge recorded in these publications, influences posterior market activity (as in McLean & Pontiff, 2016, who found that research affects stocks prices). At the same time, only liquid markets offer reliable data for financial research. For these reasons, the financial trading activity and the publishing activity are expected to share common trends, and the consciousness of the relationship between them becomes essential for market participants, since, a deeper understanding leads to more successful subsequent design of regulatory interventions, hedging strategies, and pricing mechanisms.
Our work aims to contribute to this literature strand by examining the extent to which the increased oil trading activity was accompanied by a parallel rise in research interest. In order to do so, we model the relationship between both variables by establishing a cointegration analysis between the number of publications in rated journals and the trading activity.
To build up the stock of knowledge regarding the oil market, we apply textual analysis (a word base classification scheme) to create a quarterly time series variable for the level of publications and analyze it jointly with a quarterly time series of aggregate trading activity in the futures and options markets. By doing so, we address the demand in Brooks et al. (2019) of conducting financial research using different methodological approaches.
We proceed stepwise; first, we apply a cointegration analysis following the methodology used in previous literature to study long-term relationships between low frequency variables that are structurally related.
Our results reveal cointegration between the oil-related publishing productivity and the trading activity during the 2000 to 2020 period, in which the number of papers published follows the volumes of aggregated futures (and options on futures) traded. We therefore contribute to literature by demonstrating that research and trading activities are cointegrated, crucially cementing the joint evolution of the two.
Second, we address the recent literature that acknowledges the importance of 2008 and 2014 in crude oil prices by incorporating the shocks arising from the boom and bust cycles leading to the GFC and the 2014 crude oil price collapse in our study (Baumeister & Hamilton, 2019; Figuerola-Ferretti et al., 2020). By doing so, we document how knowledge feeds back to the market and affects trading activity in the aftermath of the GFC. We contend that the Granger Causality evidence of price leadership from publishing activity into the market activity arises via the channel of imposing different regulation schemes in the post crisis era. Otherwise, in the aftermath of the 2014 price debacle and with the definitive implementation of the Volcker rule, there is Granger Causality in both directions.
To our knowledge, there is no previous research regarding the relationship between the trading volumes and the academia research productivity in financial assets. In this paper, the oil market is analyzed to gain insights of the influence of one on another. This is relevant (i) since market traded volumes and the assets’ liquidity are needed to make data used by researchers reliable, and (ii) to reveal the influence of researchers and regulators in market activity. Our findings suggest that knowledge feeds into the regulation process and provokes changes in practitioners’ activity propelling innovation in financial assets. These new vehicles emerge to minimize the regulation impact and imply the maintenance of derivatives traded volumes.
The rest of the paper is organized as follows. Section 2 provides a detailed analysis of the publishing and market activity variables construction and discusses the role of the regulation process. Section 3 presents the methodology used in the cointegration analysis. In section 4 we report the empirical results for the cointegration framework. In section 5 we take account of the post crisis regulation era and analyze the interaction between trading activity and the publication process in three subsamples. Section 6 concludes.
Data Description
The Publication Variable
We quantify the influence of the surge in oil publishing activity by means of a text search-based methodology. This word base classification scheme captures the number of oil published papers using a tittle search technique that converts qualitative information into quantitative measures. Textual analysis has been widely applied in the finance literature to study the impact of text-based information on stock returns (e.g., Loughran & McDonald, 2011; Tetlock et al., 2008) demonstrating that it represents an efficient alternative to capture relevant sources of information. Other authors such as Fernandez-Perez et al. (2020) concluded that text-based measures (in their work, google trends) account for the futures price variation observed in the market.
The search of articles that include “oil” in the title is limited to two of the best high-quality academic research databases: Web of Science (WoS) and Scopus. We focus our search using them in preference over others as they include guaranteed scientific content, strict filtering and anti-manipulation policies, and offer valuable resources for searching and collecting metadata (Aksnes et al., 2019; Martín-Martín et al., 2018). Thus, we consider that these two databases gather the qualified and relevant scientific research on the target topic and assume that those oil publications that are not captured by them evolve under a similar process. We restrict the category to Business Finance or Economics in WoS and to Economics, Econometrics and Finance in Scopus, and reduce the type of papers to articles in both cases. We combine the results to identify the relevant papers published related to oil, taking into account those, which appear in both. By doing so, we obtain 5,315 pieces published between 2000 and 2020 (see papers found in Q4 2020 as illustration in Supplemental Appendix A).
As shown in Figure 1, the publishing process within the crude oil market has been very significant and immersed in a bullish trend. This academia productivity is partly driven by the financialization discussion (e.g., Cheng & Xiong, 2014; Gkanoutas-Leventis & Nesvetailova, 2015; Irwin & Sanders, 2012; Stoll & Whaley, 2011; Tsvetanov et al., 2016). It is also enhanced by the effects of the oil shock of 2007 to 2008 (Hamilton, 2009; Soros, 2008), the subprime crisis (Caballero et al., 2008) and the crude oil Shell revolution within the 2014 crude oil price collapse (Baumeister & Kilian, 2016; Kilian, 2017). The commodities literature has also shown the increased demand of this asset for diversification purposes (Cheng et al., 2015) and the relevance of new Exchange Traded Products (ETPs) and index investing (Corbet & Twomey, 2014; Guedj et al., 2011; Marszk, 2017; Stoll & Whaley, 2010). The bubble testing methodology is also applied to crude oil markets by Caspi et al. (2018) and Fantazzini (2016), among others.
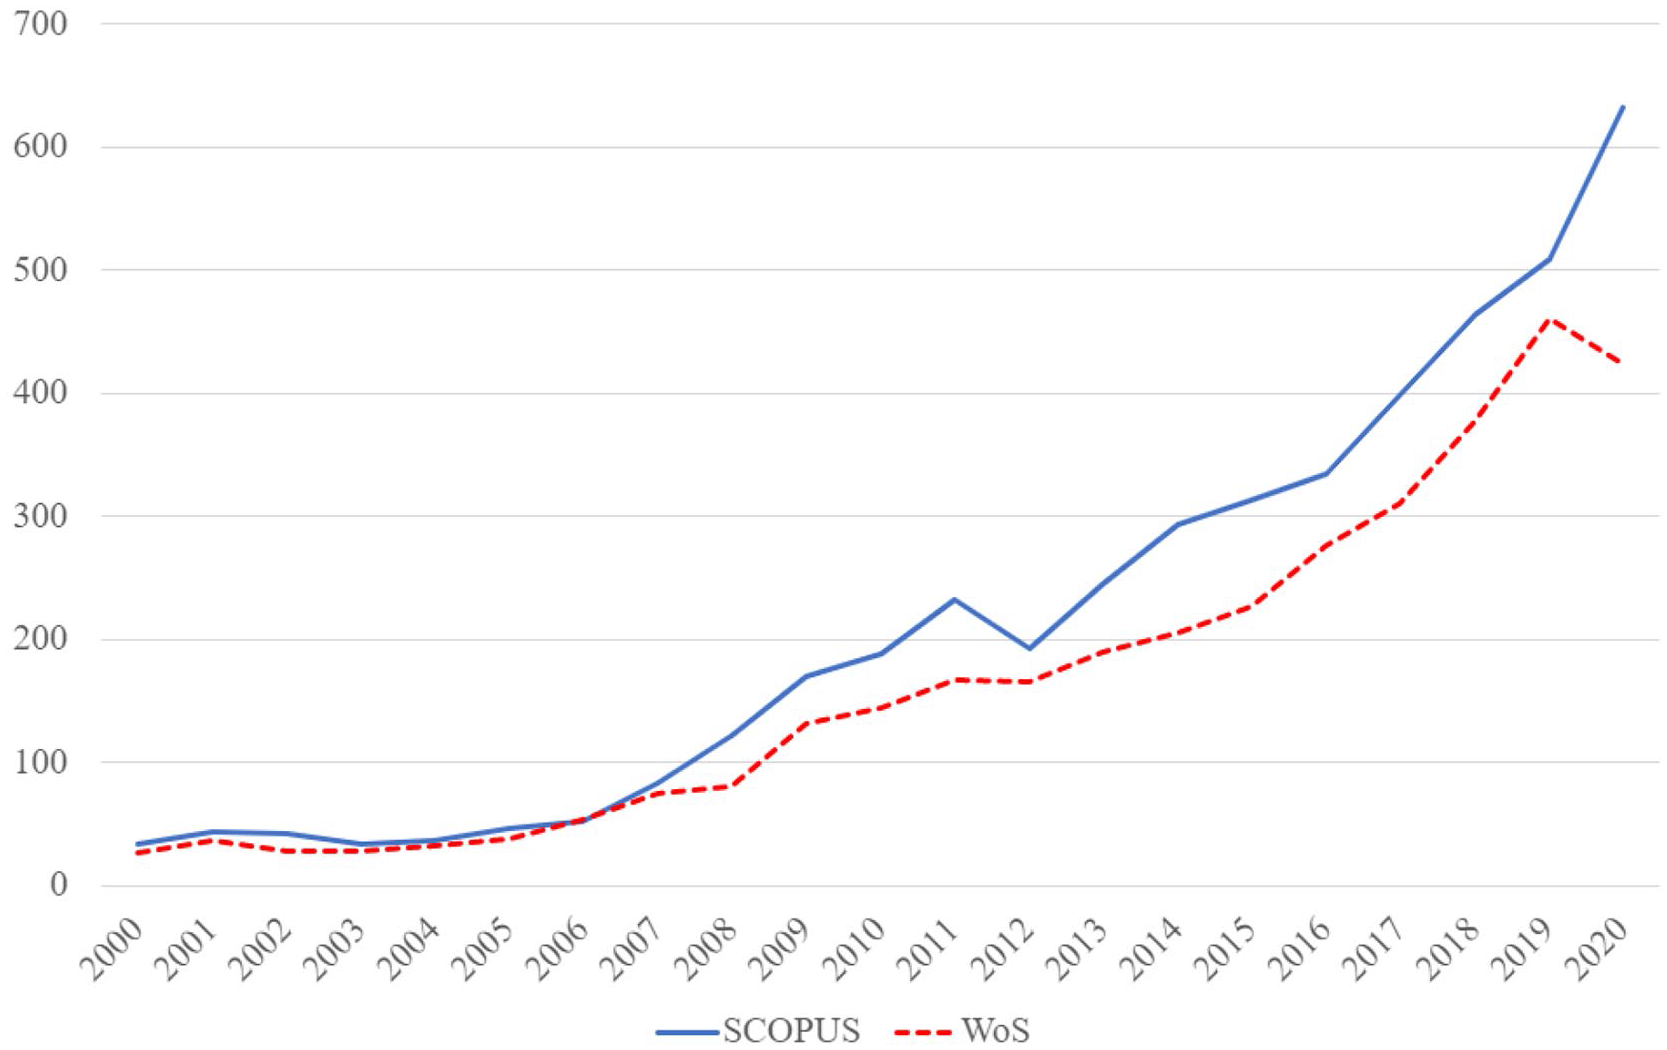
Oil publications in WoS and Scopus (in units per year) displaying academia’s activity regarding this asset between 2000 and 2020.
The prolific research outcome shown in Figure 1 represents a cloud of articles with different academic impact. These research data is expected to be related to oil market volume variables if they truly represent oil related knowledge. To gain the deepest level of data granularity in benefit of significant results, this paper segregates the research productivity in quarterly data. A more refined classification and higher frequency data would make the underlying mechanism stronger. Unfortunately, the journal’s issue publication date is often set at lower frequencies, thus, we are using the deepest in detail available publishing data (quarterly data) to ensure the most meaningful results, but acknowledge the implied limitations. Therefore, this work should be considered exploratory analysis to test how knowledge interacts with the market.
Metrics of Market Activity
To build up the variable assessing trading volumes we use a complete set of quarterly data of aggregate futures volumes (the total volume for all contract maturities available), obtained from Bloomberg, for the 2000 to 2020 data period. We compile the Intercontinental Exchange (ICE) Brent Crude and the Chicago Mercantile Exchange (NYMEX/CME) Crude Oil futures and options contracts.
Daily data on total futures volumes are converted into quarterly data by aggregating across contracts and days within a quarter.
Figure 2 illustrates the time series evolution of aggregate number of oil futures and options contracts traded in ICE and CME, showing an overall bullish trend that includes the deceleration in the 2010 to 2014 post crisis era and the unforeseen decline emerged in the COVID-19 Pandemic.

Time series evolution of aggregate number of oil futures and options contracts (in billion barrels) traded in ICE and CME.
The Evolution of Regulation and the Emergence of Exchange Traded Products
In this section, we address how the 2014 Volcker rule affected the negotiation in the financial markets.
Several major legislative responses were signed into law after the 2008 financial crisis. The Volcker rule was initially passed as Section 619 of the Dodd–Frank Wall Street Reform and Consumer Protection Act in July 2010. It represents the most significant constrain on banks activities since the Great Depression. It restricts banks from engaging in proprietary trading, including commodity futures trading, if it is not for market making or to facilitate client positions. While it was supposed to be implemented in July 2010, it was finally concluded in December 2013. It became effective in April 2014 although its full implementation was delayed until July 2015 (see Allahrakha et al., 2019). Consequently, several banks partially or totally closed their proprietary trading business.
This stronger regulation could be expected to have a negative effect on market activity. Nonetheless, as depicted in Figure 2 and in opposition to other markets such as the Credit Default Swap (CDS) market, the oil derivatives trading activity did not decrease. Although many big players killed off some trading operations, pulled money from certain investment funds, and ceased other activities that would conflict with the rule’s restrictions, the overall volumes in oil futures market did not deteriorate due, among others, to the increasing popularity of the Exchange Traded Products (ETPs). The ETPs market became a good alternative for commodity investors and kept the activity in the futures market at high levels since first introduced in 2004 in the U.S. (State Street’s SPDR Gold Trust v, issued on November 12).
According to the International Financial Law Review (IFLR) of February 2014 the Volcker rule prohibits a banking entity from participating in proprietary trading with financial instruments (subject to certain exceptions) such as commodity derivatives. It also prohibits it from acquiring covered funds, but in this case, they do not include registered investment companies (e.g., mutual funds, registered closed-end funds and Exchange Traded Funds -ETFs-). Therefore, the new regulatory environment after the 2008 to 2009 financial crisis made institutional investors use ETPs as substitute for derivatives trading (see Lettau & Madhavan, 2018). This was also encouraged by the inclusion of mandatory central clearing provisions in the Dodd-Frank Act forcing counterparties to use exchange-traded derivatives or to clear Over the Counter (OTC) transactions through a central counterparty-clearing house (CCP). Consequently, the ETFs commodity trading volume reached 40% of total commodity trading in 2013. This is explained by the combination of the following events, which contributed to the surge of the passive investment vehicles to a $5 trillion industry as of the end of April 2018 (according to independent ETF and ETP research and consultancy firm ETFGI): (i) banks were forced to shed large inventories to bolster their balance sheets, (ii) retail investors were looking for risk diversification alternatives, (iii) hedge funds, pension plans and insurers were searching for more efficient commodity trading, (iv) ETPs lower fees, tax-efficiency, intra-day-market-liquidity, and full transparency.
Since ETPs’ need to be synchronized with the price of the underlying portfolio, trading activity in these assets translate to the underlying securities negotiation (in many cases, commodity futures, as relatively few such products gain their exposure by holding physical commodities that cannot be stored or involve high marginal storage costs). Furthermore, due to the maturity term of the futures used for the construction of these exchangeable trade funds, the continuous rollover of the positions implies the permanent trading of these contracts (Rondinone & Thomasz, 2016).
The overall result is that while the Volcker rule lowered long term volumes in general derivatives trading, the oil futures activity kept stable during the 2010 to 2014 “pre Volcker rule” period (as classified in Allahrakha et al., 2019) and returned to its bullish trend during the “post Volcker rule” era, until the oil price shock emerged in the COVID-19 Pandemic (futures and options volumes halved between 2020Q1 to 2020Q3 as shown in Figure 2).
Bearing in mind all these considerations, and since the stronger regulation arose partly due to the ongoing policy debate in academic papers, we expect our publications variable to have a stronger effect in the aftermath of the GFC and find important to investigate empirically the sign of the impact of publications on trading activity.
Methodology
We use the cointegration approach to analyze the long-term relationship between the publications and the trading volume variables. The purpose is to examine whether publications explain oil future traded volume changes and vice versa. Under the presence of non stationary variables, we test whether there is a long run linear combination between the variables that is stationary. The finding of cointegration implies that market volumes and publications are integrated together in a way that they cannot move away from a long-term equilibrium relationship.
Let Pubt be the total number of publications in the crude oil market in time t. Let Volt be the level of market activity in the given market. We assume that both variables are related in the long run as academics follow the markets in order to address in their research the relevant questions. Academics also require liquid markets for reliable data. Additionally, policymakers follow the academic debate and regulate using solutions offered by research papers. Consequently, we expect volumes traded in the derivatives oil market to govern the price discovery process, and therefore, the cointegrating error is represented as:

If both variables are cointegrated, they can be represented by means of the following error correction model,


In order for the VECM to be well defined, the following conditions should be satisfied:
I. If α1 and α2 are both statistically significant, they must have opposite signs, as predicted by the theoretical result in (2). This implies that, if there is a change in the equilibrium error, so that for instance Pubt is greater than its replicating long term level (zt > 0), then Pubt is expected to fall in the next period while Volt should increase in order to restore equilibrium. In this case, α1 will be negative and α2 positive. If only one parameter is statistically significant, the related variable will restore equilibrium.
II. If zt >0 and the publication variable was contributing significantly to price discovery, α1 will be negative and statistically significant as Pubt adjusts to incorporate new information. Similarly, if the market-trading variable were important for price discovery, then α2 would be positive and statistically significant. If both coefficients are significant then both variables contribute to price discovery. The existence of cointegration means that at least one variable has to restore long run equilibrium, implying that the given market is short term inefficient. If the adjustment of both prices is immediate and independent of the cointegrating error (α1 = α2 = 0) there is no VECM and no price discovery.
III. In the VECM framework, Volt and Pubt variables are modeled to converge to each other to restore equilibrium. The adjustment coefficients (α1 and α2) measure the speed by which Volt and Pubt adjust to long run equilibrium. This is slow when the parameter is close to 0, and fast when it is close to 1. In the case where α1is different from zero and α2 = 0 the trading activity variable Volt does not adjust to the publishing activity Pubt as it is essentially the common factor or efficient price.
Empirical Estimation
In this section, we analyze the relationship between the trading process and the publication activity for the whole sample by means of a cointegration framework. By doing so, we use an alternative approach to the oil market broadening the boundaries of research with new methods and different types of data, as requested by part of the Academia (see Brooks et al., 2019, and Gippel, 2015, among others).
At this point, it is important to note that we are essentially working with the lower bound of the publication variable in terms of information discovery. This is because papers are available online well before their formal publication date, which is used for the construction of our publication variable. This variable is however easy to identify and consistent with McLean and Pontiff (2016) who acknowledge that the publication date provides only a proxy for when market participants learn about a predictor.
Figure 3 shows the time series evolution of the number of papers published in the oil market jointly with the aggregate number of futures and options traded on both the ICE and CME markets, measured in billion barrels. We can see that both variables evolve very closely suggesting that there might be cointegrated.

Time series evolution of total volumes traded in the oil futures and option markets (CME and ICE) versus the total number of oil publications (units).
In what follows, we measure trading activity using two quarterly metrics (i) aggregate futures contracts traded in ICE and CME. These are aggregated taking into account the 1,000 barrels contract multiplier. We use the log of this variable, which is denoted as the futures volume variable Volft. The second metric we use to measure market activity is (ii) the log of aggregated futures and options contracts traded in the two exchanges Volfot. This adds to the aggregate number of oil futures contracts traded in the market the aggregate number of futures underlying the oil options contracts traded. Option markets are important because of their forward-looking nature. Their prices provide a measure of investor’s expectations about future market conditions.
In order to measure publishing activity, we add the number of publications containing the word “oil” in the tittle in each quarter. The total number of publications is denoted as Pubt.
For the purpose of establishing the empirical relationship between the two variables, we perform a cointegration analysis between (Volft–Pubt) and (Volfot–Pubt) and model the interaction between both series by means of a VECM model. The underlying presumption is that both pairs measure a common factor, which is the relevance of the crude oil market, and that academic publications are a crucial component of the development of the oil market activity.
Cointegration and Granger Causality techniques have extensively been used in the energy related literature to model long term and short-term dynamics between two integrated variables (e.g., Belke et al., 2011, and references therein using cointegration to test the energy consumption-growth nexus). This literature acknowledges the presence of non-stationarity in the data and performs cointegration analysis based on the Engle and Granger (1987) two-step procedure to test for cointegration and to estimate VECM models (the energy consumption-growth nexus has also used multivariate estimators such as Johansen (1991) and more recently, panel-econometric methods, to test for unit roots, and cointegration relations). Additional examples of the application of the Engle–Granger approach within the energy consumption and growth literature include Jumbe (2004) and Belloumi (2009). Note that, as it is the case in this study, this literature relies on low frequency data.
Because we analyze the long-term behavior of two variables we concentrate on the Engle-Granger two-stage test (see Engle & Granger, 1987). The underlying requirement is that both the publishing process and trading activity are non-stationary or I(1). Hence any equilibrium between these variables requires that the error term in equation (1) (zt) is stationary. This will ensure that the two variables will only deviate temporarily from the equilibrium path. Therefore, we first perform a unit root test on the log level series. In case of evidence of non-stationarity in the paired variables, we then perform the same test on the residuals. Augmented Dickey Fuller test results are reported in Table 1 for the publication variable Pubt and for the two metrics of market activity Volft and Volfot. We find that the three variables exhibit unit roots and we thus proceed to test for cointegration by performing the unit root test on the residuals series (z1, t and z2) of the paired variables Volft–Pubt and Volfot.–Pubt. Results reported in Table 2 show that both residual series are stationary implying that the paired variables share a common underlying trend.
Augmented Dickey Fuller Test: Crude oil Market.

Note. This table shows Augmented Dickey Fuller test statistics for the null hypothesis of unit roots on the level (and first differenced) series (Volft, Pubt, and Volfot) for quarterly data covering the 2000 to 2020 period in the crude oil market. MacKinnon (1991) one-sided critical values are used. The BIC criteria is applied to calculate the optimal lag length.
Augmented Dickey Fuller Test on Residuals Series.

Note. This table shows Augmented Dickey Fuller test statistics for the null hypothesis of unit roots on the residual series z1,t and z2,t. The former (z1,t ) is the residual for the OLS regression for the number of oil publications (Pubt) on the oil futures volumes (Volt) while the later (z2,t) is the residual between the number of publications and the futures and options variable (Volfot). Quarterly data is used covering the 2000 to 2020 period in the crude oil market. MacKinnon (1991) one-sided critical values are used. The AIC criteria is applied to calculate the optimal lag length.
Reported results suggest that there is cointegration between the pairs (Volft–Pubt) and (Volfot–Pubt), so that we proceed to estimate the corresponding VECM in Table 3.
Lead-Lag Analysis With Two-Dimensional VECM Model in the Crude Oil Market With Quarterly Data Covering the 2000 to 2020 period.

represents significance at the 5% level.
Results reported in Table 3 show that α1 is statistically significant while α2 is not significantly different from zero. As before, the Pubt variable does all the adjustment in terms of restoring the cointegrating equilibrium while the Volft (and Volfot) variable does not react to shocks in the long term relationship. This is consistent with the finding of informational leadership in the market activity variable. Indeed, the volumes variable is long and short term efficient (note that the efficiency of the volume variable is also reflected in a negative R2). The improved forecasting ability of the cointegrating error in the publications’ equation is reflected in the R2 (.307–.400) which is significantly higher than that reported in the volumes’ equation. VECM results show that predictability is slightly improved under the use of the futures and options volume metric of market activity as more information of trading activity is incorporated.
We check the statistical validity of our estimations by performing stability tests and analyzing the residuals of the VECM system. The stability of the VECM system is analyzed by calculating the inverse roots of the AR characteristic polynomial. Estimated results reported in Figures 1 and 2 in Appendix B show that all the roots lie inside the unit circle.
Our results therefore suggest that over the 2000 to 2020 period trading activity can be regarded as leading the publishing activity, which implies that the number of academic papers in the crude oil market exhibits a long term relationship with futures and futures and options market traded volumes. The leading nature of the market activity variable may be enhanced by the fact that the publication variable is based on the publication date while market participants may learn about the publication at earlier stages.
Lead Lag Relationship Before and After the GFC and After the 2014 Regulation Change and Crude Oil Price Collapse
In this section, we deepen our understanding of the learning process in the oil market by analyzing the relationship between market activity and academic publishing metrics within three subperiods. We consider for this purpose the 2008 boom and bust episodes and the post GFC recovery, which has sparked interest among academics and policymakers. We also analyze the moment in which the Volcker rule becomes effective during the April 2014-July 2015 transition period (see Allahrakha et al., 2019); that is, the final rule is effective April 1, 2014, but the compliance period during which banking entities must conform their activities to the Volcker rule was extended for 1 year until July 21, 2015. This later period is of great importance as it also sees the collapse of the crude oil price during the last quarter of 2014. Both oil price shocks documented in 2008 and 2014 have been extensively addressed in the literature. Baumeister and Hamilton (2019) and Figuerola-Ferretti et al. (2020) conclude that the 2008 oil shock was demand driven while the 2014 crash emerged under excess supply conditions. Furthermore, Figuerola-Ferretti et al. (2020) associate the 2014 supply shock with OPEC’s announcement in November 2014. This has been recently addressed by Lu et al. (2021) as a structural break when modeling the relationship between WTI crude oil and Chinese stock index futures.
We contend that both, market practitioners and policymakers, were highly concerned about both episodes. While the underlying presumption under the 2008 event was the excessive speculation driving the rise and collapse in commodity prices (see, e.g, Masters, 2008; Soros, 2008; US Senate Permanent Subcommittee on Investigations, 2006), the 2014 crude oil price crash coincided with the final implementation of the Volcker rule and the start of the US Fed tapering process (see Figuerola-Ferretti & Cervera, 2018).
Thus, in what follows, we look at the relationship between the variables under study (Volft, Volft, and Pubt) incorporating the 2008 and 2014 events, as well as the regulatory changes arisen in the aftermath of the GFC, to account jointly for the effects of the 2008 oil price crash, the 2014 to 2015 regulation changes and the development of new commodity investment vehicles, widely discussed in the financialization literature.
Subsample I from 2000Q1 to 2009 Q2: Loose regulation, first oil price shock and synchronous development of the GFC.
Subsample II from 2009Q3 to 2014 Q4: The aftermath of the GFC and introduction of regulatory changes.
Subsample III from 2015Q1 to 2020 Q4: The aftermath of the second oil price shock and implemtation of the Volcker rule.
Our hypothesis is that the effect of regulation on market activity is negative and arises partly due to the policy discussion in academic papers. This is because The Dodd–Frank Wall Street Reform and Consumer Protection Act in 2010 and the final implementation of the Volcker rule in 2014 restricted derivatives trading activity. However, the commodities market financialization and the proliferation of ETPs enhanced trading volumes. We expect the publication variable to have a stronger effect in the aftermath of the GFC in response to both mayor events (the 2010 Dodd–Frank Act and the 2014 Volcker rule). We find important to investigate empirically the sign of the effect of publications on trading activity to optimize the impact of regulation (see Baily et al., 2017).
Because there are not sufficient observations for a cointegration analysis under the three sub-samples, we analyze the lead lag relationship between both variables using the Granger causality tests (see Granger, 1969). The variable Volft (or Volfot) will Granger–Cause our second variable Pubt if knowledge of the history of Volft, (or Volfot) contributes to the prediction of Pubt, and vice-versa. This test is implemented by regression of Pubt on lagged values of itself and Volft, (or Volfot) under the crude oil case.
We therefore consider the following VAR model:
The VAR model for the market activity variable that includes options as well as futures volumes will use Volfot instead of Volft.
The test is then the standard Wald exclusion test on the lag distribution of Volft (or Volfot). To check the null hypothesis that changes in Volft (or Volfot) do not Granger–cause changes in Pubt we formulate:

In order to check the hypothesis that changes in Pubt do not Granger–Cause changes in Volft we formulate:

The equivalent test is performed for Volfot.
Results are reported in Table 4.
Granger Causality Test Crude oil Market.
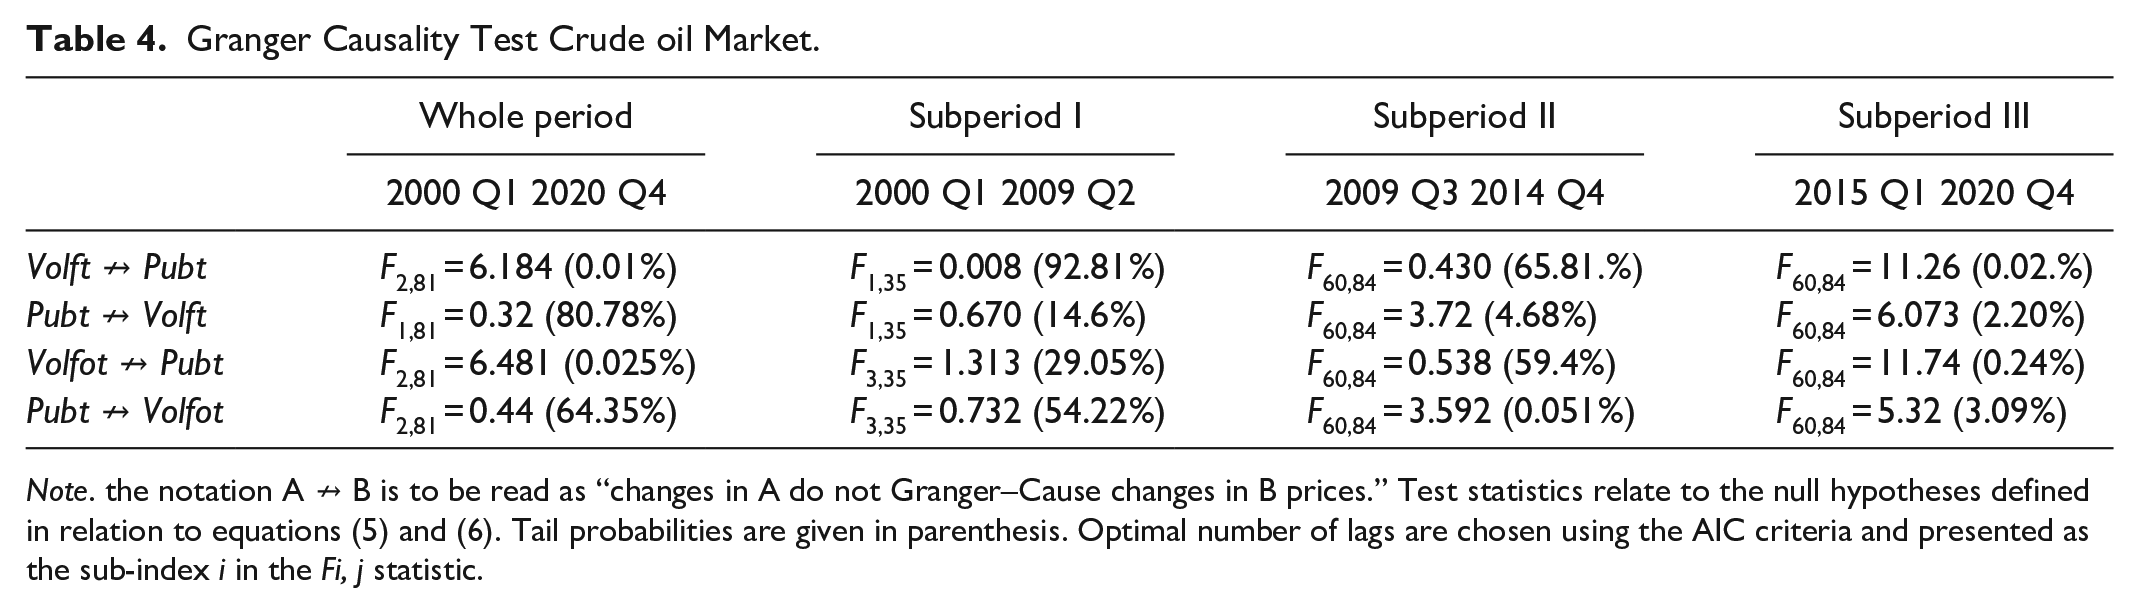
Note. the notation A ↛ B is to be read as “changes in A do not Granger–Cause changes in B prices.” Test statistics relate to the null hypotheses defined in relation to equations (5) and (6). Tail probabilities are given in parenthesis. Optimal number of lags are chosen using the AIC criteria and presented as the sub-index i in the Fi, j statistic.
Here again it is important to note that we are essentially working the issue of the publications, and therefore the quarter assigned to the articles in the journals. However, manuscripts are usually available via the online service well before the last and definitive publication. Therefore, the possible influence of research in market activity is probably higher (as it starts earlier).
The first column in Table 4 reports results for the whole sample and shows causality from the volumes to the publication variable offering conclusions consistent with the price discovery analysis. Test results reported in the second column show that in Subperiod I, volumes traded in futures markets and the publishing activity in the crude oil market can be regarded as being independent. This may imply that the data do not show sufficient variability to establish the directions in which price changes affected each other. By contrast, results for Subperiod II show that the publication activity Granger Causes market activity under both the aggregate futures volumes and aggregate futures and options volumes. This period illustrates the process by which regulators analyze academic publications in making their decisions. In Subperiod III, there is Granger Causality from publications to volumes at the 5% significance level and Granger Causality from volumes to publications at the 1% significance level. It is important to note at this point that the results reported in Table 4 should be interpreted with caution due to the low number of observations used in the analysis.
In order to quantify the net effect of publications on trading activity we reconsider the whole sample period and estimate OLS regressions with two separate dummies controlling for the 2008 and 2014 shocks documented in the literature. This framework follows the spirit of the VAR threshold autoregressive models (see Gonzalo & Pitarakis, 2002).
While the first dummy accounts for the GFC, the later dummy controls for the crude oil price collapse as well as for the implementation of the Volcker rule. Estimations are performed for each dummy separately. We let d1 be a dummy variable that takes the value of 1 in the aftermath of the GFC (2009 Q3), while d2 is a dummy that takes the value of 1 in the aftermath of the 2014 crude oil price collapse and in the midpoint of the Volcker rule implementation period. Results are shown in Tables 5 and 6.
The effect of publication activity on trading activity in the 2000 to 2020 period. Consideration of the GFC dummy.

The Effect of Publication Activity on Trading Activity in the 2000 to 2020 Period. Consideration of the 2014 dummy.
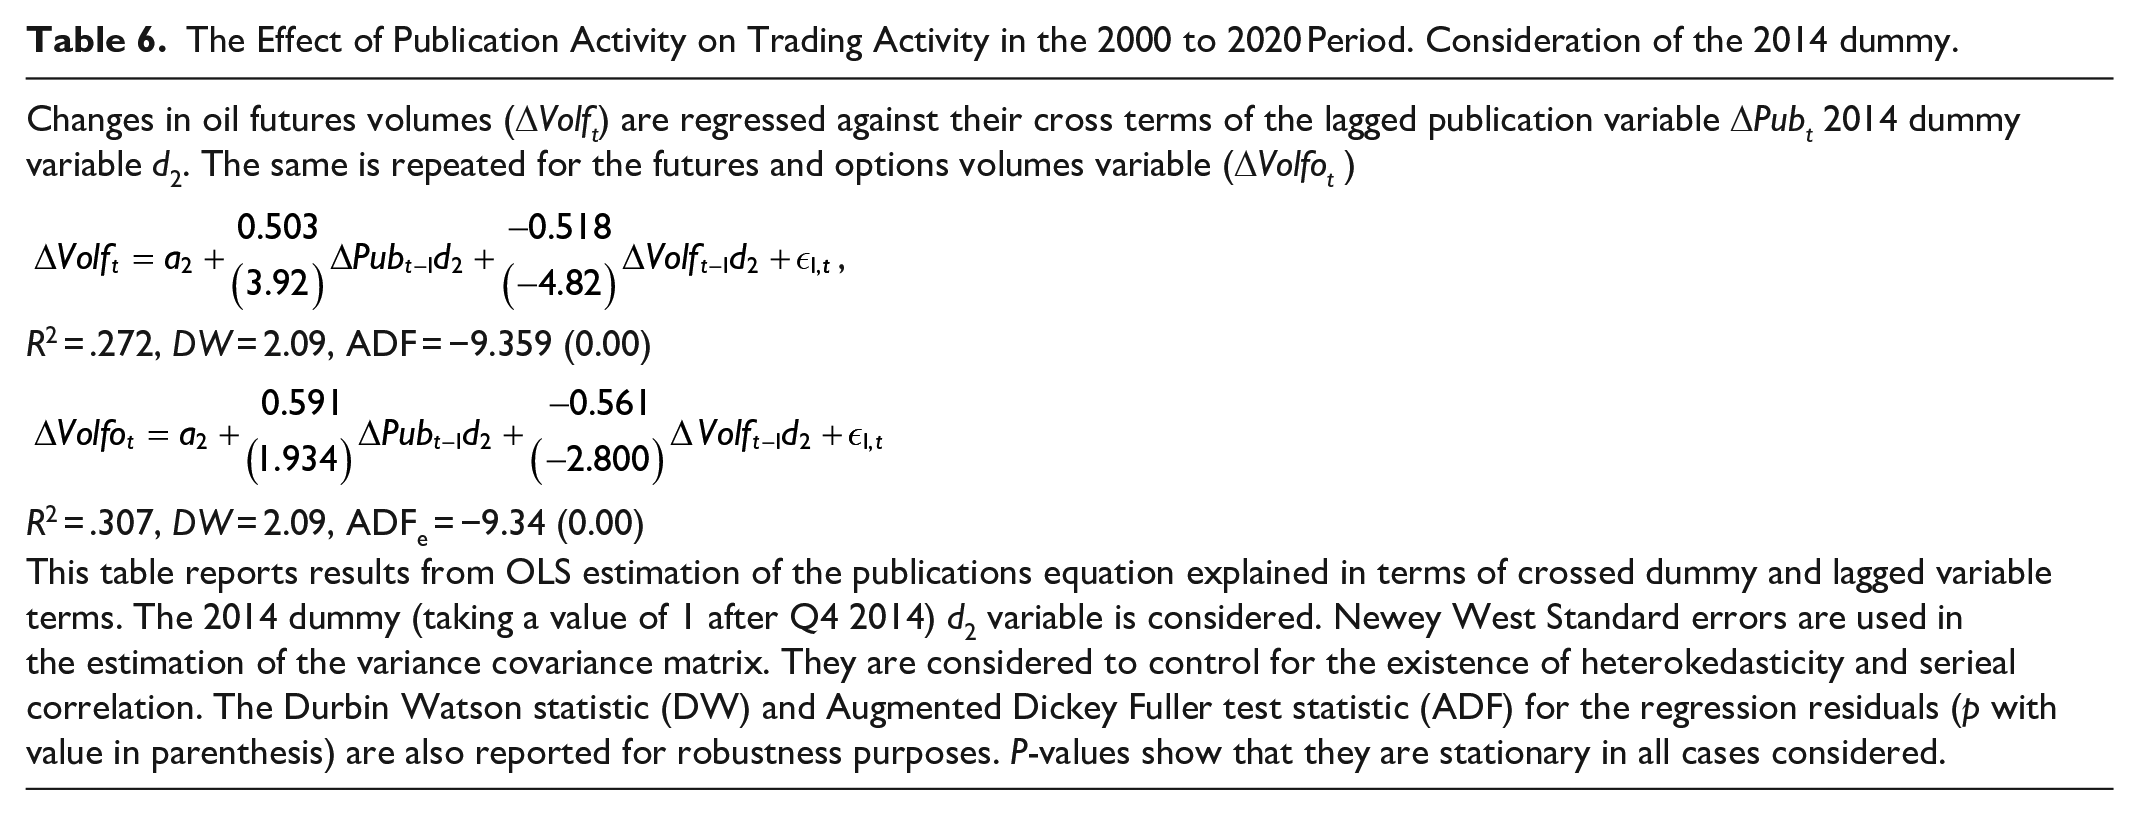
Reported results in Tables 5 and 6 demonstrate that the effect of the crossed dummy- publications variable is positively related to the two metrics of the volumes variable. However while the effect is positive and significant for the post 2014 Q4 dummy, it is positive but not significant for the GFC dummy. This implies that the raise in high-quality peer-reviewed publications in the aftermath of 2014 lead to increased volumes in the derivatives oil market.
We contend that the research published regarding the risks of over-the-counter positions (OTC) enhances commodity futures exchange (and thus ETFs) trading as opposed to bilateral trading. Indeed, in the aftermath of 2014, most financial regulators had shifted their policy to a new business paradigm for banks and related institutions (see Allahrakha et al., 2019).
Conclusions
In this paper, we analyze the interaction between changes in academic publications and trading activity within the oil market. Our motivation is driven by the recent literature that documents the massive interest in oil market research that emerged in the aftermath of the GFC (see Smyth & Narayan, 2018) and researchers calling for the monitorization of efficient implementation of new regulation (e.g., Baily et al., 2017). We consider for this purpose the impact of regulatory processes that arose between the 2008 GFC and the 2014 crude oil price collapse.
We work under the presumption that academic papers use market information to establish short and long-term dynamics that contribute to a better understanding of the financial markets and the global economy. We investigate the relationship between research publications and trading volumes in the oil market in an effort to establish the way in which knowledge feeds back into market activity and vice versa.
Our findings can be summarized as follows:
There is a strong relationship between market activity and the number of publications in the oil market. We show that during the 2000 to 2020 period, both variables are cointegrated. Trading activity is identified as the leading variable.
Granger Causality tests are considered over different subsamples motivated by the regulation changes that emerge between the 2008 and 2014 episodes. Our results show that, while the publication activity variable Granger–Causes aggregated volumes traded between the aftermath of the GFC and the 2014 negative crude oil price shock, Granger Causality runs in both directions after 2014 under the collapse of the crude oil price and the final implementation of the Volcker rule.
In an effort to establish the sign of the effect of publications on the volumes variable, we run separate OLS regressions considering post crisis dummies. Regression results show that higher number of publications lead to higher aggregate crude oil volumes traded. Moreover, the lagged publication variable is more important in explaining volumes when considering the post 2014 dummy. Our results therefore suggest that the interaction of the crude oil price shock and the Volcker rule implementation played a highly important role in explaining the oil aggregate volumes variable. While the 2014 oil episode has been addressed in the literature (see Baumeister & Hamilton, 2019; Figuerola-Ferretti et al., 2020), this is the first paper that considers the impact of the implementation of the Volker rule in crude oil futures trading.
By identifying the role of academic publications in causing oil futures volumes, we also show how knowledge picked from academic research was used to innovate as a reaction to the stricter regulation on proprietary trading for banks, introduced in the aftermath of the GFC. The surge of ETPs was the result of this market innovation. Trading volumes on oil derivatives increased along with further research published on oil. Hence, we construct the association of knowledge with market activity that leads to the emergence of innovation and a set of new Exchange Traded Products.
Reported results are important for policy makers and market practitioners, who should be monitoring the interaction of publishing and trading activity to improve the resource allocation and product innovation process. We encourage further investigation to deepen into the impact of academic research on financial assets trading at the aggregate level.
Supplemental Material
sj-docx-2-sgo-10.1177_21582440211068491 – Supplemental material for Building Knowledge in the Oil Market
Supplemental material, sj-docx-2-sgo-10.1177_21582440211068491 for Building Knowledge in the Oil Market by Karin Martín-Bujack, Isabel Figuerola-Ferretti, Teresa Corzo and Ioannis Paraskevopoulos in SAGE Open
Supplemental Material
sj-docx-3-sgo-10.1177_21582440211068491 – Supplemental material for Building Knowledge in the Oil Market
Supplemental material, sj-docx-3-sgo-10.1177_21582440211068491 for Building Knowledge in the Oil Market by Karin Martín-Bujack, Isabel Figuerola-Ferretti, Teresa Corzo and Ioannis Paraskevopoulos in SAGE Open
Supplemental Material
sj-xlsx-1-sgo-10.1177_21582440211068491 – Supplemental material for Building Knowledge in the Oil Market
Supplemental material, sj-xlsx-1-sgo-10.1177_21582440211068491 for Building Knowledge in the Oil Market by Karin Martín-Bujack, Isabel Figuerola-Ferretti, Teresa Corzo and Ioannis Paraskevopoulos in SAGE Open
Footnotes
Acknowledgements
We thank William Rebolledo and Paloma Boves for assistance in data collection. Helpful comments in various stages of the paper’s development were provided by conference participants at the Commodity Markets and Management Association, Pittsburgh, 2016; Financial Forum, Madrid, 2019; Computational and Financial Econometrics, London, 2019.
Authors’ Note
Ioannis Paraskevopoulos now affiliated to Capital Markets, Bankia and ICADE Spain.
Declaration of Conflicting Interests
The author(s) declared no potential conflicts of interest with respect to the research, authorship, and/or publication of this article.
Funding
The author(s) disclosed receipt of the following financial support for the research, authorship, and/or publication of this article: Isabel Figuerola-Ferretti thanks the Spanish Ministry of Education and Science MCIN/AEI/10.13039/501100011033 for support under the grant PID2019-104960GB-100, and the internal project of the Universidad Pontificia de Comillas Financial Markets and Sustainable Finance. Teresa Corzo would like to thank Universidad Pontificia Comillas for their funding.
Supplemental Material
Supplemental material for this article is available online.
References
Supplementary Material
Please find the following supplemental material available below.
For Open Access articles published under a Creative Commons License, all supplemental material carries the same license as the article it is associated with.
For non-Open Access articles published, all supplemental material carries a non-exclusive license, and permission requests for re-use of supplemental material or any part of supplemental material shall be sent directly to the copyright owner as specified in the copyright notice associated with the article.