
Abstract
The adoption of blended mode of e-learning is dominant basically because of the affordances of the combination of both the benefits of online and face-to-face sessions. In view of this, most traditional distance education institutions have acquired Learning Management System (LMS) for online learning to support the face-to-face aspect of lesson delivery to satisfy the blended mode. This has induced research into the acceptance of blended learning from both tutors’ and students’ perspectives. However, the gap in the literature is that, most of these researches employ instruments that measure only the LMS-based online aspect or the technology of the blended mode leaving the face-to-face aspect relegated. To fill the gap, data were collected from 267 tutors based on a cross-sectional survey design with the questionnaire as the instrument. The result was a development and validation through a partial least squares structural equation modeling of a Blended Learning Acceptance Scale (BLAS) that combines both LMS-based online learning and face-to-face aspects to measure blended learning acceptance in distance higher education.
Introduction
The distance education mode of learning has been in existence for over three generations (Aoki, 2012; Bervell, 2018; Bervell & Umar, 2018; Siemens et al., 2015). Its major initial characteristic was print-based correspondence (Aoki, 2012; Bervell, 2018; Bervell & Umar, 2018; Siemens et al., 2015). However, according to Bervell (2018), this initial print-based technology mode of distance education was beset with the absence of two-way communication or interaction, that is “instructor to student” and “student to student” which forms the hub of every effective instructional process, advocated by educational learning theories. (p. 1)
As a result of the above short-fall, the word “distance” in the concept of “distance education” was very clear (Bervell, 2018). Siemens et al. (2015) are of the view that the correspondence stage of distance education marked its “dark ages” (Bervell, 2018).
Subsequently, technological advancements sparked the improvement of education in general and specifically, the delivery of distance education (Anderson et al., 2011; Bervell, 2018). Especially in this 21st century that has a revolution of technology in education, the term “distance” is no more literary but a metaphor (Bervell, 2018). This is because, information communication technologies (most particularly the internet) have provided a solution to the earlier gap existing between the “distance instructor” and the “distance student” (Aoki, 2012; Bervell, 2018; Siemens et al., 2015). According to Chien (1999), modern technologies have dramatically advanced the means to collect, store, and organize information in digital forms of all kinds—data, text, images, motion video, sound, and integrated media—and made it available and sharable for searching, retrieval, and processing via high-performance communication networks in ways that transcend distance and time. (Bervell, 2018, p. 1)
Rainie (2010) indicated that the widespread usage of smart devices, internet, and the continuing technology cost reduction, personal computers, smart phones, iPads, global positioning systems (GPS), online group workspaces, simulations, and so on have provided a major contribution toward the redefinition of the nature of distance education with respect to its contemporary teaching and learning experiences (Bervell, 2018). Admittedly, modern technologies have become an anchor for distance education by providing for feasibility and interactivity between instructors and learners while creating an effective community of learning (Bervell, 2018; Ntumy-Coleman, 2011). A classic example of these technologies is the Learning Management System (LMS) which has introduced forms of learning such as e-learning in distance education which could be purely online or blended with face-to-face (Bervell, 2018).
This LMS technology has been widely adopted across the globe by higher educational institutions for delivering instruction to students either “in situ” or across distributed locations beyond the confines of the local institutions (Bervell, 2018; Naveh et al., 2012). Currently, a popular trend in most institutions is the use of LMS to either supplement or augment traditional face-to-face sessions outside the classroom and this reflects the blended mode of learning where instructors provide access to their developed learning materials (either video, audio, interactive manual, portable document formats, etc.) and share them digitally with students (Bervell, 2018; Busaidi, 2012; Dutta et al., 2013). The blended learning mode seems to have an advantage due to the fact that it complements both the offline (face-to-face) and online learning modes by eradicating their weaknesses (Bernard et al., 2014; Bervell, 2018; Means et al., 2013; Siemens et al., 2015).
Garrison and Kanuka (2004) defined blended learning as “the thoughtful integration of classroom face to face learning experiences with online learning experiences” (p. 96, as cited in Bervell & Arkorful, 2020; Hrastinski, 2019). Subsequently, Graham (2006) expanded the definition of blended learning to be “blended learning systems combine face-to-face instruction with computer-mediated instruction” (p. 5, as cited in Hrastinski, 2019). The above definitions have been the most popular and cited more than 2,149 and 3,116 times, respectively (Hrastinski, 2019, p. 2). This means that to blend goes beyond the mere technology but rather on how it can be effectively used online to tailor around offline pedagogies. Thus, extensive use of LMS for blended learning across institutions should be hinged on how the features and tools in the systems are utilized and how information is shared and interactivity provided to promote the blended model (Bervell, 2018; Cigdem & Topcu, 2013; Zhang et al., 2014). These are crucial if course and knowledge management are to be effective and sustained (Bervell, 2018; Cigdem & Topcu, 2013; Zhang et al., 2014). Literature by Bervell (2018), Wang and Wang (2009) as well as Park (2009) provide empirical evidence that many institutions using the bended mode to deliver courses are beset with enormous hitches. As a result, there is an imbalance between the rising expectation and need to use LMS to provide blended learning experiences and the actual number of instructors who are adopting LMS to promote blended learning (Bervell, 2018; Park, 2009). According to Bervell and Umar (2018) and Mtebe (2015), the failure by higher educational institutions in the use of LMS to achieve blended learning goals is attributable to the hesitation of instructors or lecturers to accept and use the system effectively to achieve the aims of the implementing institutions. This is because, these instructors are pivotal in LMS-related blended learning implementation as they are described by Bervell (2018) as the direct “utilizers” and “promoters.” On the contrary, many higher educational institutions merely implement LMS-based blended learning without investigating into the acceptance orientations and its related factors on the part of instructors or lecturers who will use this technology-related andragogy to effectively facilitate blended instruction (Bervell, 2018; Bervell & Umar, 2018). In view of this, there has been a recent rise in blended learning acceptance studies (Ain et al., 2015; Bervell & Umar, 2018). However, a major flaw in available instruments that measure blended learning acceptance (Al-alak & Alnawas, 2011; Birch & Irvine, 2009; Butler, 2010; Evans & Le Roux, 2015; Khechine et al., 2014; Park et al., 2012; Teo, 2008; Venkatesh et al., 2003) omit the face-to-face component and only assess the online system–based learning acceptance. However, there is a contrast between purely online learning and blended learning (Burns, 2011; Siemens et al., 2015). This has necessitated the development of a modified scale that can aptly measure blended learning acceptance. Consequently, the current study incorporates the face-to-face aspect into a modified questionnaire on online learning system acceptance to adequately measure the acceptance of the blended mode in a traditional face-to-face-based distance education. Hence, the development and validation of a Blended Learning Acceptance Scale (BLAS). On this basis, the study is anchored on the following research questions:
Literature Review
Within the literature on blended learning acceptance, two key categories of factors are inherent. These are system usage–related factors (performance expectancy, effort expectancy, social influence, and facilitating conditions) by Venkatesh et al. (2003) and personality factors (attitude, previous experience, self-efficacy, and anxiety) by Bervell and Umar (2018).
Performance Expectancy
According to Bervell et al. (2020), the “construct Performance Expectancy is represented in other technology acceptance models as perceived usefulness (TAM/TAM 2/C-TAM-TPB), Extrinsic motivation (MM), Job fit (MPCU), Relative advantage (IDT) and Outcome expectancy (SCT)” (p. 4). Venkatesh et al. (2003) defined performance expectancy as “the degree to which an individual believes that using a system will enable him or her attain gains in job performance” (Bervell et al., 2020, p. 4). In their LMS studies in distance education, Bervell et al. (2020) indicated that performance expectancy implies the course tutors’ believe, that employing LMS-based online learning in combination with face-to-face will improve their delivery in distance andragogy. According to Venkatesh et al. (2003), individuals’ performance expectancy is the strongest predictor of their behavioral intention to adopt new technology (Bervell & Arkorful, 2020; Bervell & Umar, 2018; Kumar & Bervell, 2019). Empirical evidence on the effect of performance expectancy on behavioral intention in the use of webinars in a blended learning environment (Bervell et al., 2020) was provided by Khechine et al. (2014), and LMS-enabled blended learning by Ain et al. (2015) and Bervell and Umar (2017).
Effort Expectancy
From the perspectives of other technology acceptance models such as (TAM/TAM2/TAM3), effort expectancy (in Unified Theory of Acceptance and Use of Technology (UTAUT)) is termed perceived ease of use (Bervell, 2018). In LMS research in distance education, the variable is referenced as complexity (MPCU) and ease of use (IDT) and refers to “the degree to which course tutors believe that using LMS-based online instruction combined with face-to-face will be easier in their distance education instructional delivery” (Bervell et al., 2020, p. 4). When new technologies are introduced, they tend to arouse the cognitive and affective orientations of potential users on the easiness or difficulty nature in using these technologies for real job or task performance (Bervell et al., 2020). It is obvious that those who have been introduced to new technologies already have an affinity to their traditional ways of accomplishing tasks, and their related challenges have been surmounted over time with adjustments through copious usage. On the contrary, when novel technologies such as LMS are presented to tutors or instructors for online usage to compliment face-to-face interactions, there will be the need for them to re-strategize and handle the procedural changes that are associated with blended learning. Thus, distance education tutors’ perceptions on how easy or complex is the use of LMS to augment face-to-face and its related adjustments have a consequence on their acceptance decisions (Bervell et al., 2020). Hence, Venkatesh et al. (2003) opined that the perception of easiness or complexity tendencies of a system (in this context, LMS for blended learning) is stronger at the earlier stage of adoption both in mandatory and voluntary environments (Bervell et al., 2020). Earlier authors such as Lwoga and Komba (2014), Maina and Nzuki (2015), and Bervell and Umar (2017) have provided statistical evidence of effort expectancy influencing behavioral intention toward e-learning acceptance.
Social Influence
In technology acceptance studies, social influence “defines the effect or influences that other people who are seen to be of importance have on the decision of potential adopters to accept a new technology” (Bervell et al., 2020, p. 5). In the view of Venkatesh et al. (2012), social influence is the extent to which “consumers perceive those important others (e.g. family, friends etc.) believe they should use a particular technology” (p. 159; Bervell et al., 2020).
Within the TAM2/TRA/TPB/DTPB/C-TAM-TPB models, the exogenous variable is termed as subjective norm, but as social factor and image in MPCU and IDT models, respectively (Bervell et al., 2020; Bervell & Umar, 2017; Venkatesh et al., 2003).
The impact of referenced relevant others influence individual behavioral intention to accept LMS-enabled blended learning for distance education delivery (Bervell et al., 2020). This view was initially proven by studies such as Ain et al. (2015) and Bervell and Umar (2017) in blended learning acceptance as well as Kumar and Bervell (2019) in studies related to mobile learning acceptance. Hence, over-reliance of technological factors without recourse to social and behavioral concerns is detrimental to blended learning implementation (Tarhini et al., 2014). This is hinged on the premise that individuals or potential users of technologies live in a social system that influences their psychological behavior toward technologies (Bervell et al., 2020). Approval addiction of technologies among peers, family, and other social relations has been a conscious societal phenomenon. Persons in cliques find their identity and tend to associate with common ideologies, and this has been extended to technology use (Taiwo et al., 2012; Tarhini et al., 2014). In distance education research, Bervell et al. (2020) indicated that if tutors believe that their contemporaries prefer the use of LMS to support face-to-face and this makes them stand out as technological savvy and better achieve their distance education andragogical goals, they are likely to embrace LMS-supported blended learning. This makes social influence a critical factor in determining blended learning acceptance intentions in distance education.
Facilitating Conditions
According to Venkatesh et al. (2003), facilitating conditions is the “degree to which an individual believes an organizational and technical infrastructure exists to support use of the system” (p. 453). Bervell et al. (2020) defined the construct to be “the degree to which course tutors believe that there is the existence and availability of ICT infrastructure, technical support, institutional policy and enthusiastic leadership to support the use of LMS-enabled blended learning” (p. 5) The construct is also captured in other acceptance models such as TPB/DTPB, and C-TAM-TPB but rather termed as perceived behavioral control and in IDT as compatibility (Bervell et al., 2020). Contextually, we define facilitating conditions as the “readiness” and “accessibleness” of resources accompanying the use of LMS-enabled blended learning in distance education. It can be argued that each mode of teaching has its own accompanying resources and materials to foster effectiveness. Material resources and support required to promote quality traditional face-to-face interaction in distance education are totally different from technology-driven blended learning in distance education. This implies that the introduction of LMS-based blended learning requires a shift from the provision of traditional resources and support to tutors, to the provision of technology and human-related resources to support the blended initiative in distance education. Mtebe and Raisamo (2014) categorize these resources into administrative, leadership, ICT infrastructure, technical assistance, training, and institutional policies (Bervell et al., 2020). The provision of such resources has the tendency to induce a sense of both easiness and usefulness of LMS-related blended learning from the perspective of distance education tutors (Bervell & Umar, 2017; Mtebe & Raisamo, 2014). This feeling has a rippling positive effect on their acceptance intentions toward blended learning. To wit, when resources required by tutors to utilize blended learning are in place, they are well positioned to even try out the blended mode of instruction without coercion or “mandatoriness” (Bervell & Arkorful, 2020). In effect, the voluntary usage behavior provided by facilitating conditions positively determines their intentions to accept LMS-supported blended learning in distance education. Studies conducted by Ambali and Bakar (2014), Bervell and Umar (2017), and Nicholas-Omoregbe et al. (2017) found significant relationship between facilitating conditions and behavioral intention (Bervell, 2018). However, Khechine et al. (2014), Ain et al. (2015) as well as Jakkaew and Hemrungrote (2017) rather found a positive and significant relationship between facilitating conditions and use behavior consistent with earlier postulations by Venkatesh et al. (2012; as cited in Kumar & Bervell, 2019).
Attitude
Various authors such as Elias et al. (2012) and Kohnke et al. (2014) have defined attitude as “an evaluative judgement either favourable or unfavourable, that an individual possesses and directs towards an object” (Bervell, 2018, p. 114). In a related definition, Sparrow and Hurst (2010) was of the view that an individual’s overall affective reaction toward using a system represents his or her attitude toward a particular technology (Bervell, 2018; Venkatesh et al., 2003). However, within LMS use in distance education, Bervell (2018) stated that “attitude refers to tutors’ overall behavioural reaction (emotionally based) to accept LMS-based blended learning in distance education” (p. 114). According to Aizen and Fishbein (1980), “to predict a single behaviour, we have to assess the person’s attitude towards the behaviour and not his attitude towards the target at which the behaviour is directed” (p. 27; Bervell, 2018; Gasaymeh, 2009; Mtebe et al., 2016). Elaborating on the above statement, Bervell (2018) indicated that prior behavior leading to the final judgment on the actual end behavior performance will be determined by attitude which serves as a litmus test. This implies that the intentions of tutors to actually use LMS for blended learning purposes are dependent on their attitude and this could be favorable or unfavorable. Thus, the effect of attitude in predicting behavior could be positive or negative (Bervell, 2018; Thompson et al., 1991; Ajzen & Fishbein, 1980). Within technology acceptance literature and in particular e-learning technology research in higher education, empirical evidence suggest that attitude has been a strong determinant of behavioral intentions from the perspectives of both instructors and students (Bervell, 2018; Kohnke et al., 2014; Pavlou & Fygenson, 2006). These views have been reiterated by Mtebe et al. (2016), Mbengo (2014), and El-Gayar and Moran (2016) who have reported in their studies on the direct predictive effects of attitude of both teachers and students on their technology acceptance of e-learning for pedagogical practices (Bervell, 2018). Within distance education, the influence of attitude in predicting tutors’ behavioral intentions toward LMS for blended learning was empirically provided by Bervell and Umar (2018). From the above, there is a clear justification on the influence of attitude toward LMS-blended earning acceptance in distance higher education.
Self-Efficacy
The construct self-efficacy stems from the social-cognitive theory which was explicated by Bandura (1994) as the degree or amount of an individual’s belief in his or her own capability to execute a task and attain intended outcomes. This explains the belief in one’s own abilities in organizing and executing the series of actions needed to deal with potential circumstances or conditions (Bandura, 1994). In the technology milieu, Li (2010) shared the views of Compeau et al. (1999) who defined self-efficacy as the judgment of one’s ability to use technology to accomplish a particular task (Bervell & Umar, 2016). Within the context of this study, self-efficacy is defined as course tutors’ judgment of their ability to use LMS technology for distance education–blended mode delivery. Bandura identified the construct self-efficacy to have a significant influence on individuals’ intention to use a particular technology (Compeau & Higgins, 1995). Huang (2014) using the UTAUT model also proved in his research on acceptance of mobile learning that self-efficacy had a positive relationship with behavioral intention. A regression analysis by Lwoga and Komba (2014) showed that self-efficacy predicted behavioral intention. They further added that self-efficacy was a strong determinant of actual usage. This result was supported by El-Gayar and Moran (2016) who studied on online learning. The findings from structural equation modeling (SEM) analysis proved self-efficacy predicted behavioral intention, although weak. The above favorable results are also reported in the studies of Al-Haderi (2013) and Bervell and Umar (2018).
Anxiety
Anxiety is connected to the fear an individual portrays in relation to a specific task. In the technology acceptance domain, anxiety is defined as the degree of an individual’s apprehension or even fear when he or she is faced with the possibility of using computers (Bervell & Umar, 2016; Venkatesh et al., 2003). Within the confines of this study, anxiety is explained as course tutors’ nervousness toward the use of LMS-based online learning to support face-to-face. The presence of computer or technology anxiety has the tendency to formulate in course tutors a negative attitude toward LMS usage (Venkatesh, 2000). This negative attitude further affects adversely the use intentions toward LMS-enabled blended learning (Bervell & Umar, 2017). It is interesting to note that albeit the knowledge of the flexibility and efficiency LMS-based blended learning brings to the fore in distance education delivery in the 21st century, course tutors could be reluctant in opting for this technology underpinned by lack of confidence and uneasiness toward the usage of computers and accompanying technologies. Considerable reduction of computer technology anxiety promotes confidence and renders tutors comfortable in embracing LMS-related blended learning. In recent times, computer anxiety has appeared in the literature as a substantial component for instructor LMS acceptance. For instance, studies by Olatubosun et al. (2014), Al-alak and Alnawas (2011), Oye et al. (2012), and Bervell and Umar (2019) confirmed that anxiety predicted faculty behavioral intention to use e-learning systems.
Experience
Experience represents a personality construct that references the accumulation of skill, practice, or familiarity with the usage of a particular object, thing, or entity by an individual over time (Bervell & Umar, 2016). A criticism of the experience factor in the UTAUT model is the lack of operational definition that was not provided. This view is supported by Smet et al. (2012) who cited Sun and Zhang (2006) that there is the need to operationalize the definition of experience in the professional knowledge domain. In the technology domain, Willis (2008) defined experience as “the amount of exposure that a user has had to a given technology” (p. 18). Surej (2015) also cites Ball and Levy (2008) who explain computer experience as “an individual’s exposure to using computers and the skills and abilities he or she gains through using computers” (p. 7.). Experience with the use of technology may as well comprise an individual’s habit, skill, and/or simply exposure to the intended or similar technology and not necessarily an extensive usage (Thompson et al., 2006). Echeng et al. (2013); and Smet et al. (2012) found that the previous experiences of secondary school teachers had a positive influence on their LMS-related online learning acceptance intentions. The two constructs, experience and behavioral intention, are positively correlated and the former predicted the latter. Similarly, Ling and Muuk (2015) studied the acceptance of instructors toward LMS-based blended learning implementation and his results indicated a strong relationship between previous experience and LMS-based online learning implementation. The above result is in congruence with that of Bervell and Umar (2018) who found that course tutors’ previous technology experience with similar e-learning technologies for blended learning activities had an influence on their blended learning acceptance.
Voluntariness
Relatedly, the usage pattern of technology, with respect to how frequent, regular, or copious, is dependent on the nature of the performance condition (Bervell, 2018). The above supposition is articulated based on the statement by Donaldson (2011) that “the more instructors or students are required to use technology devices for pedagogy, the more they will use it” (Bervell, 2018, p. 151). This fact reveals the level of voluntariness or otherwise in terms of usage of technologies for pedagogical purposes (Williams, 2009). Venkatesh et al. (2003) indicated that varying usage and acceptance of systems are inherent in the amount of mandatoriness or voluntariness with which users are required to use particular systems for job-related performance. This suggests that the implementation of LMS-related blended learning has some dependency on the voluntariness or otherwise that tutors are required to adopt such learning mode.
Behavioral Intention
Behavioral intention is a precursor to actual use behavior of a system. According to Ajzen (1991), intention behavior is a factor that captures how hard people are willing to try out and perform a new behavior (Teo, 2011). In this study, behavioral intention is explained as course tutors’ willingness to try out and subsequently use the LMS-based online learning to support face-to-face (Bervell & Umar, 2017) having in focus possible hindrances to that effect. Once use intentions are formed in the cognitive, affective, and psychomotor domains of an individual, it allays all negative tendencies and sets the individual in readiness mood to actually use a new technology for instructional purposes. In other words, behavioral control is an antecedent of individuals’ performance behavior (Yousafzai et al., 2010).
Use Behavior
Behavioral intention is envisaged to have a positive relationship with use behavior. Under favorable conditions, behavioral intention will adequately predict use behavior. Logically, the more positively high behavior intentions are, the likelihood that they will engage in that performance behavior. In the technology acceptance arena, course tutors’ positive and high use intentions will to a very large extent predict their actual usage of LMS-supported blended learning. According to Venkatesh et al. (2003), the construct behavioral intention was consistent in the models that constituted the UTAUT model in determining use behavior. Empirical evidence by Im et al. (2011), Phichitchaisopa and Naenna (2013), Evans and Le Roux (2015), Wang and Wang (2009), Percy and Van Belle (2012), and Bervell and Umar (2017) all proved the significant relationship and prediction of behavioral intention on e-learning technology (LMS) usage.
Based on the reviewed literature, the possible factors that could influence blended learning acceptance in distance education have been unraveled. However, items that specifically measure blended learning across these factors need to be generated with further validation based on a systematic approach.
Method
The study adopted a quantitative approach in validating a BLAS. To accomplish the aims of this research, the questionnaire composed of 12 sessions was used to collect data from a sample of 267 tutors out of a population of 400 tutors on a distance education program through a cross-sectional survey. The 400 tutors were involved in piloting of an LMS-enabled blended learning project across the country. The cross-sectional survey was utilized because respondents were scattered across the country at various study centers, with different programs (Maths & Science; Business; and Education) and levels (Diploma, Undergraduate, and Postgraduate) of facilitation. According to Creswell (2009), Creswell and Plano Clark (2011), and Walliman (2011), the cross-sectional survey is appropriate when the population of study is in line with that of this study. Accordingly, a questionnaire was used to elicit their blended learning acceptance based on voluntary participation. The sessions in the questionnaire covered areas such as demographic data; performance expectancy, effort expectancy, facilitating conditions, and social influence; and attitude, experience, self-efficacy, anxiety, voluntariness of use, behavioral intention, and use behavior. These factors were chosen from the dominant UTAUT factors (Venkatesh et al., 2003) and the personality factor–based model (Bervell & Umar, 2018) to measure blended learning acceptance. The items in the questionnaire were modified to suit the blended approach by incorporating the face-to-face aspect in the questionnaire and not the technology (LMS) only. The fusing of the technology aspect for online learning and the face-to-face aspect for offline instruction were used to define clearly the blended mode (Bernard et al., 2014; Means et al., 2013; Siemens et al., 2015) of distance education.
The development of the BLAS was carried out through two phases comprising item generation and validation. The initial phase which was item generation was done through extensive literature review of theoretical and empirical studies on online learning and technology acceptance. From the review, this study categorized the items that could influence blended learning acceptance into technological factors and personality factors. Altogether 62 items were generated from the literature. The items were then modified to reflect blended learning by incorporating the mixture of online and face-to-face-based learning approaches. Subsequently, a focus group discussion (FGD) was conducted with 15 course tutors who were conveniently sampled. The main essence of the FGD was to take tutors through the 62 items generated for them to confirm how the items relate to their blended learning acceptance and also to agree on the list of items. Their initial responses were based on a Likert-type scale of 1 = strongly disagree; 2 = disagree; 3 = neutral; 4 = agree; and 5 = strongly agree. The tutors through the FGD also confirmed the labels or categories that the items were grouped. From the FGD discussion, tutors agreed on a proposed 11 factors that influenced their blended learning acceptance measured by 55 items. These include Performance Expectancy (7), Effort Expectancy (4), Social Influence (5), Facilitation Conditions (5), Attitude (6), Self-Efficacy (5), Experience (5), Anxiety (5), Behavioral Intention (5), Use Behavior (5), and Voluntariness of Use (4). The importance of the item generation stage was to ensure that the items will be well understood by the larger potential respondents for the study. The FGD helped to refine the items to eliminate ambiguity and misunderstanding, while ensuring parsimony. This usefulness of the FGD was consistent with literature from Nyumba et al. (2018) and Teo (2013). Items that were too complex and directly unrelated were also deleted from the list. Altogether, seven items were eliminated from the list of items. After this process, the 55 items (refer to the appendix) were subjected to a quantitative validation process through partial least squares structural equation modeling (PLS-SEM) approach and were reduced to 45 items across the various constructs.
Findings
Assessment of Measurement Model
The measurement model was analyzed to ascertain the indicator loadings (indicator reliability), rho_A, composite reliability (internal consistency), average variance extracted (AVE; convergent validity), Fornell–Larcker, heterotrait–monotrait ratio (HTMT; discriminant validity), and variance inflation factor (VIF; multicollinearity) measures. A PLS algorithm for confirmatory factor analysis (CFA) was run to first assess the indicator loadings for all constructs as recommended by Hair et al. (2017) and Hair et al. (2014). The graphical presentation is depicted in Figure 1.

Initial PLS algorithm for EFA indicator loadings.
The initial approach was to remove all items that loaded relatively low for each construct. From Figure 1, the initial items that were deleted included ATT6 (0.04), PE4 (0.513), FC3 (0.214), FC4 (0.644), SE1 (0.570), SE3 (0.534), EXP2 (0.600), EXP4 (0.595), ANX1 (0.622), and USE2 (0.645). These were removed to also improve values for the composite reliability and AVE.
After deleting these cases, the PLS algorithm was re-run to determine the items that loaded satisfactorily and the values for their corresponding reliability and validity measures. Figure 2 shows the second PLS algorithm for CFA.

PLS algorithm for CFA indicator loadings.
The deletion of the above items gave indicator loadings of above 0.7 with only SE4, EXP1, VOL3, and VOL4 loading between the ranges of 0.604 to 0.671. Although these loadings were below 0.7, they were maintained in consistent with the literature (Fornell & Larcker, 1981; Hair et al., 2017; Hulland, 1999) that when AVE values are achieved, items that load below the threshold of 0.7 and above, but higher than 0.50 should not be deleted due to content validity. Table 1 shows the results for loadings, rho, composite reliability, and AVE.
Summarized Results of Measurement Model.

Composite Reliability
Composite reliability explains the consistency based on the loadings of the items in the construct, which provide a consistent measure of the sum scores (Hair et al., 2017; Henseler et al., 2016). The threshold for determining acceptable levels of composite reliability is a coefficient greater than .7 but less or equal to .95. From Table 1, all the values were greater than .7, ranging between .786 and .927. Thus, composite reliability was achieved.
Rho_A
According to Dijkstra and Henseler (2015b), the most important reliability measure in PLS is the rho_A, and it is currently the only consistent reliability measure for construct scores in PLS (Henseler et al., 2016). The other (composite reliability) only assesses the sum scores and not the construct’s scores. In view of this, rho_A was also assessed to prove for reliability within the model measurement’s constructs. The coefficients obtained ranged between .712 and .917, indicating good rho_A measures.
AVE
Henseler et al. (2016) recommend measurement of constructs to be free from systematic errors which is normally detected through average variance estimates. AVE measures the grand mean value of the squared loadings of the indicators of a construct (Hair et al., 2017) which indicate the proportion of variance of the construct accounted for by the factors. The results for all the constructs ranged between 0.516 and 0.759, greater than the threshold of 0.5. The obtained estimates satisfied the requirement for AVE. As both composite reliability, rho_A and AVE, criteria were met, the assumptions for internal consistency and convergent validity were obtained.
Discriminant Validity
Constructs in a model should measure distinctly from other constructs and their indicators. As a criterion, the assessment is based on the item correlation comparison among the constructs (Hair et al., 2017). Three methods can be used to detect discriminant validity among constructs of a model; cross loadings of items, Fornell–Larcker, and HTMT (Hair et al., 2017; Henseler et al., 2016).
Cross Loadings
Initial assessment was based on the cross loadings of the items measuring the various constructs. Hair et al. (2017) recommend that the loadings of items on a construct should be larger than their corresponding loadings on other constructs. Results obtained on the cross loadings, as exhibited in Table 2, show that all the main loadings on main constructs were higher than their corresponding loadings on the other constructs. This fulfills the initial analysis of discriminant validity.
Results of Cross Loadings.

Note. ANX = Anxiety; ATTU = Attitude; BI = Behavioral Intention; EE = Effort Expectancy; EXP = Experience; FC = Facilitating Conditions; PE = Performance Expectancy; SE = Self-Efficacy; SI = Social Influence; UB = Use Behavior; VOL = Voluntariness.
Fornell–Larcker Assessment
According to the Fornell–Larcker criterion for assessing discriminant validity, all the AVE values of a particular construct should be greater than that of the corresponding constructs (Fornell & Larcker, 1981; Hair et al., 2017). Results of the AVE values across constructs are shown in Table 3.
Fornell–Larcker Assessment.

Note. ANX = Anxiety; ATTU = Attitude; BI = Behavioral Intention; EE = Effort Expectancy; EXP = Experience; FC = Facilitating Conditions; PE = Performance Expectancy; SE = Self-Efficacy; SI = Social Influence; UB = Use Behavior; VOL = Voluntariness.
From Table 3, all bolded values indicate the AVE estimates for associated constructs, contrasting that of the corresponding vertical value for the other constructs. The bolded values are all greater than non-bolded ones, indicating good discriminant measures.
HTMT
A new criterion stricter than the above two approaches for assessing discriminant validity is the HTMT (Henseler et al., 2015). The HTMT compares the AVE values of each of the constructs with their squared consistent correlations. To clearly discriminate between two constructs, their AVE should be significantly lesser than 1 (Henseler et al., 2015). Results of HTMT analysis in Table 4 show a significant difference of values less than 1 between the AVE of the constructs. In addition, AVE loadings on the same construct should be zero (the difference between the same AVE values), which is also satisfied by the results.
HTMT.
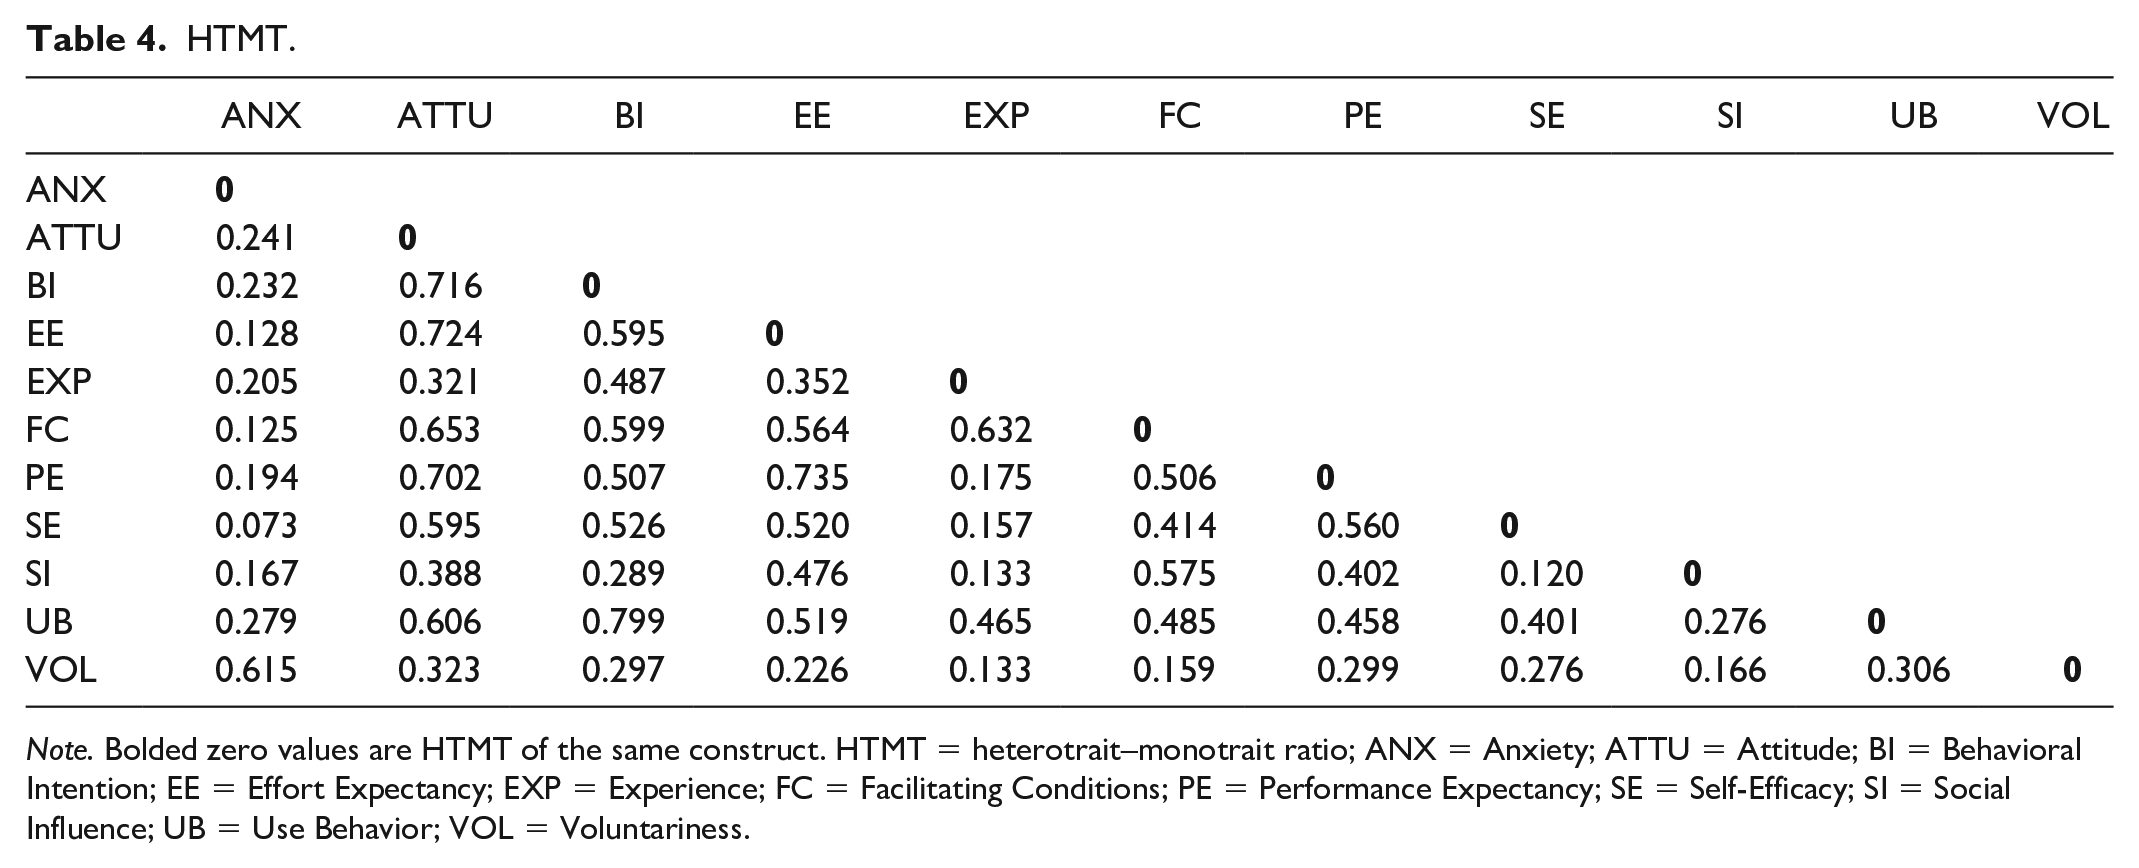
Note. Bolded zero values are HTMT of the same construct. HTMT = heterotrait–monotrait ratio; ANX = Anxiety; ATTU = Attitude; BI = Behavioral Intention; EE = Effort Expectancy; EXP = Experience; FC = Facilitating Conditions; PE = Performance Expectancy; SE = Self-Efficacy; SI = Social Influence; UB = Use Behavior; VOL = Voluntariness.
Multicollinearity
The issue of Multicollinearity stems from two or more variables measuring the same attributes of a tangible or intangible object, normally the dependent variable (Kock & Lynn, 2012) or by common method bias (where different respondents provide responses to a survey questionnaire in the same general direction in collecting data for SEM; Kock, 2015). Multicollinearity causes misleading results of path analysis and needs to be checked before path analysis (Kock & Lynn, 2012). The recommended comprehensive approach to detect multicollinearity (both lateral and vertical) in PLS-SEM is to run a full collinearity test based on VIF values with a threshold of less than 3.3 in the strict sense (Hair et al., 2017; Kock, 2015). Based on this, a collinearity assessment was made based on VIF. Table 5 depicts the results.
Results for VIF Based on Full Collinearity Test.

Note. ANX = Anxiety; ATTU = Attitude; BI = Behavioral Intention; EE = Effort Expectancy; EXP = Experience; FC = Facilitating Conditions; PE = Performance Expectancy; SE = Self-Efficacy; SI = Social Influence; UB = Use Behavior; VOL = Voluntariness.
As indicated by Table 5, all the independent latent variables measured distinctively their corresponding dependent variables. This is evident from the VIF values that ranged from 1.095 to 2.49, all less than the 3.3 threshold. Thus, the measurement is free from common method bias and collinearity effects.
Kaiser–Meyer–Olkin (KMO) and Bartlett’s Test of Sphericity (BTS)
Finally, the sample adequacy as well as the reliability of items was also assessed through the KMO measure of sampling adequacy, BTS. The results are shown by Table 6.
Results for Kaiser–Meyer–Olkin and Bartlett’s Test of Sphericity.
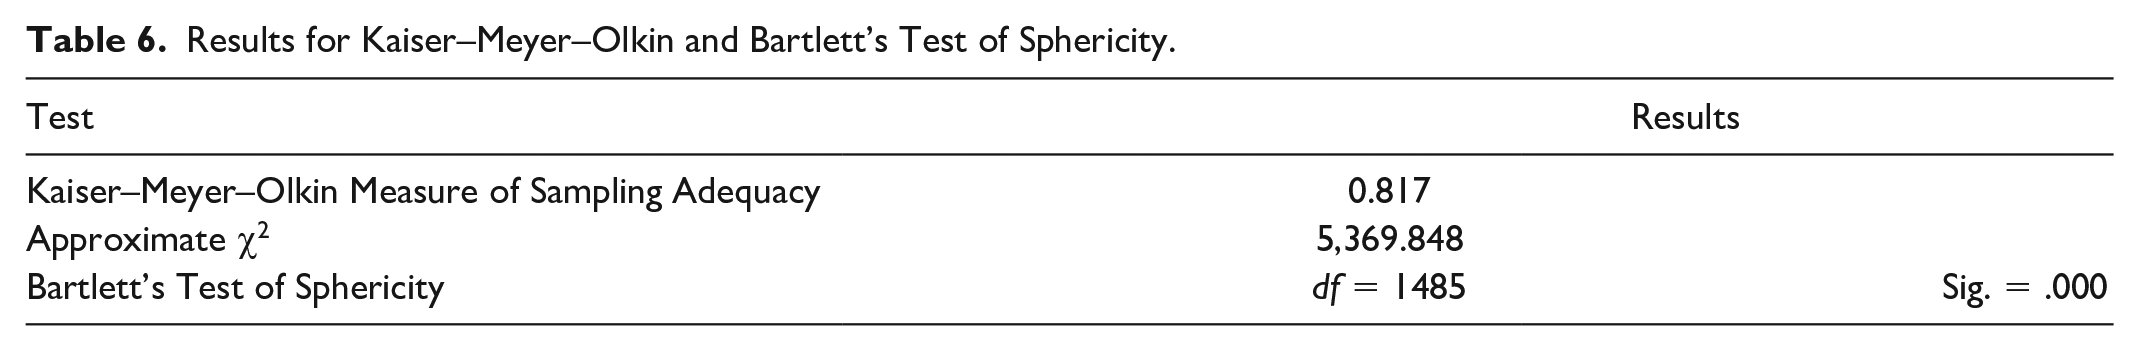
Results from the KMO and BTS showed good sampling adequacy as well as factor reliability. This is confirmed by the coefficient of 0.817 and a chi-square value of 5,369.848. KMO results had a degree of freedom of 1485 at a significant p value of .000. The result from the KMO suggests that the number of items that measured each construct were sufficient (Cerny & Kaiser, 1977; Kaiser, 1974). In addition, the significance of the BTS indicates that the correlation matrix is significantly different from the identity matrix (Snedecor & Cochran, 1989). This means there is no redundancy between the variables that can be summarized with some factors.
Discussion
The study pioneered the development and validation of a BLAS for distance-based higher education. The study combined the online learning and face-to-face concepts that define blended learning (Burns, 2011; Graham, 2006; Siemens et al., 2015) to develop items to suit the blended learning paradigm. The initial stage was the item generation based on existing literature on blended learning and technology acceptance. Following the first stage was the second phase detailed on the FGD to agree on specific items among all the generated items that bother on tutors’ blended learning acceptance in distance education. They agreed on the items based on a 5-point Likert-type scale. Those items that obtained responses such as agree or strongly agree during the FGD were incorporated into the initial scale. Furthermore, the FGD was used to clear item ambiguities and unclear understanding of items by tutors, as suggested by Nyumba et al. (2018) and Teo (2013). After fine-tuning the items in the initial scale, an exploratory factor analysis by way of PLS algorithm was used to eliminate loadings that were either below the 0.5 threshold or those whose deletion improved significantly upon the internal consistency measures of the factors (Hair et al., 2017; Kline, 2015). Overall, 10 items were removed from across seven factors to provide a robust measure of internal consistency measures (indicator loadings, composite reliability, rho_A; and AVE).
The scale items were further tested for reliability (non-redundancy of factors) and sample adequacy through BTS and KMO, respectively (Cerny & Kaiser, 1977; Kaiser, 1974; Snedecor & Cochran, 1989). The results of the KMO and BTS were favorable indicating good sample adequacy for data collection and items for the various factors for this study as well as reliable factors. The BTS further showed that there was no redundancy among the factors within the scale. The final stage of the validation process was the CFA through PLS algorithm. This stage was used to finally confirm the factors that loaded highly across the various constructs and provided good internal consistency measures. Subsequently, all items in the final scale loaded above 0.7 across the 11 factors. However, only four items (SE4; EXP1; VOL3, and VOL4) loaded between 0.604 and 0.671. Despite their loadings below the 0.7 threshold, the items were considered good and thus maintained because they were higher than the minimum indicator, loadings threshold of 0.5 as recommended by Hair et al. (2017) and Kline (2015) that such items should not be removed as they promote content validity. Consequently, these items were maintained to improve the content validity of the BLAS instrument.
In addition, composite reliability which ensures consistency of all item measurement across constructs was good with values ranging between the .786 and .927 threshold and were considered very high based on the literature (Bervell & Umar, 2018; Hair et al., 2014; Kline, 2015). Another important reliability coefficient is the rho_A as suggested by Dijkstra and Henseler (2015b) and was highly achieved. This was confirmed by the value range of between .786 and .927. This implies that the internal consistency was fixed and could not be varied across samples. Hence, the internal consistencies of the indicator items in the scale were devoid of sample variation (Henseler et al., 2016).
In terms of determining a systematic error-free scale for measurement, the AVE test was employed. AVE values across the constructs were between 0.516 and 0.759, all greater than the 0.5 recommendation (Hair et al., 2017; Kline, 2015). This is an indication that the scale was free from systematic errors. Furthermore, to determine the distinct nature of each construct in the scale, three discriminant validity tests were utilized. Accordingly, measures obtained for discriminant validity were all achieved through the liberal indicator cross loading and Fornell–Larcker criteria (Fornell & Larcker, 1981) and the strict HTMT approach (Henseler et al., 2016). All cross loadings of the main constructs were higher than their corresponding loadings on the other constructs. Similarly, for the Fornell–Larcker, all AVE values on a particular construct were greater than that of their corresponding constructs. This was further confirmed through the HTMT measures that had significant values of less than 1 across the various constructs and AVE loadings on the same construct recording values of zero (difference between the same AVE for a particular construct).
Finally, the scale was free from both lateral and vertical multicollinearity. This is indicative of the strict VIF values of less than 3.3 (Hair et al., 2017; Kock, 2015). The VIF values of all the constructs were between 1.095 and 2.49. This was a very good indication that the latent variables in the scale were distinctly measured and further exempted from common method bias and collinearity effects.
Overall, 45 items across 11 constructs made up the BLAS instrument for measuring blended learning acceptance in distance education after the rigorous validation process.
Limitations
The study used a sample from only tutors and hence the development of the BLAS instrument was based on tutors’ perspectives. Owing to this, it will be difficult to generalize it to students.
The sample size used, although adequate, was from only one institution’s distance education program. This makes generalizing to all institutions of distance education cautionable.
Recommendations for Future Research
Future studies could use students as samples to parallel the findings to that of this study to further validate the scale.
Future studies could involve more institutions from distance education to get a wider participation to further validate the scale.
It is further recommended that other authors use this scale in different contexts (K–12, conventional university system, country, etc.) to validate the BLAS instrument.
Future studies could also improve upon the wording of the items to achieve better responses for further validation of the BLAS instrument.
Conclusion
The study has made an initial stride toward the development of a BLAS based on a gap in the literature. The combination of the face-to-face and online learning modes in the scale items made it apt to measure blended learning acceptance instead of the usual technology-biased scales often used. This study thus developed and validated the 45 items and 11 constructs or factors scale to measure acceptance of blended learning by tutors in distance higher education. It has produced an instrument (BLAS) that adequately references a measure of blended learning.
Footnotes
Appendix
Items for Blended Learning Acceptance Scale (BLAS).

| S. No. | Items on Performance Expectancy |
|---|---|
| 1. | I find the online learning system useful to support face-to-face in my teaching and learning process. |
| 2. | Using the online learning system to support face-to-face enables me to accomplish tasks more quickly than using only face-to-face. |
| 3. | Using the online learning system together with face-to-face, increases my teaching and learning output. |
| 4. | Using the online learning system in addition to face-to-face increases my chances of getting a promotion. (Removed after Validation) |
| 5. | Combining the online learning system with face-to-face allows me to use various teaching strategies and approaches than only face-to-face. |
| 6. | Using the online learning system’s resources together with face-to-face improves the quality of my teaching activities and makes my work more meaningful than face-to-face alone. |
| 7. | Using the online learning system, in addition to face-to-face, increases my teaching allowance incentive. |
| S. No. | Items on Effort Expectancy |
|---|---|
| 1. | My interaction with the online learning system to augment face-to-face is clear and understandable. |
| 2. | It is easy for me to become skilful at using the online learning system together with face-to-face overtime. |
| 3. | Currently, I find the online learning system easy to use to support the face-to-face teaching approach. |
| 4. | Learning to operate the online learning system to support face-to-face is easy for me. |
| S. No. | Items on Social Influence |
|---|---|
| 1. | People who influence my behavior think that I should use the online learning system in addition to face-to-face. |
| 2. | Colleagues who are important to me suggest that I should use the online learning system to support face-to-face. |
| 3. | The senior management of the college promotes the use of the online learning system as a complement to face-to-face. |
| 4. | In current practice, tutors who use such online learning system together with face-to-face are seen as technologically good instructors. |
| 5. | In general, the college encourages for the combined use of the online learning system and face-to-face. |
| S. No. | Items on Facilitating Conditions |
|---|---|
| 1. | I have the resources necessary to use the online learning system in addition to face-to-face. |
| 2. | I have the knowledge necessary to use the online learning system to support face-to-face. |
| 3. | The online learning system is compatible with other online learning system I use to complement face-to-face. (Removed after Validation) |
| 4. | When I am in difficulty in utilizing the online learning system’s online activities to support face-to-face, the system’s support team is available for assistance. (Removed after Validation) |
| 5. | The management has provided enough support toward the use of the online learning system together with face-to-face interaction. |
| S. No. | Items on Attitude |
|---|---|
| 1. | Using the online learning system to augment face-to-face in distance learning is a good idea. |
| 2. | Combining the online learning system with face-to-face makes teaching and learning more interesting as compared with using only face-to-face. |
| 3. | Teaching with the online learning system in addition to face-to-face is also full of fun. |
| 4. | I like to teach with the online learning system to reach out to students online after face-to-face sessions. |
| 5. | I am positive toward using the online learning system for teaching and learning in support of face-to-face interaction. |
| 6. | I think using the online learning system for instructional activities in addition to face-to-face is an additional work load. (Removed after Validation) |
| S. No. | Items on Self-Efficacy |
|---|---|
| 1. | there was no one around to tell me what to do as I go. (Removed after Validation) |
| 2. | there was someone to help in case of difficulty. |
| 3. | enough time was provided. (Removed after Validation) |
| 4. | the built-in help facility is available for assistance. |
| 5. | I had the necessary skills for using the system functionalities to assist students online. |
| S. No. | Items on Anxiety |
|---|---|
| 1. | I feel apprehensive about using the online learning system in addition to face-to-face interaction. (Removed after Validation) |
| 2. | It scares me to think that I could lose a lot of information using the online learning system to support face-to-face by hitting the wrong key while online with students. |
| 3. | I hesitate to use the online learning system to support face-to-face for fear of making mistakes I cannot correct while online with students. |
| 4. | The online learning system is somewhat intimidating to me in terms of using it to support face-to-face instruction. |
| 5. | I am afraid that the use of the online learning system in addition to face-to-face will eventually replace the course tutor in the future. |
| S. No. | Items on Experience With Technology for Teaching and Learning |
|---|---|
| 1. | I have previously used a similar online learning system to support face-to-face during tertiary or other professional educational training. |
| 2. | I have previously used a similar online learning system for teaching to support face-to-face. (Removed after Validation) |
| 3. | I have prior skills in navigating through an online learning system’s environments to support face-to-face. |
| 4. | I am familiar with using the online learning system to support face-to-face in distance education. (Removed after Validation) |
| 5. | Generally, I am familiar with computers and internet usage for academic and/or social activities. |
| S. No. | Items on Use Behavior |
|---|---|
| 1. | I used the online learning system for online forum discussions after face-to-face. |
| 2. | I used the online learning system for uploading and sharing learning resources before and after face-to-face sessions. (Removed after Validation) |
| 3. | I used the online learning system for announcements on teaching and learning activities before and after face-to-face. |
| 4. | I used the online learning system for video-conferencing to support face-to-face interaction. |
| 5. | I used the online learning system for providing links to additional online resources for students after face-to-face sessions. |
| S. No. | Items on Voluntariness of Use |
|---|---|
| 1. | I feel I am being forced to use the online learning system in addition to face-to-face instruction. |
| 2. | I think any online learning system usage to support face-to-face distance education delivery should be made optional. |
| 3. | Although it might be helpful in using online learning system to support face-to-face teaching and learning, it is not made compulsory. |
| 4. | The college does not require me to use the online learning system in addition to the existing face-to-face teaching and learning mode. |
| S. No. | Items on Behavioral Intention |
|---|---|
| 1. | I intend to use the online learning system to support face-to-face in the next semester if fully implemented. |
| 2. | I predict I would use the online learning system in the next academic year in addition to face-to-face sessions if fully implemented. |
| 3. | I predict I would use the online learning system to complement face-to-face in future academic year sessions if fully implemented. |
| 4. | I plan to use the online learning system for online activities as a support for face-to-face whenever possible. |
Acknowledgements
The authors would like to express their special thanks to the distance education tutors who participated in the survey.
Declaration of Conflicting Interests
The author(s) declared no potential conflicts of interest with respect to the research, authorship, and/or publication of this article.
Funding
The author(s) received no financial support for the research and/or authorship of this article.
Availability of Data and Materials
Data and materials will be provided by the corresponding author upon request.