
Abstract
Spielberger’s State-Trait Anxiety Model makes a theoretical distinction between the contribution of dispositional anxiety and the transitory experience of anxiety to performance difficulties during testing situations. According to the State-Trait framework, state anxiety is viewed as the primary performance barrier for test-anxious students, and as such, educators and educational researchers have expressed interest in validated, state anxiety measurement tools. Currently, the most widely used measure of state anxiety is the state version of the State-Trait Anxiety Inventory. However, evidence regarding the psychometric properties of this scale is relatively scarce. Therefore, the current study was designed to determine the structural validity, reliability, and concurrent/divergent validity of the instrument. Participants (N = 294) completed the state version of the State-Trait Anxiety Inventory, Positive and Negative Affect Schedule, Cognitive Test Anxiety Scale 2nd Edition, and an exam task. Using confirmatory factor analysis, we tested the viability of one-, two-, and bi-factor solutions for the State-Trait Anxiety Inventory. Confirmatory factor analysis results indicated a two-factor solution consisting of State Anxiety and State Calmness dimensions provided superior fit to the observed data. Results of a reliability analysis indicated that the State Anxiety and State Calmness factors demonstrated excellent internal consistency when applied to university students. Our discussion concerns the utility of the State Anxiety factor as a tool for the identification of test-anxious students.
Keywords
Test anxiety is a well-documented phenomenon that influences the academic performance of learners at all educational levels (Cassady & Johnson, 2002; Hembree, 1988; von der Embse et al., 2018). Process-oriented models consider test anxiety to be a maladaptive response to evaluative events that are appraised as threatening to ones’ sense of well-being (Zeidner, 1998). Within these frameworks, the experience of test anxiety is the result of the complex interplay of interpersonal and contextual factors, such as achievement goals (Putwain & Symes, 2018), personality dispositions (Thomas & Cassady, 2019; von der Embse et al., 2018), and appraisals of personal competence (Lohbeck et al., 2016). Although educational research has identified numerous factors that contribute to individual differences in the experience of test anxiety, process-oriented models emphasize that the most proximal determinant of performance decrements among test-anxious students is the experience of elevated levels of state anxiety (Zeidner, 1998). Multiple lines of inquiry have supported the importance of effectively identifying state anxiety, given the durable impact of state anxiety on performance (Zohar, 1998) as well as evidence demonstrating that interventions that promote controlling state anxiety can support performance outcomes (Beauchemin et al., 2008; Bellinger et al., 2015).
Reviews of the literature repeatedly confirm that the state component of the State-Trait Anxiety Inventory (STAI) is the most widely used instrument within investigations attempting to measure the severity of the momentary experience of anxiety (Vigneau & Cormier, 2008). Despite the widespread use of the STAI within empirical investigations, few studies have explored the psychometric properties of the state component specifically (Barnes et al., 2002; Vigneau & Cormier, 2008). Therefore, the current study was designed to address this potential gap in the literature through the systematic investigation of the structural validity, reliability, concurrent validity, and divergent validity of the State Scale of the State-Trait Anxiety.
State-Trait Model
One of the most enduring theoretical frameworks for understanding the source of individual differences among learners as well as the causal mechanisms through which test anxiety influences academic success is Spielberger’s (1972) State-Trait Model of Anxiety. The primary proposition in this framework is that the debilitative influence of anxiety (e.g., test anxiety) on academic performance can be understood by recognizing an individual’s dispositional tendency to anxiety generally (i.e., trait anxiety) and the severity of anxiety experienced during specific evaluative events, which is more variable across settings and time frames (i.e., state anxiety; Spielberger et al., 1983; Spielberger & Vagg, 1995; Zohar, 1988). Generally, the manifestation of elevated state anxiety functions as a barrier to optimal performance due to the activation of distracting thoughts or maladaptive coping strategies that undermine information processing efficiency (Derakshan et al., 2009; Eysenck et al., 2007; Zeidner, 1998). That is, high levels of state anxiety are believed to trigger maladaptive cognitive reactions (e.g., worry, self-doubt, self-deprecating thoughts, excessive self-preoccupation) that make it difficult for learners to effectively store test-relevant information in long-term memory and interfere with the effective retrieval of needed information during testing events (Cassady & Johnson, 2002; Liebert & Morris, 1967). Logically, the State-Trait framework assumes that individuals with higher levels of trait anxiety experience increased state anxiety because of their general predisposition to perceive evaluative events as exceeding their available coping resources (Cassady & Thomas, 2020; Spielberger & Vagg, 1995).
Measurement of State Anxiety
State anxiety has captured the attention of educational researchers and is often the focus of psychoeducational interventions, given the frequently identified performance difficulties noted among test-anxious students (Deffenbacher et al., 1980; Khng, 2017; Kirkland & Hollandsworth, 1980; Morris et al., 1981; Putwain, 2008). Despite the theoretical and practical significance of the state anxiety construct, our review of the literature indicates that there are relatively few validated, self-report instruments designed to determine the severity of state anxiety experienced during test preparation, performance, and reflection. Of the instruments available, the state component of the STAI (S-STAI; Spielberger et al., 1983) is the dominant measurement tool for researchers and educational practitioners interested in assessing the degree of “in the moment” anxiety an individual may experience across different contexts.
Despite the widespread use of the S-STAI (Panteleeva et al., 2018; Zsido et al., 2020), there has been empirical evidence calling into question the psychometric properties of the instrument. During the initial development and subsequent revision of the STAI, Spielberger and colleagues (1970, 1983) proposed that S-STAI items are indicators of a single latent construct corresponding to the transitory experience of anxiety. The identification of a single state anxiety dimension has been replicated by researchers attempting to validate the instrument for use in different cultural contexts and during efforts to establish reduced versions of the instrument (Melita et al., 2020; Zsido et al., 2020). However, a sizable collection of investigations employing a combination of exploratory and confirmatory factor analytic approaches have challenged the unidimensional nature of the instrument with evidence supporting the existence of two or perhaps three distinct factors underlying responses to adult and child versions of the S-STAI, including Anxiety Present, Anxiety Absent, and Calmness (Bados et al., 2010; Kirisci et al., 1997; Shek, 1991; Vigneau & Cormier, 2008).
A careful review of the prior investigations examining S-STAI validity highlights key methodological limitations that may have led researchers to faulty inferences. Specifically, the majority of confirmatory factor analytic work conducted on the S-STAI has relied on the use of maximum likelihood estimation (MLE) methods (Kirisci et al., 1997; Shek, 1991; Spielberger et al., 1970, 1980; Vigneau & Cormier, 2008). There is general consensus in the field of latent variable modeling that MLE methods are most appropriate for use with continuous data—or measurement tools that are measured on an interval or ratio scale of measurement (Kline, 2016). However, psychometricians have suggested that survey items using Likert-type response scales fail to meet the requirements of continuous data and should be considered to be ordered categorical (i.e., ordinal) data (Jamieson, 2004). Critically, investigations have demonstrated that applying measurement techniques designed for continuous data to ordinal data often contributes to negative outcomes that could contribute to inferential errors, such as biased parameter estimates and increased Type I and Type II error rates (Babakus et al., 1987; Liddell & Kruschke, 2018; Mîndrila, 2010). In an attempt to improve confirmatory factor analysis (CFA) parameter estimates, statisticians developed estimation methods designed explicitly for use with ordinal data (i.e., Diagonally Weighted Least Squares) that make use of a polychoric correlation matrix to determine the relations between indicators and make no underlying assumptions regarding the distribution of the observed data (Li, 2016). Empirical evaluations of CFA estimation procedures with simulated data have repeatedly demonstrated the diagonally weighted least squares approach provides more accurate parameter estimates than traditional MLE when applied to ordinal data (Flora & Curran, 2004; Li, 2016; Mîndrila, 2010). As such, given the widespread international use of the S-STAI (Manzoni et al., 2008; Panteleeva et al., 2018; Zsido et al., 2020), we believe it is critical to investigate its structural validity using more appropriate statistical methodology.
Method
Participants
Participants in the current investigation were undergraduate students (N = 294, 79.3% female, 86.7% Caucasian) attending a midsized public university located in the Midwestern United States. The participants were recruited through their involvement in an undergraduate research pool and completed the study materials in exchange for partial course credit. The mean age of participants was 19.81 (SD = 2.72).
Measures and Materials
S-STAI
We assessed the transitory experience of anxiety using the 20-item S-STAI (Spielberger et al., 1983). Participants reported how well each of the presented statements described how they were feeling in the present moment using a 4-point Likert-type scale (1 = not at all, 4 = very much so). Sample items include “I am relaxed” and “I am worried.” Responses to the 20 items are averaged to create an index of state anxiety with higher values indicating an increased experience of arousal and tension in the present moment. Negative polarity items written in a manner that suggest an absence of state anxiety (e.g., “I am relaxed”) are reverse-scored prior to the calculation of the overall state anxiety score.
Positive and Negative Affect Schedule
The nature of participants’ emotional states during the experimental procedure was assessed using the Positive and Negative Affect Schedule–Expanded Form (PANAS; Watson & Clark, 1999). Participants in the current investigation reported how well each of the presented mood terms described their feelings in the present moment using a 5-point Likert-type scale (1 = very slightly or not at all, 5 = extremely). Prior research has demonstrated that PANAS items can be used to create estimates of general positive and negative affect as well as specific positive (e.g., attentiveness and self-assurance) and negative (e.g., fear, guilt, and sadness) affective states (Watson & Clark, 1991; Watson, Clark, & Tellegen, 1988). Sample items include “afraid,” “nervous,” “guilty,” “active,” “alert,” and “excited.” Subsequent validation studies for the PANAS have confirmed that the proposed factor structure was durable, the two subscales enjoyed high internal consistency, was deemed to possess measurement invariance, and demonstrated construct validity by conforming to predictions of the tripartite model of anxiety and depression (e.g., Crawford & Henry, 2004). In the current study, reliability analysis revealed that the positive (Cronbach’s α = .92, McDonalds’s ω = .92) and negative (Cronbach’s α = .91, McDonalds’s ω = .91) affect subscales demonstrated excellent internal consistency.
Cognitive Test Anxiety Scale-2nd edition
Participant’s general tendency to view evaluative situations as threatening was assessed using the Cognitive Test Anxiety Scale-2nd edition (CTAS-2; Thomas et al., 2018). The CTAS-2 is a 24-item self-report instrument that is designed with the explicit purpose of assessing the severity of the cognitive expressions of test anxiety with the potential to interfere with the ability to store and retrieve test-relevant information. Participants reported how well each of the presented statements describes their typical reactions to evaluative situations using a 4-point Likert-type scale (1 = not at all like me, 4 = very much like me). Sample items include: “I get distracted from studying for tests by thoughts of failing” and “When I take a test that is difficult, I feel defeated before I even start.” Multiple validation studies with the CTAS have confirmed validity through scale construct (e.g., Cassady & Finch, 2014, 2015) and convergent validity analyses (e.g., Cassady et al., 2019; Thomas & Cassady, 2019). The CTAS-2 demonstrated excellent internal consistency in the current examination (Cronbach’s α = .96, McDonalds’s ω = .96).
Exam task
To induce some degree of perceived stress, participants were told they would be completing an online exam consisting of math and word problems. Specifically, participants were asked to report if a series of arithmetic problems were solved correctly, for example, (9 × 6) − 15 = 31, and asked to indicate if series of letter strings spelled an English word presented in reverse (e.g., sdarwot). We manipulated the difficulty of the task to ensure participants completed a mix of high- and low-difficulty problems. Task difficulty was altered by changing the overall complexity of problems such that high-difficulty arithmetic problems required a borrow operation to solve, low difficulty: (3 × 3) − 6 = 2 versus high difficulty: (9 × 7) − 17 = 48, and high-difficulty letter strings contained a larger number of letters (low difficulty: danl vs. high difficulty: deecorp). The math and word problems were adapted from stimuli used in other investigations of the predictors and antecedents of academic anxieties (Park et al., 2014; Thomas & Cassady, 2020).
Procedure
After providing informed consent, participants completed: (1) the CTAS-2, (2) a practice assessment consisting of high- and low-difficulty math and word problems, (3) S-STAI, (4) positive affect subscale, (5) negative affect subscale, and (6) a math and verbal verification task. The presentation of the positive affect subscale, negative affect subscale, and S-STAI were counterbalanced to avoid potential order effects. All experimental materials were presented using PsyToolkit—an online platform that allows participants to complete experimental paradigms that require a behavioral response following the presentation of stimuli using a web browser (Stoet, 2010, 2017). All data were collected via an online portal, with individual participants completing the materials at their convenience. As such, no control over setting (e.g., lab vs. home) was possible in these analyses.
Results
Descriptive Statistics
An overview of descriptive statistics for individual S-STAI items is presented in Table 1. A review of descriptive statistics revealed that the average score for each of the individual items was clustered around the midpoint of the response scale. This pattern highlights that extreme scores were uncommon and suggests restriction of range likely will not influence the outcome of our analyses. Furthermore, we examined skewness and kurtosis values for evidence of non-normal response patterns. Our review indicated that most skewness and kurtosis values fell within accepted guidelines that are believed to be indicative of normally distributed data (+1/−1; Putwain & Aveyard, 2018). However, S-STAI Items 3, 6, 7, 9, and 14 fell outside the guidelines described earlier which suggests responses to these items may not follow a normal distribution. Furthermore, we conducted Mardia’s (1970, 1974) test to determine whether the data violated the assumption of multivariate normality. The results of Mardia’s test indicated there were issues with both multivariate skewness (test statistic = 2,678.96, p < .05) and multivariate kurtosis (test statistic = 16.32, p < .05) in the current study.
Demographic Information for S-STAI Items.

Note. S-STAI = state component of the State-Trait Anxiety Inventory.
Item is reversed-scored. Negative polarity items were NOT reverse-scored before calculating descriptive statistics.
Structural Validity
To investigate the structural validity of the S-STAI, we estimated one-, two-, and bi-factor models through CFAs. The specification of the one-factor model was guided by the initial proposed model and documented scale properties for the S-STAI as a single latent construct (Spielberger et al., 1983; Vagg et al., 1980). The specification of the two-factor model was guided by empirical investigations suggesting the latent structure of the S-STAI is best represented by two unique factors that are distinguished primarily by item polarity such that all items indicating high levels of anxiety (hereafter identified as “State Anxiety”) loaded on a single factor and all negatively valanced items (i.e., reverse-scored items, hereafter identified as “State Calmness”) loaded onto a separate factor (Bados et al., 2010; Kirisci et al., 1997; Shek, 1991; Vigneau & Cormier, 2008). Importantly, the facets of state anxiety specified in the two-factor model were assumed to be correlated (i.e., oblique factors). Finally, psychometricians have suggested the impact of negatively worded items can be estimated using bi-factor models specifying a general factor related to the construct of interest as well as distinct factors capturing unique variance associated with the use of positive and negative polarity items (Gu et al., 2015; Hyland et al., 2014). Therefore, we estimated a bi-factor model consisting of a generalized state anxiety factor (consisting of all STAI items), a positive wording factor (consisting solely of positive polarity items), and a negative wording factor (consisting solely of negative polarity items).
The CFA models described earlier were estimated in MPlus (version 7.31; Muthén & Muthén, 1998–2017) using the weighted least squares estimator, a method demonstrated to outperform maximum likelihood-based estimation methods when applied to ordered categorical data and when data demonstrate issues related to normality (Flora & Curran, 2004; Li, 2016; Rhemtulla et al., 2012). The quality of the CFA solutions was assessed through the examination of the root mean square error of approximation (RMSEA; Steiger, 1990), comparative fit index (CFI; Bentler, 1990), Tucker–Lewis Index (TLI; Tucker & Lewis, 1973), and standardized root mean square residual (SRMR). A good-fitting CFA model was indicated by CFI >.95, TLI > .95, RMSEA < .05, and SRMR < .08 (Hu & Bentler, 1999; Marsh et al., 2004). We chose not to report the results of the chi-square test because of past research noting the analytical procedure is prone to rejecting well-fitting models when sample size is relatively large (Babyak & Green, 2010).
Examination of model fit indices indicated that the one-factor solution provided a poor fit to the observed data. However, the results supported the viability of the two- and bi-factor solutions as evidenced by model fit indices falling within accepted guidelines. Next, we examined factor loadings for both solutions in an attempt to determine whether the negatively worded factor should be considered a unique latent construct or simply an artifact of item wording. When interpreting the appropriateness of bi-factor models, it is important to compare the relative magnitude of factor loadings for the general and first-order factors. Commonly, strong factor loadings for the general factor paired with low factor loadings for the first-order factors are evidence that a single overarching construct best represents the data. However, strong factor loadings for both general and first-order factors suggest the existence of constructs that are distinct from the general factor that should be assessed through the creation of subscale scores (Hyland et al., 2014; Reise et al., 2010). A review of factor loadings for the two-factor solution indicated all positively and negatively worded items loaded strongly on their respective latent constructs. Furthermore, the bi-factor solution results indicated that loadings for many items associated with the positive and negative wording factors were similar in magnitude—and in some cases exceeded—loadings for the generalized factor. Critically, the magnitude of the “positive” and “negative” wording factor loadings within the bi-factor solution suggests these items are assessing unique components of the state anxiety experience and are not simply an artifact of item wording.
Collectively, our results are consistent with past research demonstrating the multidimensional nature of the latent structure of the S-STAI and suggest the instrument may contain items that are not functioning as originally designed (Kirisci et al., 1997; Vigneau & Cormier, 2008). Furthermore, the results of the CFA are consistent with a sizable body of literature noting that the inclusion of negatively valenced items (or items that must be reverse scored) on self-report instruments often produce factors that are not indicative of the latent constructs the measurement tool is designed to assess (e.g., Cassady & Finch, 2014; DiStefano & Motl, 2006; Thomas et al., 2018). Model fit statistics for the CFA models are presented in Table 2. Furthermore, a detailed overview of the two-factor and bi-factor solutions can be found in Tables 3 and 4.
Summary of Model Fit Statistics for CFA Models.

Note. CFA = confirmatory factor analysis; CFI = comparative fit index; CI = confidence interval; RMSEA = root mean square error of approximation; SRMR = standardized root mean square residual; TLI = Tucker–Lewis Index.
Standardized Factor Loadings, R2 Values, and Items to Scale Correlations for the Two-Factor Solution.
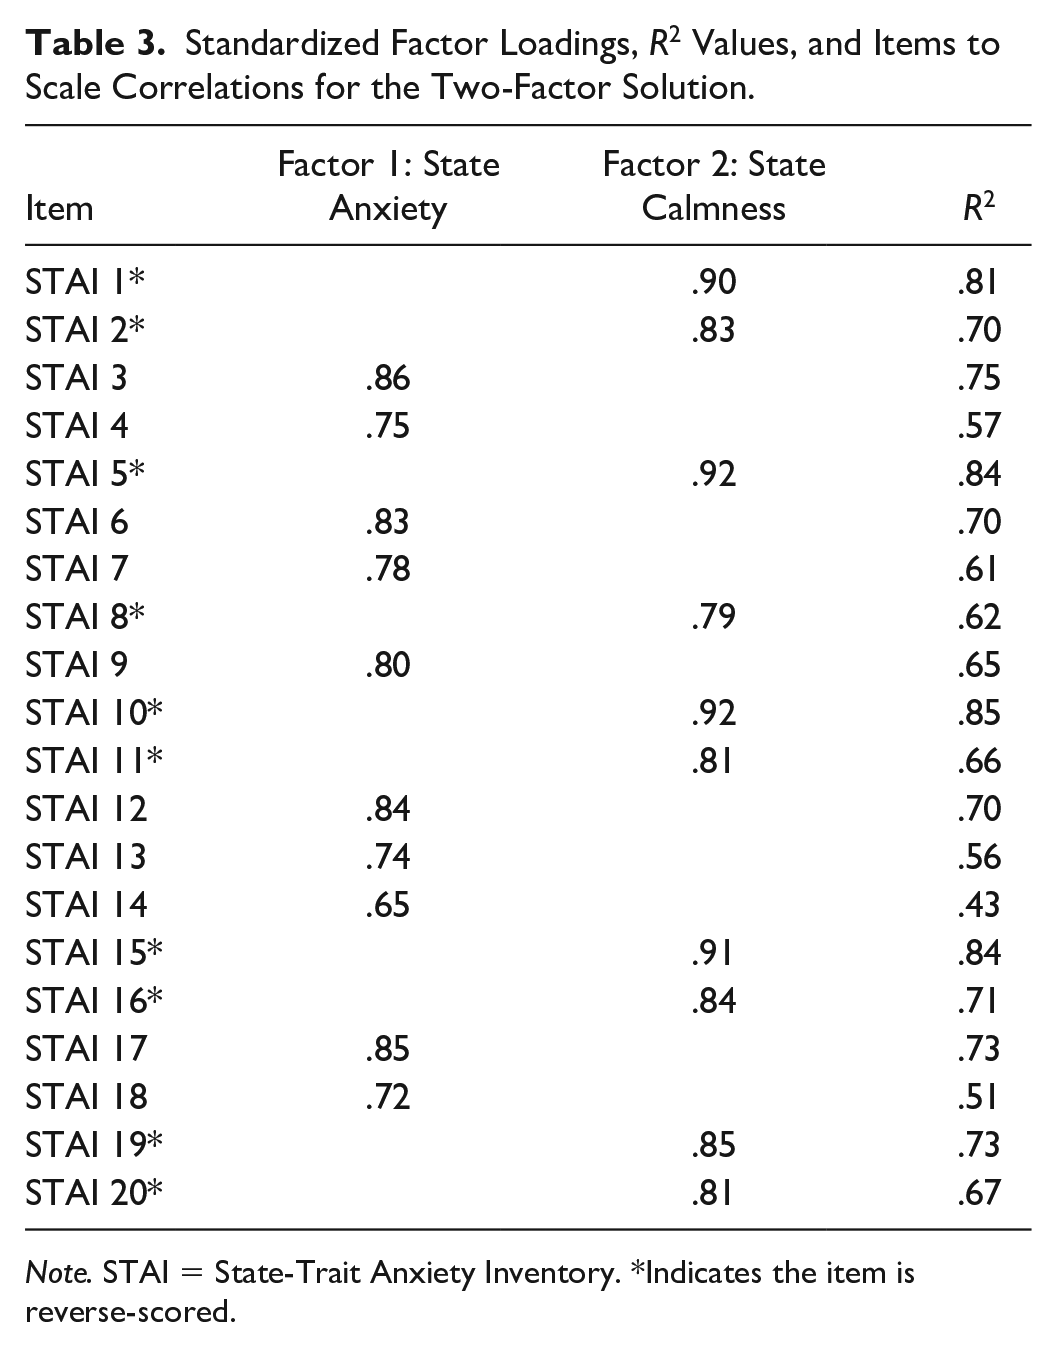
Note. STAI = State-Trait Anxiety Inventory. *Indicates the item is reverse-scored.
Standardized Factor Loadings and Item R2 Values for the Bi-Factor Solution (DWLS).

Note. DWLS = diagonally weighted least squares; STAI = State-Trait Anxiety Inventory; *Indicates the item is reverse-scored.
Concurrent and Divergent Validities
We also conducted a series of correlational analyses to investigate the concurrent and divergent validity of the distinct factors identified in the optimal factor solution described earlier (see Table 4). Our results indicated that levels of State Anxiety were positively associated with negative affect and cognitive test anxiety. Interestingly, correlational analyses indicated that State Anxiety was not associated with self-reported positive affect. Furthermore, correlational analyses indicated that State Calmness shared a negative association with negative affect and cognitive test anxiety and a positive association with positive affect scores (see Table 5).
Bivariate Correlations Among State Anxiety, Depressive Symptoms, Cognitive Test Anxiety, Negative Affect, and Positive Affect.

Note. Negative polarity items were NOT reverse-scored to support the interpretation of relationships between constructs.
p < .05.
Reliability evidence
Following the identification of the State Anxiety and State Calmness factors, we calculated reliability indices to determine the internal consistency of these unique constructs. Specifically, we calculated reliability coefficients based on polychoric correlation matrices that provide more accurate estimates of internal consistency than standard reliability statistics—such as Cronbach’s α—when applied to ordered categorical data (Gadermann et al., 2012). Results of our reliability analysis indicated that both the State Anxiety (Ordinal α = .94 and Ordinal ω = .95) and State Calmness (Ordinal Cronbach’s α = .96 and Ordinal ω = .97) factors demonstrated excellent internal consistency in the current investigation.
Discussion
Since the initial development of STAI, numerous investigations have attempted to establish the psychometric properties of the instrument. However, the results of these empirical investigations have provided contradictory evidence regarding the latent structure of the S-STAI, with some supporting a unidimensional latent structure and others endorsing a two-factor representation (Vagg et al., 1980; Vigneau & Cormier, 2008). We believe the contradictory findings noted in past research could be partly influenced by the application of measurement techniques (i.e., MLE) designed for metric data to Likert-type response items that fail to meet the requirements of continuous data. When applied to ordinal data, traditional MLE methods result in inflated Type I and Type II error, biased parameter estimates, and increase the probability of interferential errors regarding the latent structure of self-report measurement tools compared to estimation methods designed for use with ordinal data (Babakus et al., 1987; Liddell & Kruschke, 2018; Mîndrila, 2010). Therefore, the current research was designed to provide evidence of the psychometric properties of the S-STAI when applied to a group of undergraduate learners during a stress-inducing event using a more appropriate analytic procedure (i.e., diagonal WLS).
Using CFAs and an estimation method robust to the use of ordinal indicators, we demonstrated the viability of two alternative representations of the latent structure of the S-STAI, including a two-factor solution (with State anxiety and State Calmness factors) and a bi-factor solution (with general state anxiety, positive wording, and negative wording factors). Although it can be argued the bi-factor structure provided a superior fit among the tested solutions, large item loadings for both the general and the grouping factors (positive vs. polarity items) do not support a strictly unidimensional interpretation of the instrument (Reise et al., 2010). Furthermore, some have expressed concerns regarding the use of bi-factor modeling techniques to control for wording effects during psychometric investigations (Reise et al., 2016). For instance, a growing body of literature demonstrates bi-factor models have a tendency to “overfit” data, meaning the model will demonstrate an acceptable fit even in situations where an alternative factor structure better accounts for variation in participant’s responses (Bonifay et al., 2017; Reise et al., 2016; Snyder et al., 2017).
Regardless of the model that is considered optimal in the current study, our results replicate past work suggesting that the measure is likely assessing two distinct constructs that we labeled State Anxiety and State Calmness (Bados et al., 2010; Kirisci et al., 1997; Shek, 1991; Vigneau & Cormier, 2008). In addition to documenting the multidimensional nature of the S-STAI, this study also examined indicators of concurrent validity for the State Anxiety dimension. The results confirmed expectations that State Anxiety would be positively correlated with cognitive test anxiety and negative affect. In addition to being associated with both, it is telling that State Anxiety was more durably correlated with negative affect than cognitive test anxiety. This is consistent with the structure of the two comparative scales, as the PANAS is focused on negative affect “within the past week” and the CTAS-2 is focused on trait-like components of test anxiety. The finding that State Anxiety was not correlated with the positive affect construct in the PANAS at first may appear divergent with expectations but is actually consistent with prior studies relying on the Tripartite Model of Anxiety and Depression (Joiner et al., 1996). Within the Tripartite Model, anxiety is conceptualized as a mood state characterized by elevated levels of negative affect and problematic physiological reactions during situations perceived as threatening. Critically, the Tripartite Model assumes positive and negative affect are qualitatively distinct constructs and that a lack of negative affect is not necessarily indicative of the presence of positive affect or vice versa. To illustrate this, studies have shown that an absence of positive affect is not a defining feature of anxiety-related responses (Bieling et al., 1998; Tellegen, 1985; Watson, Clark, & Carey, 1988). To restate, this is the same pattern of effects for the State Anxiety factor in the current sample—State Anxiety was not correlated with the PANAS Positive Affect subscale and was positively correlated with the PANAS Negative Affect subscale. It is worth noting that the PANAS Positive Affect subscale was also not correlated with CTAS-2 or the Negative Affect subscale supporting the notion that negative/positive affect are not the end points of an emotional spectrum and instead are distinct emotional states (Russel & Carroll, 1999).
In addition to providing information about the general psychometric properties of the State Anxiety dimension of the S-STAI, our findings once again provide evidence calling into question the practical benefit of including negative polarity (i.e., reverse-scored) items on self-report instruments—which was relatively common at the time the STAI was created. Historically, psychometricians advocated for the incorporation of negative polarity items as a means of reducing acquiescence response bias among respondents (e.g., Nunally & Bernstein, 1994). However, our findings further solidify the assertion that the use of negative polarity items often generates unintended factors that are poor representations of the construct of interest (Cassady & Finch, 2014; DiStefano & Motl, 2006; Pilotte & Gable, 1990; Thomas et al., 2018; Ye & Wallace, 2014). Specifically, results showing unique associations between our State Calmness factor and other measured constructs suggest this “pseudo-factor” could be considered as an alternative situational appraisal of perceived threat and not simply the absence of anxiety. Of course, the identification of latent constructs tied to item wording is not a novel occurrence in the existing literature (DiStefano & Motl, 2006; Ye & Wallace, 2014). However, despite the widespread identification of pseudo-factors, researchers have yet to come to a clear consensus regarding how to navigate the use of negative polarity items within psychological and educational research. For instance, some researchers advocate for the removal of negative polarity items from self-report measures, as they increase the burden placed on participants while providing limited information regarding the primary construct of interest (Cassady & Finch, 2014; DiStefano & Motl, 2006). Alternatively, we believe the indiscriminate removal of reverse-scored items contributing to unintended factors without using item wording to determine the “true” nature of the construct and careful consideration of the theoretical merit and unique predictive power of the factor may interfere with our ability to investigate and understand complex psychological constructs.
We believe our findings also have clear implications for educators, educational support staff, and researchers interested in using the S-STAI to support the identification of test-anxious students who may benefit from structured support programs and those interested in using the measurement tool to determine the effectiveness of test anxiety reduction interventions. First, our findings highlight the utility of State Anxiety factor items as a measurement tool for assessing more distinct forms of anxiety. As predicted by Spielberger’s State-Trait Anxiety Model, our results indicated that individuals with increased trait cognitive test anxiety were more likely to experience increased levels of state anxiety during a simulated testing event. Furthermore, our results suggest that the ability of educators to accurately assess the severity of state anxiety during before, during, and following evaluative events could be enhanced by using a reduced version of the S-STAI that consists solely of positive polarity items.
It is important to note that the current examination had several limitations that may impact the generalizability of the findings. First, we relied exclusively on data collected from a Western, educated, industrialized, rich, and democratic (WEIRD) sample. Past psychometric investigations of the cross-cultural equivalence of self-report instruments have demonstrated considerable variation in the generalizability of factor structures identified in WEIRD samples (Doğruyol et al., 2019; Laurence et al., 2020; Owczarek et al., 2020; Zhao et al., 2020). Therefore, we encourage future work to investigate how well the two-factor solution for the S-STAI replicates in other cultural contexts. Furthermore, it is important to acknowledge that estimates of state anxiety were collected during a relatively low stakes test event—a timed assessment consisting of math and word problems. Although past work has demonstrated that highly test-anxious students experience elevated anxiety in situations absent of evaluative pressure (Cassady, 2004), future work could overcome this potential limitation by administering the S-STAI during a testing situation with higher levels of ecological validity.
Footnotes
Declaration of Conflicting Interests
The author(s) declared no potential conflicts of interest with respect to the research, authorship, and/or publication of this article.
Funding
The author(s) received no financial support for the research, authorship, and/or publication of this article.
Ethics Approval
The current study was approved by the Ball State University Institutional Review Board.