
Abstract
The Kingdom of Saudi Arabia (KSA) has set Vision 2030 to reduce the total dependency of the country oil sectors, diversifying the economy and achieving sustainable food security. This necessitated conducting this study which aimed at estimating and analyzing the association and impact of selected agricultural subsectors (dates, honey, fish, chicken, and cattle) on Agricultural Growth Domestic Product (AGDP) of KSA, and identifying the leading subsector in the economy that might substantially affect AGDP and other subsectors. Unit root test, Johansen co-integration, vector error correction model (VECM), multiple regression techniques, and impulse test were used in analyzing the secondary data that covered the period from 1985 to 2017. Results revealed the presence of long-run co-integration between designated variables. Only the coefficient of adjustment parameter for dates (as dependent variable) is negative (−5.42) and significant (critical t value = −2.52 with p = .02), meaning that the model was able to correct its past-time disequilibrium. Furthermore, short-run causality was noticed between few variables. The regression analysis results indicated the existence of positive and significant relationships between the dependent (AGDP) and each of the independent variables: cattle (0.83; p = .00), honey (50.05; p = .06), and chicken (0.07; p = .00). On the contrary, results of the impulse tests showed that the cattle subsector is leading in the economy. Accordingly, cattle, honey, and chicken subsectors should be given high priority in the government investment policy.
Introduction
The Kingdom of Saudi Arabia (KSA) is a country that contains mostly of desert acreage, with inadequate naturally arising ground water (Baig & Straquadine, 2014). It is subjected to high temperature typical of an arid climate. The country is narrowly perfect for agricultural development. With such low agriculture-favoring conditions, the KSA has successfully achieved self-sufficiency in fresh milk, wheat, eggs, some vegetables, and dates (Baig & Straquadine, 2014). Although the portion of agriculture in the national economic gross domestic product (GDP) is quite low and fluctuates (Figure 1), the fertile regions in the KSA supported adequate agriculture sector. The agriculture sector is the third major contributing sector in the GDP earnings and has furthermore contributed to the improvement of the livelihoods of the rural population (Baig & Straquadine, 2014). A study conducted by Kabir (2018) proved the existence of long-run relationship between Agricultural Growth Domestic Product (AGDP) and GDP with bidirectional causality moving from AGDP to GDP and vice versa.

Percentage of AGDP to national GDP.
The GDP measures the overall value of end products and services manufactured by a country (Özpençe, 2017). It incorporates a list of macroeconomic concepts as it represents the full employment condition of an economy. The GDP is a part of the national financial records of a country that provides an essential set of indicators that would enable policy-makers to decide whether the economy is in a state of reduction or advancement (Al-Bakr & Al Salman, 2016). The Eighth Development Plan for the Agricultural sector in the KSA focuses on increasing the role of agriculture to become the base of the economy instead of the existing base. The plan aimed at enhancing the investment capacities of the agricultural sector and emphasized the importance of the livestock subsector (FARUK, 2014). Recently, the KSA is in an alteration from dependence on the oil sector to a further diversifying economy. The agricultural sector and its value chains have given much attention in Vision 2030 as unexploited potential for growth. In fact, the sector is expected to play a leading role in the country’s economic growth.
Livestock is a crucial subsector that contributes significantly to the national GDP of KSA. The subsector serves as a store of value in the absence of formal economic institutions and other missing markets (Negassa et al., 2012).
The domestic production of poultry meat satisfies only 41% of the consumption demand of the nation. The per capita consumption of poultry meat exceeds 47 kg per person year (Hester, 2016). Regarding date production, Saudi Arabia has more than 400 date palm varieties, of which only 40 of them have an economic value (Al-Sheikh, 2009). These are found across seven provinces in the country. The growth and fruiting regime of those date palms are adaptable to the local climates of those provinces (Rahman et al., 2014).
Aquaculture production increased gradually from 6,000 tons in 2000 to around 26,000 tons in 2009 and 2010. It was followed by a fall in production to less than 16,000 tons in 2011 caused by the white spot disease, known to be an epidemic in marine shrimp, the most farmed varieties in the KSA. After a recapture to 21,000 tons in 2012, the total production added to 30,000 tons in 2015, 26% up from 2014 (Food and Agriculture Organization [FAO], 2017).
Despite the importance and huge potential of the agricultural subsectors to the kingdom economy, yet, very scant work has been conducted to identify the impact of those subsectors on the country’s AGDP. Such knowledge will help policy-makers to design sound policies and plans for improving the Saudi’s economy and achieving the kingdom vision of diversification and achieving food security.
Literature Review
Many studies analyzed the impact of agricultural sector on the GDP. For instance, Rehman et al. (2017) studied the relation between GDP and livestock production. They used Johansen co-integration test and ordinary least square (OLS) methods as analytical tools. Their results revealed that the output of fat, milk, bones, mutton, and eggs had positive and significant associations with AGDP in Pakistan, whereas the output of wool, beef, hair, hides, poultry meat and skins had negative and insignificant ones.
Another study was conducted by Rahman et al. (2014) to examine livestock sector in Bangladesh. Their results revealed that the livestock resources were relatively well distributed and stable in the country. Furthermore, the contribution of the selected sectors on the country GDP is ranging between 2.1% and 3.6%.
Another study was conducted in Romania by BĂLAN et al. (2014) with the aims of examining the relationship between the agricultural output and its determinant variables of capital and labor. They used Cobb–Douglas production function, analysis of variance (ANOVA), F test, and other analytical techniques to achieve their objectives. They argued that GDP increases due to the increment of the selected agricultural determinants. The study recommended the importance of the government investment on improved technical innovations and employees’ capacity buildings. In the same vein, Okezie and Ihebuzoaju (2017) used multiple regression techniques to analyze the effects of selected sectors (agriculture, petroleum, education, health, and telecommunication) on Nigerian GDP. Their results indicated that various sectors donated to the development of GDP and the Nigeria economy at various rates. Furthermore, contribution is expected in upcoming years leading to a speedy growth of the economy, provided an effective and sustainable policy is put in place by the government.
Sertoglu et al. (2017) studied the relationship between economic progress and agricultural sector of Nigeria. Their findings revealed the presence of long-run stable relationships between studied variables: agricultural output, real GDP, and oil rents. However, the speed of adjustment of the variables toward long-run balance is low. They stress on the government to make special financial arrangements for the agricultural sector.
On the contrary, Muhammed and Alhiyali (2018) used multivariate co-integration and autoregressive distributed lag (ARDL) model in measuring the impact of some economic variables on AGDP. They also employed the causality test to determine the direction of the relationship between the economic variables. Their research findings proved long-term effect between the AGDP index and the economic variables under consideration.
Reddy and Dutta (2018) examined the effect of different variables on AGDP in Indian during the period from 1980/1981 to 2015/2016. Their results showed that the independent variables (high-yielding variety [HYV] seeds, electricity, rainfall, and pesticides) are statistically significant in explaining the variation in AGDP.
Rehman et al. (2015) studied the impact of selected field crops on AGDP in Pakistan. They used Johansen’s co-integration test and OLS tools for analysis. Their results reveal that the outputs of cotton, wheat, and rice have positive and significant relationships with the AGDP, whereas the output of sugarcane has a negative and nonsignificant one. They recommend the introduction of innovative financial programs to enhance agricultural sector development.
Other study tested the role of dairy industry on Pakistanian economic growth for the period 1975 to 2015 (Chandio et al., 2017). Augmented Dickey–Fuller (ADF) unit root test, P-P unit root test, co-integration test, Granger causality, and OLS method were applied in the study. The results showed the presence of long-run relationship among the varirables. Furthermore, the coefficient of dairy industry production showed a positive and highly significant association with AGDP. It also showed bidirectional causality associations among the variables. Accordingly, the study recommends the importance of introducing new credit schemes.
Another study examined sector-wise share in agriculture GDP in Pakistan, using secondary data from 1998 to 2015 (Chandio et al., 2016). An economteric method was used to analyze the data. The results appeared that agricultural subsectors affect positively and significantly the agriculture GDP. The results pointed out the following recommendation: launching innovative technologies in agriculture is supplied by government so as to increase the subsectors’ share in agricultural GDP.
Other researchers studied the relationship among aquaculture capture fisheries production and economic growth in Pakistan argued the presence of positive effect of aquaculture and capture fisheries production on the economic growth. However, it is worth noting that they used ARDL in their analysis (Rehman, Deyuan, Hena, & Chandio, 2019).
It is very clear from the reviewed literature that different analytical tools were used in the analysis of the time series data related to the topic of the study. Some examples of those models are Johansen co-integration test, multivariate analysis, VECM, ARDL, ANOVA, and regression analysis. However, it is worth noting that there are specific requirements of the selection of specific model in the analysis of each study. For instance, Johansen test is the best-fit model when dealing within significant data at level but becomes significant when first differenced. VECM is usually used when co-integration exists between studied variables (Shrestha & Bhatta, 2018), like the case of this study. It is also noticed that none of the mentioned studies has covered all of the variables used in the study; likewise, none of them was conducted in KSA context.
This article aimed at examining the short-run relationships and long-run speed of adjustment between AGDP and selected agricultural subsector production (dates, honey, fish, chicken, and cattle) in KSA. It also aimed at identifying the leading subsector that might significantly contribute to the development of AGDP and other subsectors in the country.
This article is organized into four sections. The first section covered the introduction and literature review. The second section is devoted to data collection and methodology, whereas the third one is the results and discussion. Finally, the last section is devoted to the conclusion.
Materials and Method
Data Description and Study Area
The research was based primarily on secondary data, from 1985 to 2017, obtained from the FAO and aimed at estimating the contribution of selected agricultural products on AGDP (AGDP in 1000 Riyal) in the KSA. In particular, the selected products include production of date palm (D), honey (H), fish (F), chicken (Ch), and cattle (Cat) (in metric tons).
Methods of Analysis
Unit root test, Johansen tests for co-integration, error correction model, and the multiple regression models were used to discover and to assess the relation between variables using EVIEWS 9 statistical package.
Descriptive Statistics Test
To test normality series, a descriptive statistics test is run using the Jarque–Bera statistics indicator. If Jarque–Bera statistics is less than .05 level, the H0 is rejected (normal distribution), significant that the series shows non-normal distribution. Accordingly, the series is theoretical to be changed to logarithm form.
The Unit Root Test
ADF test is conducted for analysis whether we have a nonstationary time series (Dickey & Fuller, 1979). The change in variables was regressed on lagged values of variables given by the following equations:


Z = ADF coefficient to be estimated; t = time selected; α = constant;
Testing H0: X has a unit root (nonstationary), against H1: X (stationary).
The t statistic of ADF coefficient is compared with the t statistic of test critical values. If the series is stationary, acceptance of H1 of ADF statistic is bigger than the critical t value (Emam et al., 2018). EVIEWS 9 program (which was used in this study) normally adopts 1% and 5% level of significance.
Specification of Lag
A maximum lag number is identified and considered in the co-integration test. Different standards can be used in choosing the lag orders: Akaike information criterion (AIC) is the most widely used model (Emam et al., 2018). AIC is the best model in lag selection when dealing small samples (less than 60; Liew, 2004).
Johansen Tests for Co-Integration
Johansen tests, namely eigenvalue and trace tests, are used for testing co-integration. For both tests, the null hypothesis of no integration was examined against co-integration. However, the two tests are different in alternative hypothesis. Hence, the maximum eigenvalue examines the biggest eigenvalue in relation to the following largest value which is zero. The test statistics is specified by the next equation (Emam et al., 2018):

The trace test examines whether the rank of matrix Π is equal to r0, in particular, tests the null hypothesis rank (Π) = r0, against the alternative hypothesis r0 < rank (Π) ≤ n,n represents the maximum number of co-integrating vectors (Baig & Straquadine, 2014). The following equation is used to calculate the likelihood ratio (Emam et al., 2018):

VECM
The ECM explores the degree of short-run dynamics of equilibrium and the implications of short-run performance, one or more variables changes to return stability, where short-run equilibrium variation is required to preserve long-run relations. The following equation was estimated (Dhungel, 2014):


where AGDP = Agricultural Gross Domestic Product, and production of the followings in metric ton: D = date; H = honey; F = fish; Ch= chicken; Cat = cattle.
For short-run causality from independent variables to dependent variables, coefficient bs should be individually statistically significant. α1t . . . α6t represent the speed of adjustment parameter, which indicates how fast the previous moves back toward the equilibrium and indicates long-run causality from independent variables to dependent variable market (
Regression Analysis
Multiple regression model analysis was applied to estimate the influence of agricultural products’ AGDP using the following specification:

where all variables were identified previously.
Equation 11 can be rewritten as follows:

where
Results and Discussion
Descriptive Statistics
The results of descriptive statistics record that the probabilities of Jarque–Bera statistics are more than .05 levels for all variables, concluding that the variables appeared normal distribution (Table 1). Data are used directly without transformation.
Descriptive Statistics.

Note. AGDP = Agricultural Growth Domestic Product.
The Unit Root Tests Results
After the first difference for all series, ADF statistics are significant at 1% level, concluding that AGDP, date, honey, fish, chicken, and cattle are stationary (Table 2).
The Results of Augmented Dickey–Fuller Test.

Source. Authors’ calculations are based on collected data. Critical value at 5% and 1% level of significance represented by * and **, respectively.
Note. AGDP = Agricultural Growth Domestic Product.
Identification of Lag Number
Lag 1 was chosen by the VAR model as shown in Table 3.
Lag Number (VAR Model).

Source. Own calculations based on collected data.
Note. AIC = Akaike information criterion; SC = Schwarz; HQ = Hannan-Quinn; FPE = Final Prediction Error; LR = Sequential test; VAR = vector autoregressive.
Significant at 5% level.
Results of Co-Integration Test
Johansen multivariate co-integration results are presented in Tables 4 and 5. Trace and Max eigenvalue statistics indicated two co-integrating equations at the .05 level and no co-integrating equations, respectively. Therefore, there is a long-run connection between AGDP, date, honey, fish, chicken, and cattle.
Johansen Co-Integration Test Results: Trace Statistic (Lag Interval in First Differences).

Source. Data were collected and analyzed.
Note. Trace statistic test shows two co-integrating equations at the .05 level. CE = co-integrating equation.
Rejection of the null hypothesis at 5% level of significance; * represent 5% level of significance.
Johansen Co-Integration Test Results: Max-Eigen Statistic (Lag Interval in First Differences).

Source. Data were collected and analyzed.
Note. Max eigenvalue tests show no co-integrating equation(s) at the .05 level. CE = co-integrating equation.
Represent 5% level of significance.
Results of VECM Test
The VECM is able to correct its past-time disequilibrium when the coefficient of adjustment parameter is negative and shows significance. The coefficient of adjustment parameter for D (as dependent variable) is negative (−5.42) and significant (critical t value = −2.52 with prob. = .02), meaning that model is able to correct its past-time disequilibrium. Also, the results convey that the coefficients of adjustment parameter for other variables (when acting as dependent variable) were statistically insignificant, concluding that the model may be needed more than 1 year to correct its past-time disequilibrium (Table 6).
Results of VECM.

Source. Data were collected and analyzed. Numbers between parentheses and brackets are t value and probability, respectively.
Note. VECM = vector error correction model; AGDP = Agricultural Growth Domestic Product; ECM = error correction model; LM = Lagrange Multplier test.
For short-run equilibrium analysis, the relationship between AGDP (dependent) and Ca in one lag period (independent variables) conveys the existence of positive and statistically significant coefficients (coefficient = .15; t value= 3.03 with prob.= .006). However, the short-run equilibrium between D (dependent) and Ch in one lag period (independent variable) reveals a negative and statistically significant one (coefficient = −1.388; t value = −3.57 with prob. = .002). Such results indicate the presence of short-run equilibrium between studied variables.
Also, short-run coefficients (−23.16 and 0.54, respectively) were statistically significant (t value = −4.57 with prob.= .000 and 3.47 with prob. = .002, respectively) between Ch (dependent) and AGDP and Ch (independent variables in one lag period), concluding that there is short-run equilibrium. Short-run coefficient (−0.07) was statistically significant (t value = −3.29 with prob. = .003) between Cat (dependent) and Ch (independent variable in one lag period), meaning that there is short-run equilibrium. To fix VECM adequacy, serial correlation of residuals was tested by the LM test. LM-statistics (lag 1) = (42.54 with prob. = .210). According to the result of LM test, the null hypothesis of no serial correlation of residuals will be accepted.
Regression Analysis Results
Results indicated no autocorrelation between successive values of the disturbance term which has a constant variance (homoscedastic; Table 7).
Regression Analysis Results (AGDP Dependent Variable).

Source. Own calculations based on collected data.
Note. AGDP = Agricultural Growth Domestic Product.
and ** significant at 1% and 10%, respectively.
A CUSUM test was conducted to detect the stability of the cumulative sum of the recursive residuals (Figure 2). The test finds whether a factor is steady if the cumulative sum is found in the area among the two critical lines, concluding the stability of the model (Zhai et al., 2013). Accordingly, to mention results, the linear regression model was chosen. The result suggested that the estimated model is significant and was used to estimate the contributions of independent variables (date production, honey, fish, chicken, and cattle) on AGDP. The estimated equation can be written as follows:


CUSUM curve.
R2 is a statistical measure that was used to evaluate the goodness of appropriateness of the regression model (Behnassi et al., 2019).
From the table, R2 value indicated that 94% of the variations in AGDP are explained by the selected agricultural products. The value of F statistics illustrates a highly significant level for the model. It is concluded that the independent variables are jointly essential in explaining the variation of AGDP during the study period.
The coefficients of H, Ch, and Cat are positive and significant in elucidating the variability of the AGDP. These findings come in line with other study which argued that beef production recorded a positive significant effect on Pakistanian AGDP (Rehman, Deyuan, & Chandio, 2019). Results also indicate that any 1-ton increase in production of H, Ch, and Cat will increase AGDP by 50.05, 0.07, and 0.83 (1,000 Riyal), respectively. In addition, any 1-ton increase in D will decrease AGDP by 0.02 (1,000 Riyal). Also, the result recorded that the H coefficient was positive and significant at 10% level of significance. These positive results coincide with findings of Rehman et al. (2017).
Results also revealed that the coefficient of D is negative and greatly significant in clarifying the inconsistency of the AGDP and this result may be due to the fact that the KSA donates large quantities of dates throughout the world, especially during Ramadan. On the contrary, the F coefficient has a positive sign; however, it is insignificant.
Impulse response analysis is considered as an essential step in econometric analyes that used to describe the response of a model’s variables to a shock in one or more variables (Mohr, 2020). The impulse model was employed in this study to identify the leading subsector that might significantly contribute to the development of other agricultural subsectors in the long run (Figure 3). The figure reflects the response of AGDP, date, honey, fish chicken and cattle to Cholesky one standard deviation innovation impulse of each AGDP, date, honey, fish, chicken or cattle. Results revealed that AGDP showed positive response in the long run to cattle and fish subsectors. The date subsector showed positive response to AGDP and the honey and chicken subsectors; the honey subsector showed positive long run reply to one standard deviation impulse of each of the AGDP, date, and fish subsectors; the fish subsector showed positive long-run reaction to one standard deviation impulse of the chicken subsector; and the chicken subsector showed positive long-run answer to one standard deviation impulse of date subsector.
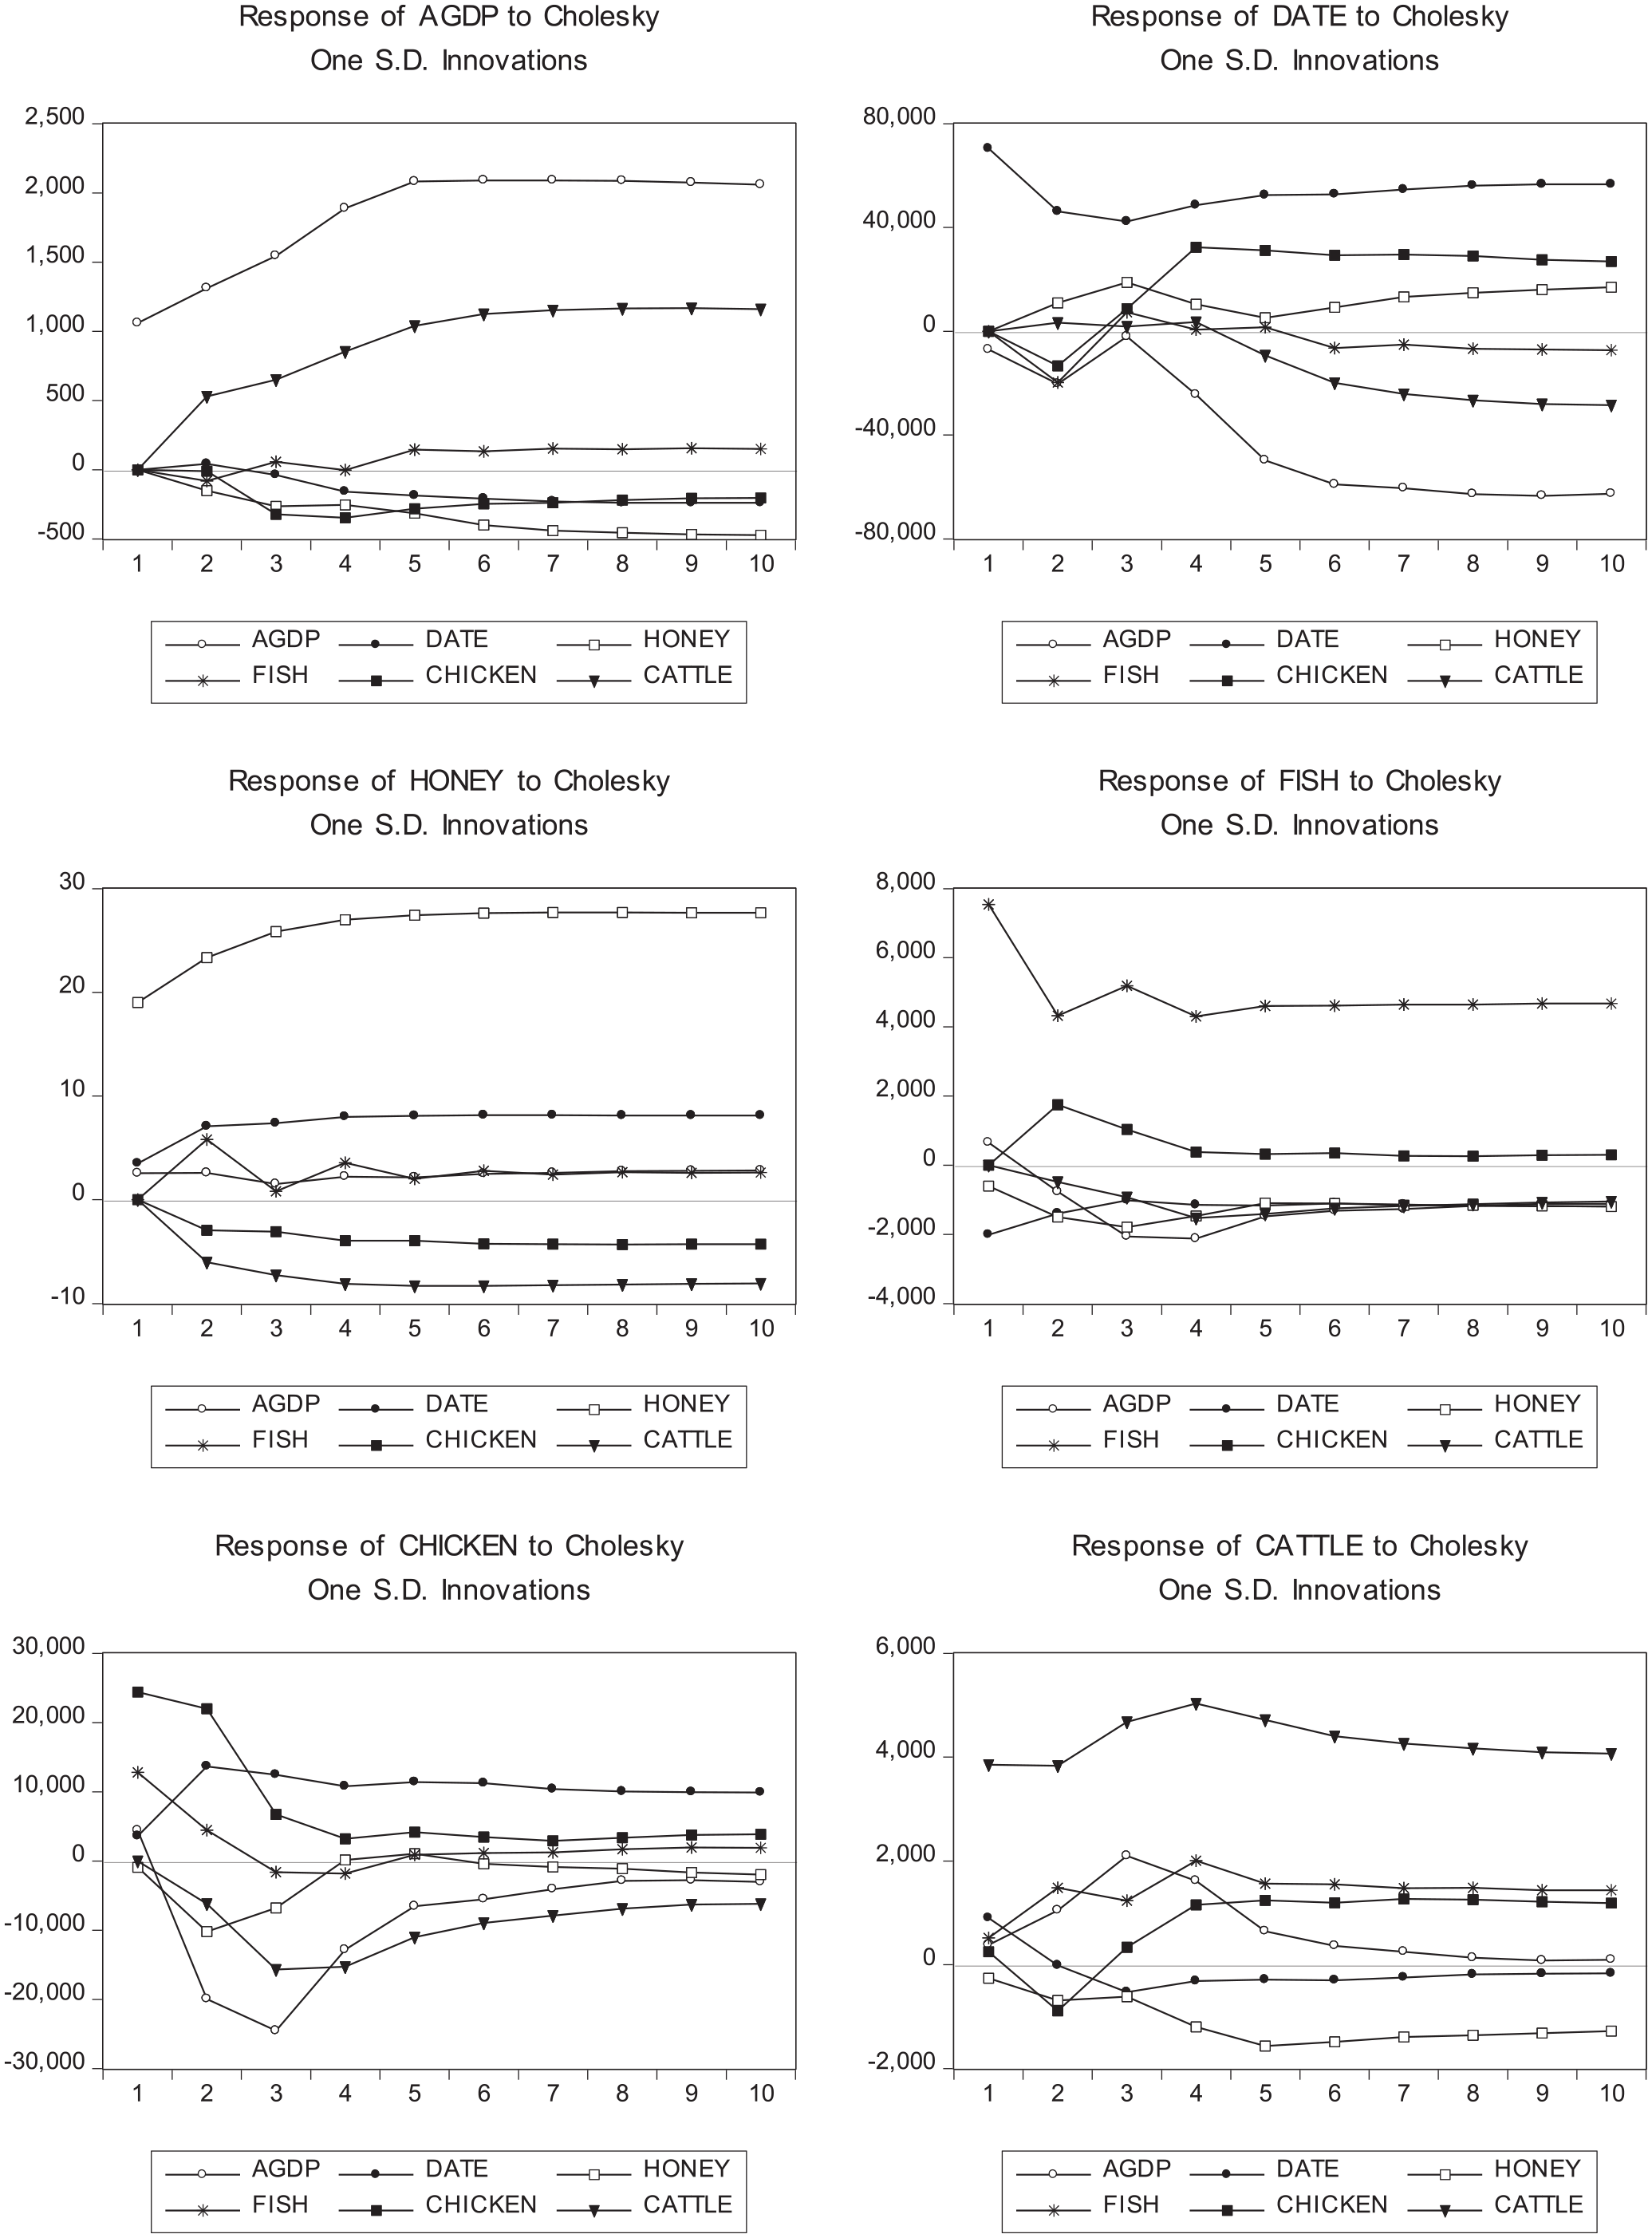
Impulse curve.
Finally, the cattle subsector showed positive long-run retort to one standard deviation impulse of each of the AGDP, cattle, date, and chicken subsectors. Each sector appeared to have a positive long-run comeback to some other sector; among them, the cattle sector recorded positive long-run reply to one standard deviation impulse to a majority of sectors (AGDP, cattle, date, and chicken). These results conclude that the cattle sector may be considered the leading sector.
Conclusion
Results of the study reveal the presence of long-run co-integration between selected variables. The coefficient of adjustment parameter for dates (as dependent variable) is negative (−5.42) and significant (critical t value = −2.52 with prob. = .019), meaning the model is able to correct its past-time disequilibrium. In addition, short-run causality was noticed between few variables in the study. The multiple regression analysis indicates the existence of significant and positive relationships between the dependent (AGDP) and the honey, chicken, and cattle (independent variables), except for date. In addition, the coefficient of date is negative and highly significant in explaining the variability in the AGDP. The negative relationship might be attributed to the fact that KSA donates huge quantities of dates especially during Ramadan all over the world. On the contrary, the impulse examinations indicate that cattle sector has positive long-run response to one standard deviation impulse to a majority of sectors (AGDP, cattle, dates, and chicken). The study concludes that the cattle sector might be considered as the leading subsector in the economy. Hence, it is very important to encourage the investment in the cattle, honey, and chicken subsectors to enhance the contribution of the agricultural sector in the KSA economy, thus achieving Saudi Vision 2030 of diversification. It is also recommended to conduct further studies on the impact of other economic subsectors on GDP.
Footnotes
Acknowledgements
The authors acknowledge the Deanship of Scientific Research at King Faisal University for the financial support under Nasher Track (Grant 186314).
Declaration of Conflicting Interests
The author(s) declared no potential conflicts of interest with respect to the research, authorship, and/or publication of this article.
Funding
The author(s) disclosed receipt of the following financial support for the research, authorship, and/or publication of this article: The authors received financial support for the research (the Deanship of Scientific Research at King Faisal University-Naher Track Grant 186314.