
Abstract
The Gold futures market is a complex nonlinear system with the prediction of the futures prices of gold, one of the core issues faced by investors. Compared with more traditional approaches, empirical mode decomposition (EMD) and artificial neural network are the more powerful tools with which to deal with nonlinear and nonstationary price problems. By introducing mirroring extension (ME), EMD, Cuckoo Search (CS) algorithm, and Elman neural network, this article constructs the mirroring extension empirical mode decomposition (MEEMD)-CS-Elman model to forecast the price of gold futures using gold future AU0 price data from August 29, 2013, to October 18, 2018, at the Shanghai Futures Exchange (SFE) in China. Empirical results show that Elman combined with EMD is superior to single Elman in performance. Moreover, there exists an obvious endpoint effect by applying EMD to the price of AU0. By introducing the ME method, the endpoint effect can be dealt with better. Furthermore, by introducing the CS algorithm to optimize the initial weights and biases for Elman, the constructed MEEMD-CS-Elman model achieves far more accurate prediction results compared with either the EMD-Elman or the MEEMD-Elman model in terms of performance criterion: mean absolute difference (MAD), mean absolute percentage error (MAPE), root-mean-square error (RMSE), and directional symmetry (DS). In particular, the DS indicator, which reflects rising and falling prices, tends to be more attractive for investors. The value of the DS indicator in the MEEMD-CS-Elman model reaches 0.75207, meaning that the proposed model predicts the directions of increasing and falling prices quite precisely. Hence, by applying the proposed model, investors can make more scientific and accurate decisions and better reduce their investment risks.
Keywords
Introduction
Gold, like stocks and bonds, has the functions of hedging and investment in its financial nature. Therefore, the gold price forecasting is significant in influencing the decision making of investors and helping support the national economic policy and the national economic development plan. Because futures price has the characteristics of nonlinearity, chaos, and a long history (Wu & Duan, 2017), many previous studies have focused on comparing the accuracy of various models in price forecasting. Generally, time-series models and their combined approaches are widely used in the analysis and prediction of prices (Batten & Lucey, 2010; Xu, 2017, 2018, 2019a, 2019b, 2020). Compared with traditional methods, however, intelligent computing models, which are better and more powerful tools to deal with such problems, have been proposed to predict the price. This article approaches the prediction of gold futures prices by using intelligent computing models to maximize the reduction of investors’ investment risk.
For price forecasting, several individual and combined models are highly applied. Autoregression moving average (ARMA) models, a mixture of autoregression (AR) and moving average (MA), are quite common. They have the characteristics of wide application and small prediction error, despite they might ignore other relevant information that is important to predict (Gülerce & Ünal, 2017; Xu, 2017, 2018, 2020). The vector autoregression (VAR) and vector error correction models (VECMs) cover these kinds of information (Baumeister & Kilian, 2012), but the choices of modeling strategies are vague (Allen & Fildes, 2005). Autoregressive conditional heteroskedasticity (ARCH) model is great at forecasting the volatility by reflecting the variance changes intensively (Engle, 1982). However, it is not convenient with the strict restrictions on parameters. To deal with such problems, Bollerslev (1986) developed generalized autoregressive conditional heteroskedasticity (GARCH) model in 1986. The issue with that is the failure to catch the information on returns that might influence the degree of fluctuation. Therefore, GARCH-class models have been investigated (Y. Lin et al., 2020; Marchese et al., 2020). Comparatively, the combination models are superior to the individual models. They describe the change rule of time-series data better and diversify against the uncertainty (Xu, 2020). Combined models contain the previous best forecast, equal-weighted average, inverse mean-squared error, least-squares estimates of combination weights, bias-adjusted mean, shrinkage, and odds matrix approach (Capistrán & Timmermann, 2009). In practice, Xu has used the above seven models plus three variations of the least-squares estimates of combination weights method and two of the shrinkage to forecast the corn cash prices (Granger & Ramanathan, 1984; Xu, 2020).
Even though time-series models are widely used in prediction, intelligent computing models are better than them. Blaschke proved this by comparing the autoregressive integrated moving average (ARIMA) model with neural network model, and it turned out that the effectiveness of neural network was better (Blaschke et al., 2018). Adebiyi et al. (2014) tested the prediction effect of traditional ARIMA model and artificial neural network (ANN) model through the stock data of New York Stock Exchange, and they found ANN has superior performance. The reason why intelligent computing models work better is that they are handling a data series with noisy well, which is difficult for traditional models (Hamid & Iqbal, 2004). Aside from that, time-series models put forward a problem in the first step, which is difficult to identify the suitable model and the appropriate order specification. Intelligent computing models do not depend on the assumptions regarding the data, but adapt to the data (Hamid & Iqbal, 2004).
Intelligent computing models are often based on ANNs. ANNs make it easier to deal with incomplete, uncertain, or irregular data, which imply that the capability of function approximation is extremely effective. The effectiveness of different ANNs has been studied (Guresen et al., 2011); for example, single Elman neural networks (ENNs) have been applied in China to forecast the price of gold futures at the Shanghai Futures Exchange (SFE) and achieve better results (Wu & Duan, 2017). To achieve better performance, some scholars have also combined ANN with other methods to deal with asset price prediction problems. For example, ANN, combined with the GARCH model, has been developed where the performance of the ANN-GARCH model is better than the GARCH model alone in predicting fluctuations in both gold spot price and futures prices (Kristjanpoller & Minutolo, 2015). ANN, integrated with text mining, also improved predictions. This was because a number of nonquantifiable factors, such as terrorist attacks, weather, and war, could be dealt with in this model (Chen et al., 2016).
Those combined models, which obtain better forecasting results, provide us with a way of improving the performance of single models in analyzing and predicting financial time series. Fortunately, this approach has been proven by Krogh and Vedelsby (1995). Their research suggested that when each single model is both accurate and diversified enough in a combined model, the combined model is better at forecasting than the single model itself. In general, the structure of a combined model for forecasting is divided into two parts: One is an analysis of time series and the extraction of characteristics; the other is the establishment of a prediction and calculation model based on these characteristics, where these characteristics are regarded as the input and the future trend the output. Looking at the problem of signal analysis in a general time series, a Hilbert–Huang transform (HHT) was proposed by Huang et al. (1971) at NASA in 1998. This is an empirical, nonparameterized, and complete analysis method for nonlinear and nonstationary data, which takes into account both time and frequency domains. The empirical mode decomposition (EMD) algorithm and the Hilbert transformation are the main processes. With EMD, any complex signal can be decomposed into a limited number of intrinsic mode functions (IMFs). These IMFs perform the Hilbert transformation well, reflecting each local oscillation structure for the original data such that the Hilbert spectrum has better time–frequency characteristics.
Since the EMD method was put forward, it was initially used to predict financial time series, such as in crude oil and foreign exchange (C.-S. Lin et al., 2012; Yu et al., 2008). Hence, compared with using single ANN to analyze and forecast, the use of “EMD + ANN” is more effective. Indeed, this kind of combined model has recently been applied to solve problems in several fields. The most widely used field is in finance. C. Zhang and Pan (2015) proposed the hybrid model to test the historical data of stock indexes in the United States and the United Kingdom, and got the better prediction results. Dhanya compared EMD-ANN model with support vector regression (SVR) and ANN models, and found that EMD-ANN model was more accurate for short-term prediction of U.S. stock index (Jothimani et al., 2016). Yu Lean proved the effectiveness of EMD-based neural network ensemble learning methodology by forecasting the spot price of world crude oil (Yu et al., 2008). In general, the superiority of this kind of paradigm in the financial communities has been confirmed by more and more scholars (Pan et al., 2017; Shi & Zhuang, 2019; Wei, 2016). Meanwhile, the model is applied to the power domain. Wang used this method to predict the wind speed of power generation efficiently (Wang et al., 2016). Wang and Luo mentioned that the introduction of EMD-based model into the field of electricity loading has improved the accuracy of prediction (Jun et al., 2018). In addition, the validity of this hybrid model has been proved in other fields, such as meteorological science and fault diagnosis (Li et al., 2018; Shrivastava & Singh, 2018; J. Zhang et al., 2018; X. Zhang et al., 2018). However, there is little literature associated with the forecasting of gold futures prices using this improved method. Wu and Duan (2017) used to apply single Elman to predict the price of gold futures AU0, but without EMD, the accuracy of prediction results is lower.
However, almost all of the literature has not noticed that the EMD method itself has a congenital defect, that is, the endpoint effect in which decomposition results, corresponding to the endpoints of the time series, are unstable. Therefore, the majority of the published papers related to those financial forecasting models that are based on the EMD method imply that the models become unreliable due to this congenital defect. In addition, for ANN, the initial weights and biases are randomly given according to a specified distribution. However, these random initial weights and biases are not optimal in most cases so that may reduce the prediction accuracy of ANN. The work of this article is to attempt to deal with these problems.
The contributions of this article are mainly divided into the following aspects. First, since the gold futures market at the SFE was only established in China in 2008, it is still an emerging market when compared with the stock market. Therefore, our research contributes to enriching the existing research on the price of gold futures at the SFE. Second, both the EMD and the ENN methods were introduced for forecasting the trend of gold futures prices using gold futures price data from August 29, 2013, to October 18, 2018, at the SFE in China. Third, we examine that, in the gold futures market, whether there is an obvious endpoint effect to applying the EMD such that the predictive capability is quite poor in a small area of endpoints. Fourth, to deal with the endpoint effect problem, the mirroring extension (ME) method is introduced; this improves the predictive accuracy. Fifth, by introducing the Cuckoo Search (CS) algorithm to optimize the initial weights and biases of the ENN, the predictive accuracy is improved. The rest of this article is organized as follows. The “Model Formulation” section formulates the model. The “Empirical Analysis” section presents the empirical analysis. The “Discussion” section discusses the validity of the model, and the “Conclusion” section concludes the article.
Model Formulation
In this section, we first present the EMD and the ME methods which are appropriate to deal with the endpoint effect of EMD. Second, the ENN and the CS algorithm, with which the ENN can be optimized, are presented. Finally, based on those methods, the mirroring extension empirical mode decomposition (MEEMD)-CS-Elman model is constructed.
The Analysis of EMD and ME Method
EMD method analysis
EMD developed by Huang et al. (1971) is an effective tool to deal with nonlinear and nonstationary time series, a fundamental part of the Hilbert–Huang transformation. The key to the EMD method is to determine the interpolation method. In general, the cubic spline interpolation is preferred as the interpolation method. The main advantage of EMD is to enable the complex signals to be decomposed into a limited number of independent and orthogonal stationary IMFs, which approximate a normal distribution. The decomposed IMF contains the eigenvalues of the signals with different frequency fluctuations in the original signal. The IMF must satisfy the following conditions:
The number of both extreme points and zero-crossing points are the same or the maximum difference is one.
The upper envelope and lower envelope are locally symmetric about the time axis.
Given an original signal
To identify all the locally maximum and minimum points for original signal
By applying cubic spline interpolation algorithm, all the locally maximum and minimum points are fitted to the upper envelope
To calculate the mean value denoted by

To obtain the candidate

To examine whether
To obtain the residue

The residue

When

where

Flowchart of screening process for EMD algorithm.
ME method
In the EMD method, to obtain the instantaneous average envelope of the signal, the local maximum and minimum values of the original signal need to be fitted by the cubic spline interpolation algorithm; then the local mean value of the signal can be calculated. Because both ends of the signal cannot be at the maximum and minimum points at the same time, the upper and lower envelopes inevitably deviate at both ends of the data signal, and this deviation phenomenon will gradually spread to the signal interior with the progress of EMD, which seriously affects the quality of signal decomposition and the phenomenon is called endpoint effect (Zeng & He, 2004).
The essence of ME method is to symmetrically extend the original signal into a closed ring signal. This ring signal has no endpoints, and its upper and lower envelopes are determined entirely by the inside of the signal itself, thus avoiding the endpoint effect fundamentally (Flandrin et al., 2004).
The endpoint effect can be remarkably improved by applying ME method and the EMD being improved by ME method is called MEEMD in this article.
An Improved ENN Based on the CS Algorithm
This section first presents the ENN. Then, to identify the optimal initial weights and biases of the ENN, the CS algorithm is introduced to search for the optimal initial weights and biases.
The analysis of ENN
ENN, developed by Elman (1990), is a typical feed-forward neural network that is widely applied. It is also a typical dynamic recurrent neural network. It adds a context layer to the hidden layer on the basis of the basic structure of back propagation neural network. As a one-step delay operator, the ENN achieves the purpose of memory, and thus the system has the ability to adapt to time-varying characteristics; it enhances the global stability of the network. There is more effective computational ability than feed-forward neural network and it can also be used to solve the problem of fast optimization.
In general, the structure of the ENN is divided into four layers: input layer, hidden layer, context layer, and output layer. The connection between the input layer, hidden layer, and output layer is similar to that of a feedback neural network. The input layer only acts as a signal transmission unit, and the output layer plays a weighting role. The hidden layer elements have two kinds of activation function: linear and nonlinear. In general, nonlinear sigmoid function is taken as the activation function. The context layer is used to memorize the output value of the hidden layer unit at the previous moment and can be considered as a delay operator with one-step delay. The output of the hidden layer is connected to the input of the hidden layer through the delay and storage of the connection layer, making it sensitive to historical data. The addition of the internal feedback neural network enhances the ability of the network itself to process dynamic information to achieve the purpose of dynamic modeling.
Let the weight matrix of input, context, and output be

where

The structure of ENN.
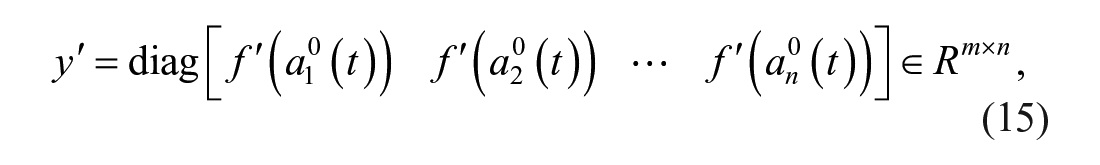
The output vector is obtained according to the following equations:


Therefore, the complete input weight matrix can be defined as

So, the output corresponding to complete input x(t) in Equation 6 is as follows:


The error function, called the loss function for the ENN, is defined as

where
Then, the standard learning process of the ENN is shown below:
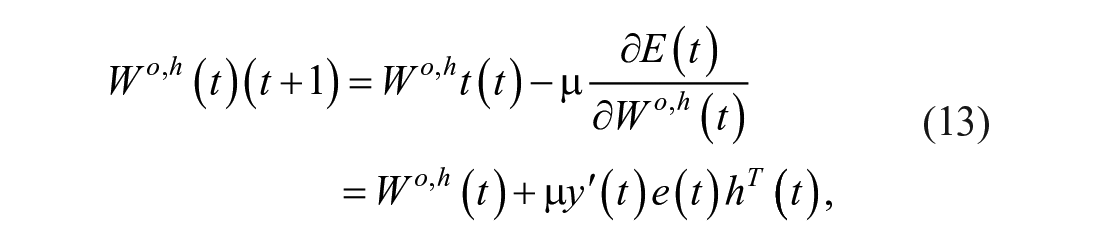

where

and µ is the learning rate.
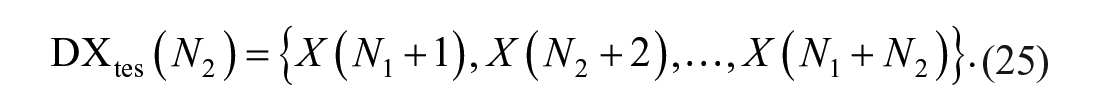
Next, the training and test process for the ENN is presented. Assume that there is a financial time series denoted by

To train and test the ENN, the entire data set should be segmented into a training data set and a test data set. The training data set is used for the training model. Fundamentally, the process of the training network is used to approximate the functional relation in Equation 17. Denote training data set by {p(t)}1≤t≤N1, where


By using matrix
The analysis of the CS algorithm
It is necessary to point out that when you implement the ENN, you first should initialize the weights and biases. However, these weights and biases are given randomly according to a certain distribution, meaning that these are not optimal in most cases. Therefore, the predictive capability of the ENN could be affected. Therefore, to achieve better accuracy, the initial weights and biases must be optimized. Taking into account of the optimization capability of the CS algorithm, this article applies it to optimize the initial weights and biases.
The CS algorithm is a new heuristic algorithm based on swarm intelligence technology and is an efficient algorithm used to solve the optimization problem by simulating the parasitic brood parasitism of some cuckoo species (Yang & Deb, 2009, 2010, 2014). In addition, the CS algorithm can be enhanced by the so-called Lévy flight, rather than a simple isotropic random walk. Existing research shows that the algorithm is probably more effective than the genetic algorithm, the particle swarm optimization (PSO) algorithm, and other algorithms.
To describe the CS algorithm simply, we introduce the following three idealized rules.
Each cuckoo randomly selects one nest and lay one egg each time.
The nest with the highest quality egg is kept for the next generation.
The number of host nests
In the CS algorithm, each egg in the nest represents a solution and the cuckoo’s egg represents a new solution. The goal is to replace the bad solution in the nest with a new solution or a potential better solution.
To set the number of nests at
To keep the last optimal nest location

where

After the location is updated, a number

where
Finally, a better set of bird nest positions
In this way, a group of new nest locations are obtained. The nest locations of this group are then tested, replacing those of the previous generation
3. To find out the optimal bird nest position
By using the CS algorithm to optimize the initial weights and bias of the ENN, this model is called CS-Elman model.
The Construction of MEEMD-CS-Elman Model
In this section, by using the MEEMD and CS-Elman methods, an MEEMD-CS-Elman prediction model is constructed that is able to deal with the prediction issue of gold futures prices. Based on how the market performs, the model needs to constantly learn to evolve. In general, we take long enough historical data and determine the time frame of the data. In this article, we focus on the closing price of each trading day. Any time point

Let the training data set and the test data set be

By applying the MEEMD approach for each element in
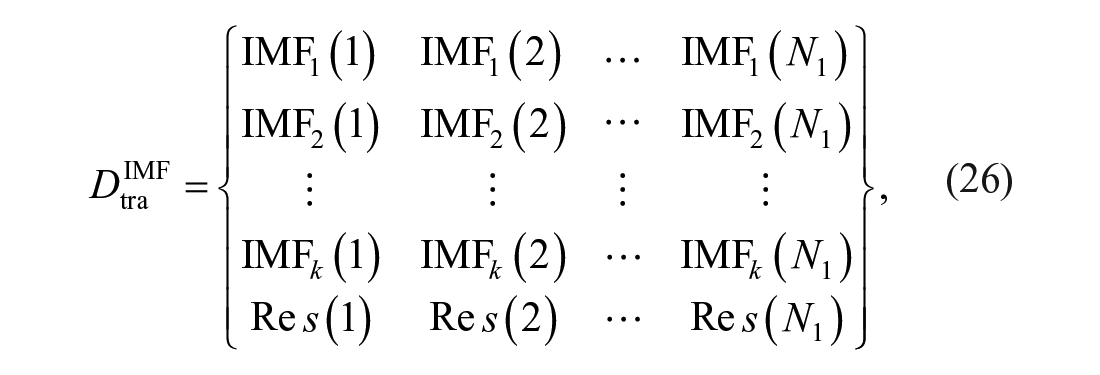

where
Next, we first apply CS-Elman to model the


By using Equations 18 and 19, the prediction values

Accumulating matrices in the direction of columns, the prediction values

Then, by comparing with X (N1 + T), X (N1 + T +1),...,X (N1 + N2), the accuracy can be presented.
The steps for the proposed model are shown in Figure 3.

Flowchart of MEEMD-CS-Elman model.
Empirical Analysis
Data Descriptive Statistical Analysis and Parameter Setting
The data range is from August 29, 2013, to October 18, 2018, at the SFE in China. Training data are from August 29, 2013, to October 10, 2017, amounting to 1,000 pieces of data. Test data are from October 11, 2017, to October 18, 2018, amounting to 250 pieces of data. The closing price of gold futures AU0 in each trading day is used in the empirical analysis. The statistical analysis of the data is shown in Table 1. Basic parameters are set as shown in Table 2. The trend of closing prices is shown in Figure 4.
Descriptive Statistics of Data Set.

Parameter Setting.

Note. ME = mirroring extension; CS = Cuckoo Search; ENN = Elman neural network.

Price trend of gold future AU0 at the SFE.
To verify the validity of the proposed model, several performance functions are introduced. These are the mean absolute difference (MAD), the mean absolute percentage error (MAPE), the root-mean-square error (RMSE), and the directional symmetry (DS), respectively. The calculation formulas of these performance functions are listed in Table 3. Among them, MAD, MAPE, and RMSE are used to evaluate prediction errors. The smaller the three performance indicators are, the closer the prediction value is to the actual value, meaning that the error between actual value and predictive value is smaller. The performance indicator DS gives the correct rate for forecasting price directions. It is necessary to point out that investors are more concerned about whether the price of gold future is rising or falling, and less about the specific forecast value. Therefore, DS seems to be more significant.
Performance Criterion Function.
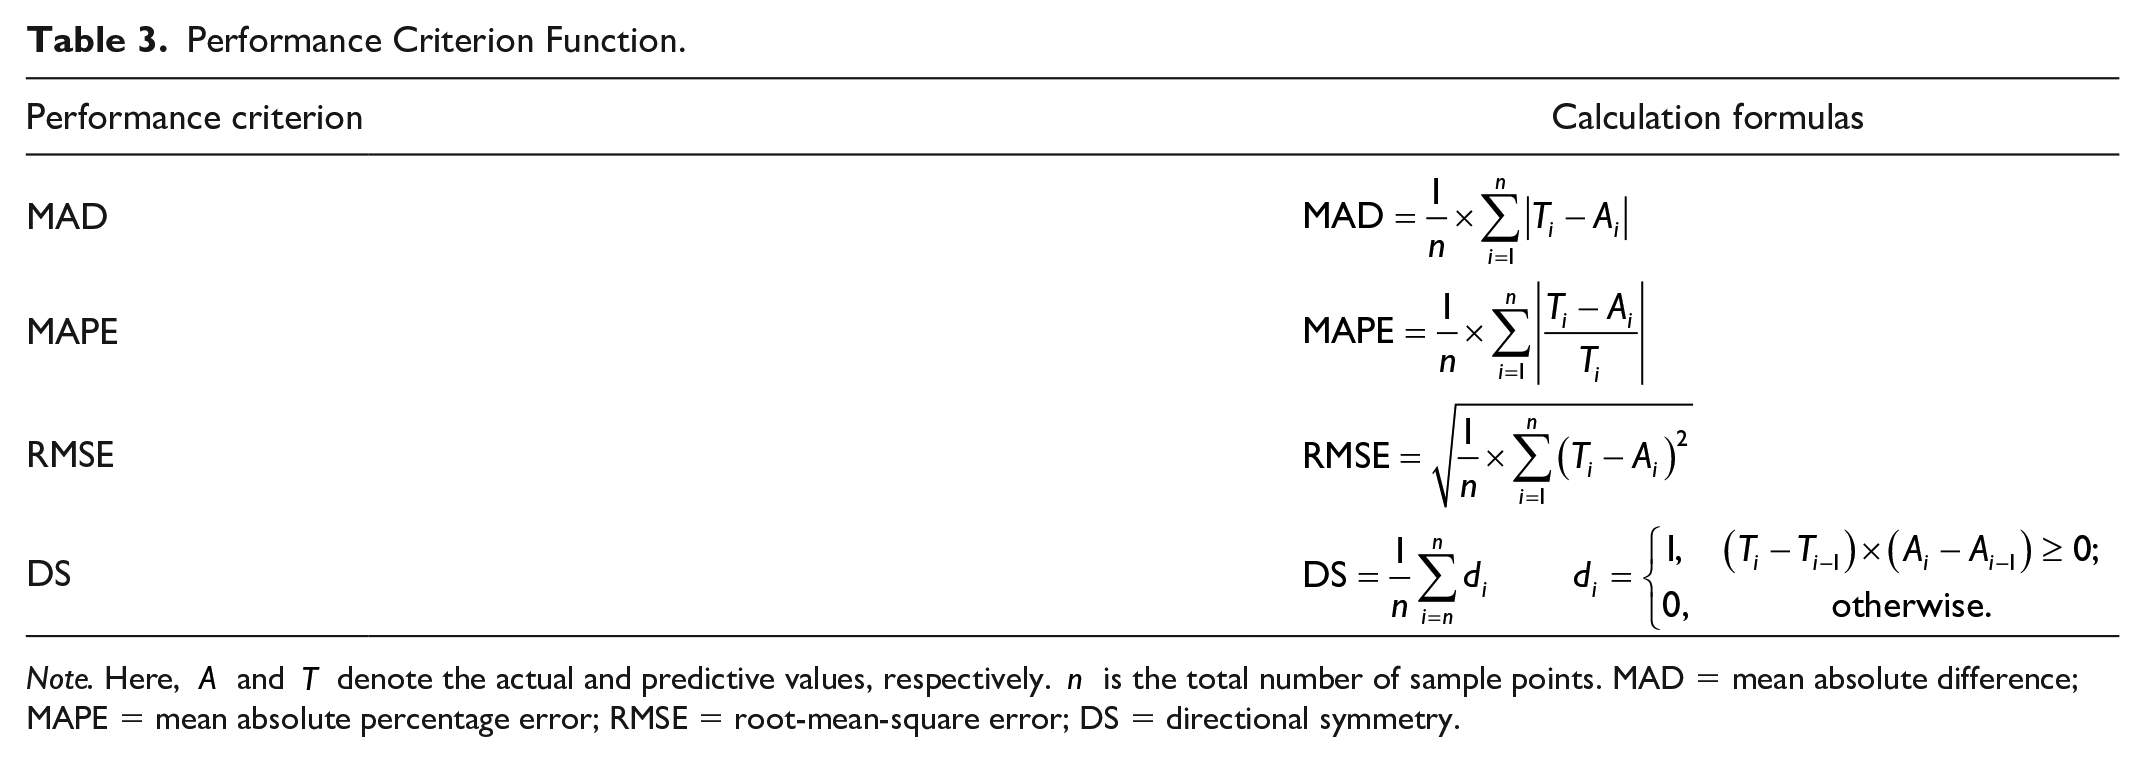
Note. Here,
The Comparison of Prediction Capability Among Elman, SVR, and EMD-Elman
This section presents a comparison of prediction capabilities of the Elman, the SVR, and the EMD-Elman methods. Because investors are more concerned about price rises and falls, the DS indicator is more favored by investors. This section is therefore focused on a comparison of DS indicators using the Elman, the SVR, and the EMD-Elman models. Table 4 shows the results of predictive DS for Elman, SVR, and EMD-Elman for a different prediction step τ. It is obvious that the DS indicator increases significantly through the application of the EMD method. For Steps 1 to 9, the prediction capability of the EMD-Elman model is more accurate than that of SVR and Elman models. In particular, when
Prediction Results: Comparison of DS Indicator Among Elman, SVR, and EMD-Elman.

Note. DS = directional symmetry; EMD = empirical mode decomposition; SVR = support vector regression.
The Analysis of Endpoint Effect
This section presents a comparison of the predictive capability and relative error between both the MEEMD-Elman model dealing with the endpoint effect and the EMD-Elman model not dealing with the endpoint effect. A comparison of performance indicators between EMD-Elman and MEEMD-Elman models is shown in Table 5. From the perspective of MAD, MAPE, and RMSE, the values in MEEMD-Elman are less than that in EMD-Elman. From the perspective of DS which is of more concern to investors, the DS indicator of MEEMD-Elman is 0.73554; this is greater than for EMD-Elman. From the analysis above, it is obvious that the accuracy of the MEEMD-Elman model is higher than that of the EMD-Elman model, meaning that the accuracy of the EMD-Elman model can be improved by dealing with the endpoint effect and applying the ME method. In Figure 5, intuitively, the prediction capability of EMD-Elman is rather poor being in a small area at the endpoints. However, the prediction capability of MEEMD-Elman is better than that of EMD-Elman found in a small area at the endpoint as shown in Figure 6. The relative error in Figures 7 and 8 also shows this improvement. From the above analysis, we find that when using the EMD method to analyze the price of gold futures AU0, there is obviously an endpoint effect as shown in Figures 5 and 7. This also provides direct evidence for the existence of an endpoint effect in the analysis of gold futures prices when using EMD. In addition, by using the ME method, the endpoint effect can be improved.
Performance Comparison Between EMD-Elman and MEEMD-Elman.

Note. EMD = empirical mode decomposition; MEEMD = mirroring extension empirical mode decomposition; MAD = mean absolute difference; MAPE = mean absolute percentage error; RMSE = root-mean-square error; DS = directional symmetry.

Price trend of EMD-Elman.

Price trend of MEEMD-Elman.

Trend of relative error for EMD-Elman.

Trend of relative error for MEEMD-Elman.
The Comparison of Prediction Capability Between MEEMD-Elman and MEEMD-CS-Elman
This section presents the comparison of prediction capability between MEEMD-Elman and MEEMD-CS-Elman. From the results of the last section, we know that the MEEMD-Elman model is an improved model in forecasting of the price of gold futures AU0. However, for the ENN, initialized weights and biases which are randomly given are not optimal in most cases. Therefore, a CS algorithm is introduced to search the optimal initial weights and biases to achieve better accuracy. The comparison of performance indicators between MEEMD-Elman and MEEMD-CS-Elman model is shown in Table 6. From the perspective of MAD, MAPE, and RMSE, the values using MEEMD-CS-Elman are less than those for MEEMD-Elman. From the perspective of DS, which is more of a concern for investors, the DS indicator of MEEMD-CS-Elman is 0.75207, which is greater than 0.73554 for MEEMD-Elman. From the analysis above, it is obvious that the accuracy of the MEEMD-CS-Elman model is greater than that for the MEEMD-Elman model, meaning that the accuracy of the MEEMD-Elman model can be improved by incorporating the CS algorithm. Figures 9 and 10 intuitively give the price trend and relative error.
Performance Comparison Between MEEMD-Elman and MEEMD-CS-Elman.
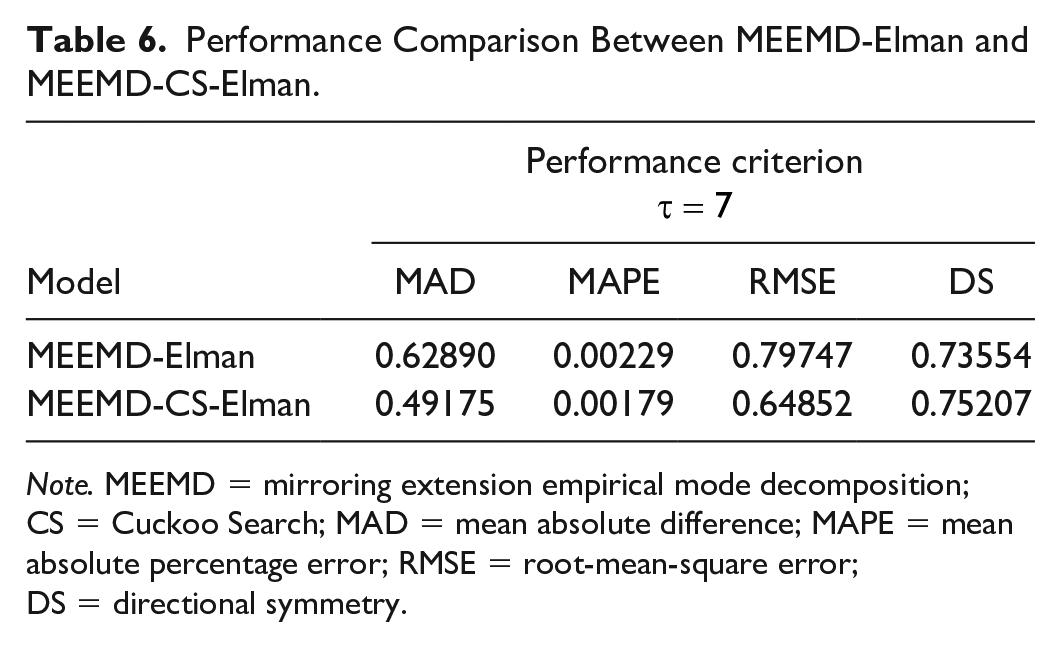
Note. MEEMD = mirroring extension empirical mode decomposition; CS = Cuckoo Search; MAD = mean absolute difference; MAPE = mean absolute percentage error; RMSE = root-mean-square error; DS = directional symmetry.

Price trend of MEEMD-CS-Elman.

Trend of relative error for MEEMD-CS-Elman.
Compared with the research of Wu and Duan (2017) which just applied single Elman to predict the price of gold futures AU0, our model decomposes the time series by EMD. The decomposed function contains the local characteristics of the original signal at different time scales, which dramatically reduces the difficulty of modeling and effectively improves the prediction accuracy. Furthermore, our model optimizes the initial weights and biases of Elman by CS algorithm, and the prediction ability of ENN is improved. In general, MEEMD-CS-Elman model achieves significantly better prediction accuracy. That implies that for investors who are willing to invest in gold futures AU0, our model can reduce better investment risk.
Diebold-Mariano (DM) Type Test
This section presents a comparison of DM test in different forecasting models. Table 7 shows the result of DM test about Elman, SVR, MEEMD-Elman, and MEEMD-CS-Elman models, which they all reject the original hypothesis at 1% confidence level. It means the price forecasting capabilities of these models are well. Furthermore, according to the above analysis, the validity of the proposed models can be verified by performance function. The smaller the performance indexes of MAD, MAPE, and RMSE are, the closer the predicted value is to the actual value. Therefore, the accuracy of MEEMD-CS-Elman model is better.
The Results of DM Test Between the Forecasting Models.
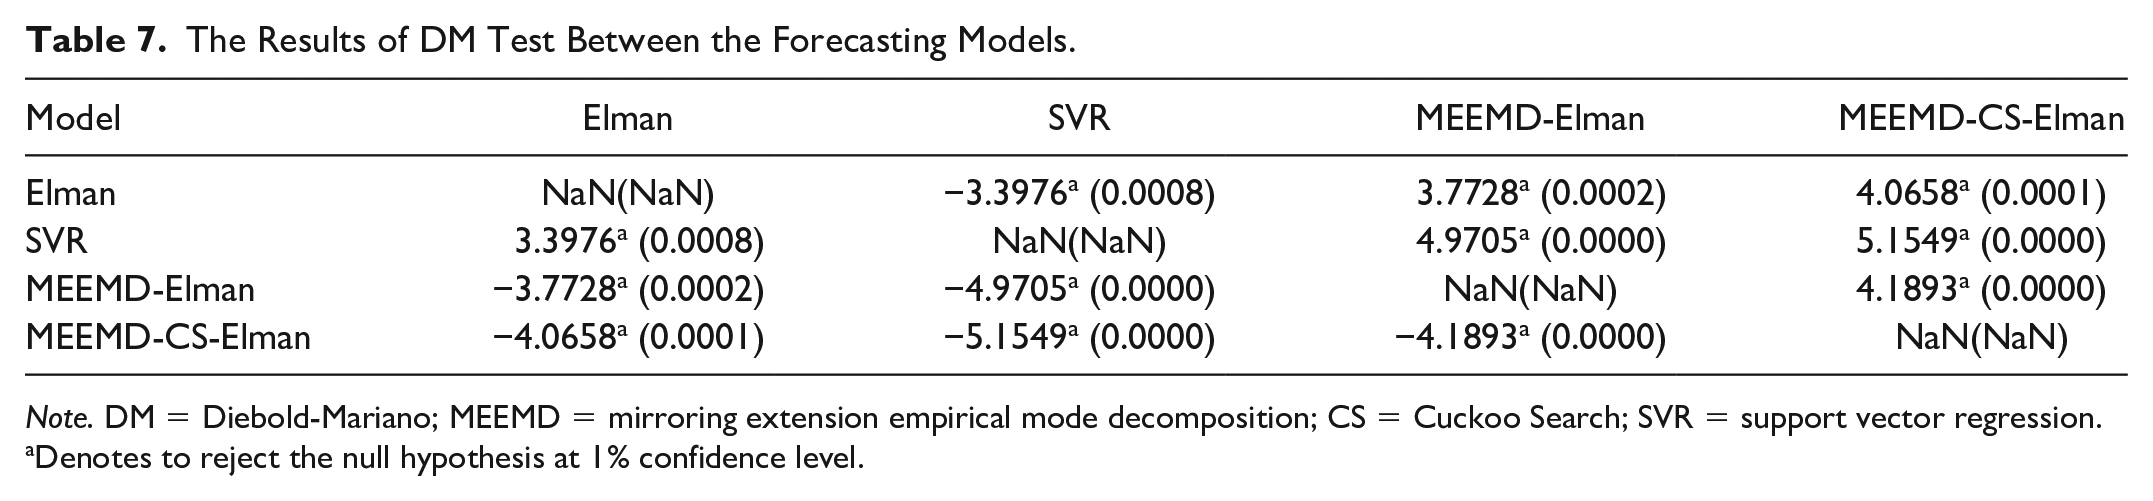
Note. DM = Diebold-Mariano; MEEMD = mirroring extension empirical mode decomposition; CS = Cuckoo Search; SVR = support vector regression.
Denotes to reject the null hypothesis at 1% confidence level.
Discussion
With the rapid development of big data and artificial intelligence, the application of machine learning method has become more and more popular. Meanwhile, getting across many empirical evidences, scholars have found that the accuracy of the combined models is better than the single model (Chen et al., 2016; Kristjanpoller & Minutolo, 2015; Krogh & Vedelsby, 1995). Moreover, compared with the traditional statistical analysis method, machine learning method significantly improves the efficiency of prediction (Adebiyi et al., 2014; Blaschke et al., 2018; Hamid & Iqbal, 2004), because it overcomes the defect that the research hypothesis in statistical method is too strict. Based on the advantages of more precise and more efficient, intelligent computing model has been successively used in finance, power domain, and other fields for forecasting, and has gradually become the main trend (Jothimani et al., 2016; Jun et al., 2018; Li et al., 2018; C.-S. Lin et al., 2012; Pan et al., 2017; Shi & Zhuang, 2019; Shrivastava & Singh, 2018; Wang et al., 2016; Wei, 2016; Yu et al., 2008; J. Zhang et al., 2018; X. Zhang et al., 2018; C. Zhang & Pan, 2015). This article constructs an improved hybrid model to predict the futures price of gold, and the result is better than Elman, SVR, and MEEMD-Elman. Our conclusions do match the achievements of existed research, which means the effectiveness of this model has been verified (Adebiyi et al., 2014; Blaschke et al., 2018; Chen et al., 2016; Hamid & Iqbal, 2004; Jothimani et al., 2016; Jun et al., 2018; Kristjanpoller & Minutolo, 2015; Krogh & Vedelsby, 1995; Li et al., 2018; C.-S. Lin et al., 2012; Pan et al., 2017; Shi & Zhuang, 2019; Shrivastava & Singh, 2018; Wang et al., 2016; Wei, 2016; Yu et al., 2008; J. Zhang et al., 2018; X. Zhang et al., 2018; C. Zhang & Pan, 2015).
Conclusion
In this article, we build on the MEEMD-CS-Elman model to forecast the price trends of gold futures AU0 at the SFE in China. Up to now, a large body of literature has shown that the futures prices tend to be nonlinear and nonstationary. Therefore, it is quite effective to deal with futures prices by applying EMD and the ENN. The demonstration of empirical results can be divided into three aspects.
In terms of DS indicator, we find that the prediction capability of EMD-Elman is significantly superior to that of single Elman and SVR. Even though SVR is one of the most popular methods, the proposed MEEMD-CS-Elman model is now proved to be better in this article.
By introducing the ME method into EMD, the endpoint effect of EMD for the price of AU0 is dealt with better.
By introducing the CS algorithm to search for the optimal initial weights and biases, the MEEMD-CS-Elman achieves the most accurate predictions when compared with the EMD-Elman and MEEMD-Elman models in terms of performance criterion: MAD, MAPE, RMSE, and DS. In particular, the DS indicator tends to be more attractive for investors. The value of the DS indicator in MEEMD-CS-Elman model reaches 0.75207, meaning that the proposed model predicts the directions of increasing and falling prices quite precisely. Hence, neural network combined with EMD in physical method and CS algorithm in statistics is a constructive perspective, which endows with stronger predictability in gold futures AU0.
By DM test, it is clearly confirmed that the prediction accuracy of MEEMD-CS-Elman model is higher than others.
Overall, by applying the proposed model, investors can make more scientific and accurate decisions and reduce their investment risks better. Deep learning has shown that increasing the number of hidden layers can achieve a better prediction result. However, there is only one hidden layer in the ENN. Hence, how to add more hidden layers into the ENN and optimize the ENN using CS algorithm to obtain the more accurate predictions will be the focus of further research in the future.
Footnotes
Acknowledgements
The authors are very grateful to the editor and anonymous referees for their insightful and valuable suggestions that have led to an improved version of this paper.
Declaration of Conflicting Interests
The author(s) declared no potential conflicts of interest with respect to the research, authorship, and/or publication of this article.
Funding
The author(s) disclosed receipt of the following financial support for the research, authorship, and/or publication of this article: This research was funded by the Department of Philosophy and Social Science of Gansu Province (No. 19YB006).