
Abstract
While the effect of teachers’ unions on school districts continues to be debated, the research literature provides few definitive conclusions to guide these discussions. In this article, we examine the relationship between teachers’ union contracts and school district efficiency. We define efficiency as the ratio of short-run productivity (student performance on standardized exams) to expenditures. We estimate a series of school district fixed effect models using measures of district collective bargaining agreement (CBA) restrictiveness tied to longitudinal outcomes. We find that CBA restrictiveness is positively associated with expenditures on students, instruction, instruction support services, and teacher and administrator salaries over time. We find no significant relationship between CBA restrictiveness and student achievement. Finally, we find a negative relationship between CBA restrictiveness and district efficiency. Given the small magnitude of our effect sizes, we conclude that weakening union rights may not produce large gains in efficiency and may come at substantial political costs.
Introduction
Over the last decade, public debate regarding the benefits and costs of teachers’ unions in public education has increased. This is apparent in the sizable amount of legislation and litigation considered in statehouses and courthouses and the unprecedented amount of labor action in school districts around the nation. In 2018, the Supreme Court’s decision in Janus v. AFSCME removed the 41-year-old precedent allowing public-sector unions to collect agency fees from employees who do not wish to join their union, which could decimate the ranks of teachers’ unions around the country (Marianno & Strunk, 2018a). Although not yet subject to supreme court review, there has also been a great deal of policy attention paid to teachers’ unions’ rights to collectively bargain, and to the specific aspects over which they do negotiate with local school district boards and administrations (Marianno, 2015). At the same time, teacher strikes around the country in 2018 and 2019 showcased renewed union activism, suggesting that teachers’ unions will continue to be a formidable force for advocating on behalf of teachers, notwithstanding the recent spate of unfavorable policy enactments and court rulings.
Much of the debate on teachers’ unions in public education hinges on the productivity and efficiency effects of union activities. Those critical of teachers’ unions frequently argue that unions advocate for policies and negotiate lengthy collective bargaining agreements (CBAs) that burden districts and schools with overly rigid work rules. These work rules, critics argue, make operations inflexible to changing fiscal and accountability contexts and institutionalize costly procedures that are inefficient and ineffective ways to run schools (e.g., Ballou, 2000; Chubb & Moe, 1990; Hess & Loup, 2008; Hess & West, 2006; Hoxby, 1996; Moe, 2001, 2009). In contrast, those in support of teachers’ unions argue that the policies advocated for by unions and ensconced in agreements protect teachers from the arbitrary and capricious behavior of administrators and afford them a voice in the policies that affect their work (e.g., Bascia & Rottmann, 2011; Casey, 2006; Johnson & Donaldson, 2006; Kaboolian, 2006).
While the research base on collective bargaining in public education is growing, the literature provides very few definitive conclusions on the effects of this union activity to guide policymaker judgments on whether to reduce or expand union rights (see Cowen & Strunk, 2015, for a review). In particular, most prior literature on the effect of local unions and contracts on resource inputs (i.e., district expenditures) and productive outputs (i.e., student learning) estimates these relationships at a single point in time, often with dichotomous measures, making it difficult to assess how changes to local union strength and CBAs are associated with changes in resources and productivity. In addition, the effect of unions on resource inputs is often evaluated separately from the effect on productive outputs, with only a few exceptions (e.g., Brunner et al., 2019). Without a simultaneous understanding of the effect on both achievement and resource allocation, we cannot draw clear conclusions about the benefits or costs of union activity in education.
In this article, we add to the literature about the effects of teachers’ unions on school district administration by using a longitudinal dataset from California school districts to estimate the relationship between CBAs and district efficiency over time. We bring to bear a measure of CBA or contract restrictiveness that has been broadly used in the education literature, in which we define contract restrictiveness as the extent to which the CBAs negotiated between teachers’ unions and their school district counterparts impose restrictions on administrators in the management of day-to-day school operations (e.g., Goldhaber et al., 2013; Marianno et al., 2018; Marianno & Strunk, 2018b; Strunk et al., 2018, 2019; Strunk & Grissom, 2010; Strunk & Reardon, 2010). Our measure of contract restrictiveness relies on a partial independence item response model that estimates the restrictiveness of approximately 500 California school district CBAs in place during the 2005–2006, 2008–2009, 2011–2012, and 2014–2015 school years. We then model district expenditures, student achievement, and district efficiency (defined as a ratio of student achievement-to-district expenditures) as a function of contract restrictiveness.
Once we account for district and year fixed effects, relationships between contract restrictiveness and student achievement are negative, but small and not significant. However, contract restrictiveness is positively associated with overall spending, including spending on instruction, instructional support services, and salaries for both teachers and administrators. Altogether, we find that a standard deviation increase in contract restrictiveness is associated with a decrease in district efficiency of 1.3% to 2.4%.
This article proceeds as follows. The “Theoretical Perspectives on Teachers’ Unions and Efficiency” section provides background on the theoretical rationale for how teachers’ unions may influence productivity and efficiency. The “Empirical Evidence on the Effects of Teachers’ Unions on Operations” section outlines the exiting empirical literature on the topic. The “Data” section outlines the data and methods we use in our analysis. The “Empirical Strategy” section details our empirical strategy, and the “Results” section provides the results. The “Discussion and Conclusion” section concludes with a discussion of the implications of our results for our theoretical and empirical understanding of the effect of unions on public education.
Theoretical Perspectives on Teachers’ Unions and Efficiency
In “What Do Unions Do?” Freeman and Medoff (1984) proposed two faces of union power—monopoly and voice. These perspectives have formed the theoretical foundation for much of the empirical work on unions for more than three decades and provide theoretical expectations for how unions might influence school district efficiency (Gunderson, 2005).
The Monopoly or Rent-Seeking Union
The monopoly face of union power recognizes that by monopolizing the supply of labor to firms, unions acquire bargaining power that they can use to negotiate for wages and working conditions above what would be afforded in a competitive market (Freeman & Medoff, 1984; Kaufman, 2004). For example, rent-seeking unions in education, due to their monopolistic power over the supply of teacher labor to public school districts and through their political coalitions, can advocate for patterns of school resource allocation that are consistent with teachers’ preferences, which may or may not coincide with resource allocations that have the highest marginal benefit for student learning (Hoxby, 1996). Thus, if union bargaining reallocates resources away from more productive activities, then districts may face higher costs without commensurate gains in student performance, leading to inefficiencies in the production of education as a result of union activity.
Union Voice
Borrowing on Hirschman’s (1970) exit-voice framework, Freeman and Medoff (1984) proposed that when unions represent the desires and preferences of their members, the actions they take through collective bargaining serve important voice functions by affording employees the opportunity to raise grievances in lieu of exiting employment. Freeman and Medoff suggest several different reasons why the proxy exercise of employee voice by unions should enhance the productivity of inputs and thereby improve efficiency. First, the advancement of employee interests by the union should reduce employee turnover, which will lower hiring and training costs. Unions also implement procedures that link promotions and rewards to seniority instead of to managerial prerogatives, which may reduce rivalry and increase collaboration and informal training among employees. Unions can similarly enhance productivity by enforcing job standards and accountability for management such that firms can maintain productivity even as wages rise. Finally, unions can assess and communicate the desires of all employees so that management can better optimize the distribution of resources between wages and working conditions and thereby raise the marginal productivity of their workforce.
In reality, unions likely embody both the monopoly and voice faces, and which dominates in practice is an open empirical question. In the next section, we discuss the existing evidence on the monopoly and voice effects of teachers’ unions and why a direct test of the efficiency effects of teachers’ union activity is warranted.
Empirical Evidence on the Effects of Teachers’ Unions on Operations
Monopoly and voice theories of union power both find some support in the research literature. Evidence on the budgetary effects of teachers’ unions is largely found in economics and education journals dating back to the 1970s. These studies find that unionized and bargaining school districts have higher expenditures (Chambers, 1977; Duplantis et al., 1995; Eberts, 1983; Eberts & Stone, 1984, 1986; Gallagher, 1979; Hoxby, 1996), and many of these expenditures are directed toward increases in teacher salaries (Duplantis et al., 1995; Gallagher, 1979; Hoxby, 1996; Zwerling & Thomason, 1995). In the state-level studies on the topic, Paglayan (2019) and Frandsen (2016) find that laws affording teachers the right to collectively bargaining did not lead to increases in the level of resources devoted to education. 1 However, Brunner et al. (2019) find that districts in states with strong teachers’ unions increased local education expenditures following school finance reforms.
Most existing studies employ dichotomous indicators that capture the presence or absence of unions but are unable to empirically capture the influence of the activities unions engage in, like collective bargaining. This is particularly important in states where there is little variation in union status because most teachers are unionized. New methodological developments strive to solve this problem by generating a measure of contract restrictiveness built from an in-depth content analysis of individual contracts (Strunk & Reardon, 2010). Drawing on over 600 provisions from teacher contracts, the measure captures the degree to which a given CBA “restricts” the purview of school and district administrators in their management of the daily work of teachers (Goldhaber et al., 2013; Marianno et al., 2018; Strunk et al., 2018, 2019). Using such measures for a cross-section of school districts in California, Strunk (2011) finds that restrictive CBAs are associated with higher overall district expenditures and decreased spending on instructional materials.
Of course, if increases in public expenditures are met with commensurate returns to performance, then there may be improvements (or at least no loss) in efficiency because of union activities. The literature on the performance effects of teachers’ unions, however, is mixed (Cowen & Strunk, 2015; Goldhaber, 2006). Some studies find that students in unionized school districts perform significantly better than their nonunion counterparts (Argys & Rees, 1995; Eberts & Stone, 1984, 1987; Milkman, 1997). These findings are consistent with the notion that union activity leads to productivity-enhancing reallocations of resources by school districts.
A limitation of these early studies on unionization and productivity is that they assess relationships over a limited time horizon, generally in a single-year cross-section. Because unions are not randomly assigned to school districts but tend to arise in areas where working conditions are more difficult (e.g., Moe, 2009; Strunk, 2011, 2012; Strunk & McEachin, 2012), unobserved working conditions could lead to spurious relationships between unionization and productivity. More recent studies use identification strategies that attempt to account for the endogenous sorting of unions to workplaces by exploiting the plausibly exogenous timing of union certification elections, union bargaining laws, or union-related policy changes, and find a negative effect or no effect of unionization on productivity (Hart & Sojourner, 2015; Hoxby, 1996; Lott & Kenny, 2013; Lovenheim, 2009; Lovenheim & Willen, 2016; Quinby, 2017). 2 Roth (2017) explores changes in teacher turnover and student achievement following the enactment of Wisconsin Act 10, which substantially reduced teacher bargaining rights, and finds that student performance improved in elementary grades where teachers retired following the reform. However, Baron’s (2018) later study finds that Wisconsin high school student achievement decreased as a result of Act 10. Marianno and Strunk (2018b) find that once time-invariant district working conditions are accounted for, the relationship between contract restrictiveness and student achievement in California school districts is at worst small and negative and, at best, zero. Brunner et al. (2019) find that following school finance reforms, the increase in and reallocation of local education expenditures associated with union influence translated into larger achievement gains. This could imply greater efficiency as a result of union activity.
Contributions of the Present Study
This study makes a few advancements over prior research. Altogether, the extant research finds some evidence that teachers’ unions are associated with increased costs for school districts, though their effects on productivity remain ambiguous. More importantly, we still know little about how changes in the intensity of union activities (not just the presence or absence of them) are associated with school district expenditures and student achievement. Most prior studies employ limited measures of unionization that fail to capture the degree of union activities (e.g., Argys & Rees, 1995; Eberts & Stone, 1987; Milkman, 1997). In this study, we utilize a continuous measure of contract restrictiveness built on a close content analysis of CBAs over time.
More uncertain still are the implications of teachers’ unions on the efficiency of school districts, because few studies on teachers’ unions consider district inputs and outputs simultaneously. In short, it is not clear that we can infer from prior research on the effect of unions on resource inputs and productivity outputs anything about the effect of unionization on efficiency. This is because our knowledge on the effect of unionization on resources (e.g., Chambers, 1977; Duplantis et al., 1995; Eberts, 1983) and the effect of unionization on productivity (e.g., Argys & Rees, 1995; Eberts & Stone, 1987; Hart & Sojourner, 2015; Lott & Kenny, 2013; Milkman, 1997; Moe, 2009) results mainly from separate studies performed in different contexts and time periods, on different samples, and with different identification strategies. We therefore build on prior research by employing a series of performance-to-expenditure ratios as more direct measures of the efficiency of public school districts (Ryan et al., 2017). As discussed below, a higher ratio of achievement-to-expenditures suggests that districts are more productive at any given level of expenditure. We anticipate that if contract restrictiveness is indeed associated with the inefficient use of scarce resources, as suggested by union rent-seeking theories, then we would observe a negative relationship between contract restrictiveness and our achievement-to-expenditure ratios. In contrast, a positive relationship would support the union voice view, that bargaining improves the efficiency of district inputs by making district policy more effective.
Finally, as discussed above, much of the extant research on unions relies on cross-sectional data in which relationships are likely to be affected by unobserved differences between school districts. Instead, we use a longitudinal dataset that follows contract restrictiveness and school district productivity for approximately a decade. This enables us to use school district and year fixed effects to account for unobserved factors related to contract restrictiveness, district inputs, and student achievement, all likely sources of bias in prior work.
Data
We draw on 11 years of school district data. As in prior work on teachers’ unions (e.g., Koski & Horng, 2007; Strunk, 2011, 2012; Strunk & McEachin, 2012; Strunk & Reardon, 2010), we limit analysis to districts in California. Our database contains information on the CBAs from school districts in California with at least four schools. While this only includes approximately half of the nearly 1,000 school districts that operate in California in each year, the labor-intensive nature of collecting and analyzing several hundred CBAs over four bargaining cycles necessitates this limitation. In addition, as shown in prior work (Strunk, 2012), the CBAs in very small districts look different than those in larger districts. For example, CBA provisions governing the manner in which teachers transfer between schools may serve little to no purpose in a district with only a few schools.
Contract Restrictiveness
One of the primary ways in which unions secure their interests is through collective bargaining or contract negotiations with employers on behalf of their membership. These agreements can be fairly lengthy and contain hundreds of provisions that set boundaries on the working relationship between personnel and administration (e.g., the length of the workday, the number and duration of faculty meetings). Strunk and Reardon (2010) pioneered a process by which to estimate the degree to which contracts impose restrictions on the work of management using a partial independent item response (PIIR) model. The PIIR model operates on the premise that each CBA has a latent restrictiveness that can be inferred from the presence or absence of various provisions that constrain district operations (e.g., a provision limiting the length of the teacher workday to 7.25 hr or less), much as a correct or incorrect answer on a test can be used to infer a student’s latent understanding of a subject. Prior research finds that the resulting contract-based measure from the PIIR model is positively correlated with school board member perceptions of local union strength, the fraction of board members who received a union endorsement, union assistance in fundraising, and union campaign volunteer support (Strunk & Grissom, 2010).
Following Strunk and Reardon (2010), we estimate the extent to which a CBA restricts district administrators by collecting and analyzing CBAs from a selection of California school districts. Because California law requires that districts and unions negotiate new agreements at least every 3 years, we collected contracts once every 3 years beginning with contracts in place during the 2005–2006 school year, with subsequent collections taking place for the 2008–2009, 2011–2012, and 2014–2015 school years. 3 The average contract length in California is approximately 94 single-spaced pages, with provisions spanning 15 general areas of the contract—contract negotiations, association rights, compensation, class size, evaluation, grievances, benefits, layoffs, leaves, nonteaching duties, professional development, early retirement, retirement, school workday, and transfers. The mean length of time in which a CBA in our sample is active is 2.6 years, with 95% of CBAs spanning 3 years or less. We find that 19% of CBAs were first effective in the year of collection, 33% were first effective in the year prior to collection, and 25% were first effective 2 years prior to collection.
We code the contract from each collection year for 253 contract items across all 15 areas of the contract. To identify which of these items reliably indicate underlying restrictiveness, we conduct a Cronbach’s alpha item analysis to eliminate weakly related items. We employ all years of data in the alpha item analysis, which reduced the 253 coded items to the 34 items presented in Online Appendix Table A1 (α = .83). These 34 items are then used to estimate each contract’s overall restrictiveness.
The PIIR model allows for the fact that some provisions will be interdependent such that a more restrictive provision can only be present if a less restrictive “gate” provision is also present (e.g., the teacher workday cannot be limited to 7 hr or less unless it is also restricted to 7.25 hr or less). Thus, while each contract provision is measured dichotomously based on its presence or absence, more and less restrictive provisions governing the same district behavior can also be incorporated by modeling their interdependence. The model is formally estimated as a hierarchical random effects model, taking into account this conditional (or gate) structure, as well as the fact that CBAs in our data are nested in years. We define Ykig as equal to one if restrictive item k is present in the contract in year i in district g, and zero otherwise, with hkig indicating similarly whether item k’s gate item is present. We further let
We estimate the structural model as follows:

where D is a dummy variable indicating whether each provision is present in each contract, with
Because the raw contract restrictiveness units are not immediately interpretable, we standardize the contract restrictiveness measures within year. Thus, contract restrictiveness in each year has a mean of zero and a standard deviation of one (see Table 1, Row 1). However, understanding what a one standard deviation change in contract restrictiveness means in practical terms is still challenging. Using the conditional severities generated from the PIIR model
Summary Statistics.
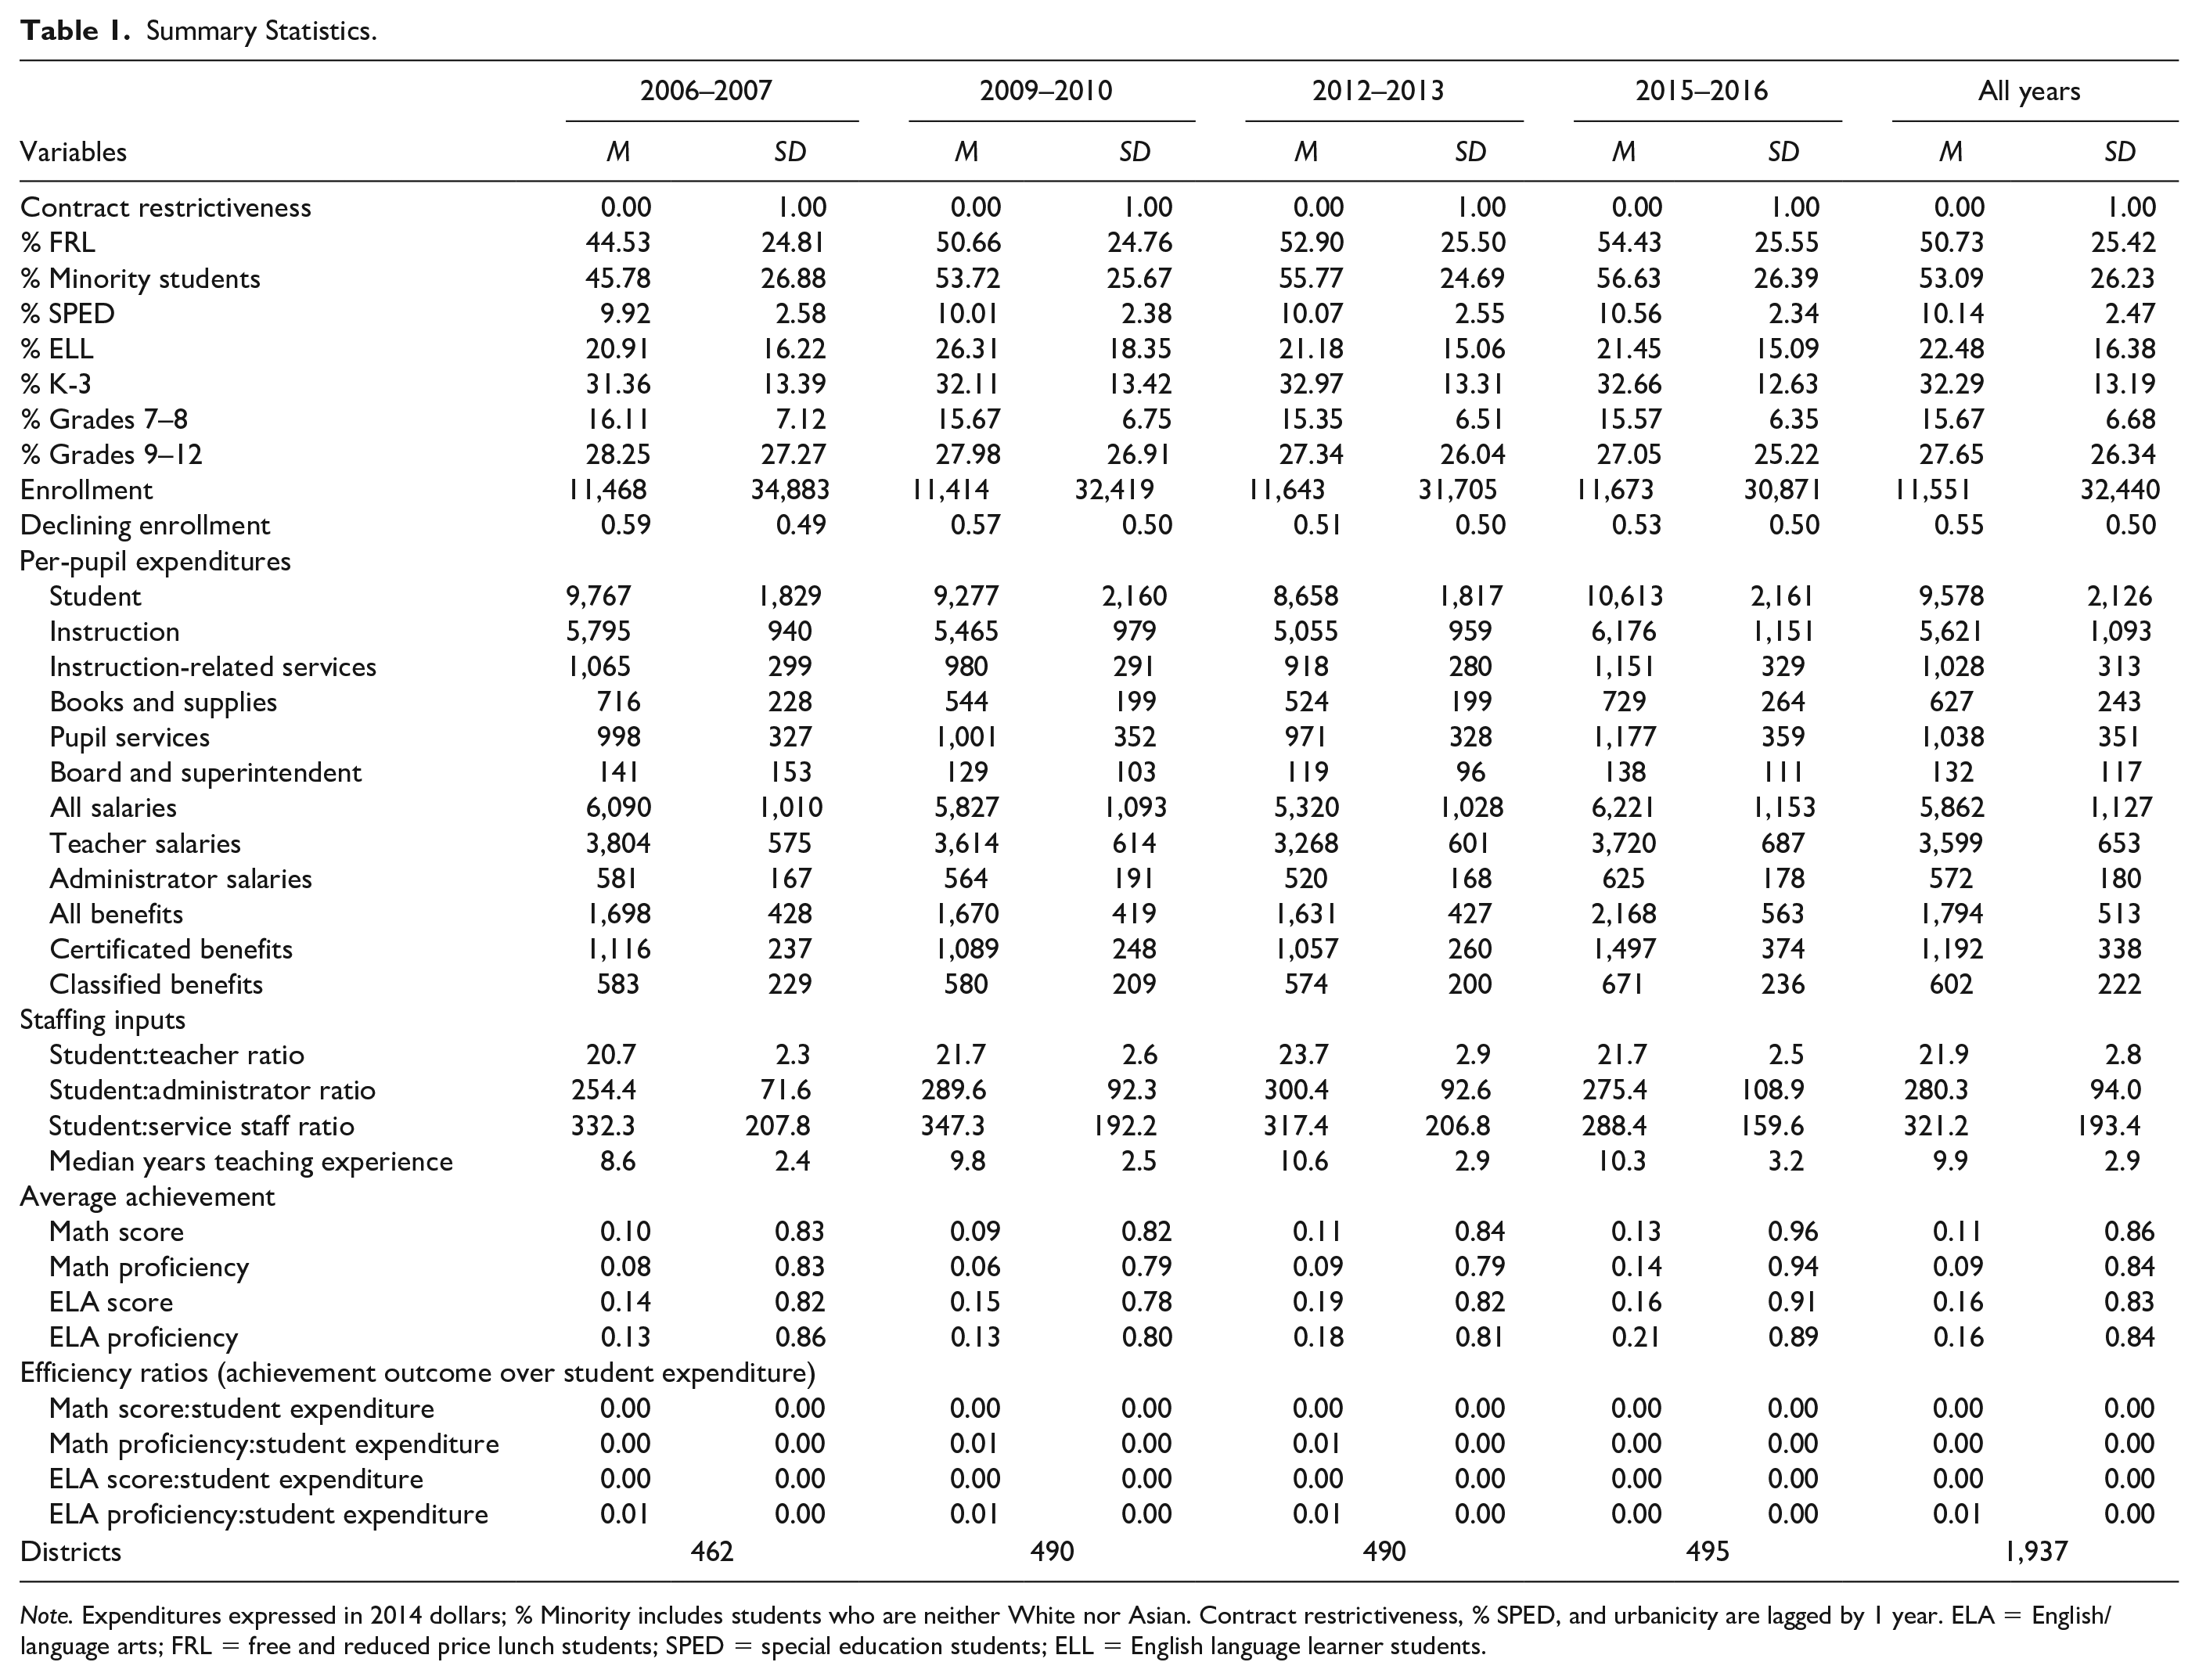
Note. Expenditures expressed in 2014 dollars; % Minority includes students who are neither White nor Asian. Contract restrictiveness, % SPED, and urbanicity are lagged by 1 year. ELA = English/language arts; FRL = free and reduced price lunch students; SPED = special education students; ELL = English language learner students.
District Inputs
Our primary measures of district inputs are expenditures, including overall expenditures and expenditures on specific categories of activity. Expenditure data come from the California Department of Education (CDE), which requires districts to report revenues and expenditures annually using a standardized account code structure (SACS). The SACS involves several levels of codes by which expenditures are associated with specific goals (e.g., vocational education), activities (e.g., curriculum development), and objects purchased (e.g., certificated teacher salaries).
We construct two measures of aggregate expenditures. Following Ryan et al. (2017), our first measure is of student expenditures, which corresponds to what the CDE calculates as the “current expense of education” and is intended to capture expenditures that are both substantially discretionary and relevant to the day-to-day educational experiences of K-12 students. As a second measure of aggregate expenditure, we calculate instructional expenditures, consisting of only those student expenditures explicitly associated with instruction. 5
These measures of aggregate expenditures can be thought of as representing the level of district financial inputs into the educational process. However, CBAs may also affect the manner in which any given level of resources is allocated to various activities. We therefore further isolate spending on the specific subcategories of student expenditures considered previously by Strunk (2011). These subcategories of expenditures include spending on all salaries, teacher salaries, administrator salaries, all staff benefits, classified staff benefits, certificated staff benefits, instruction-related services, books and supplies, pupil services, and special activities overseen by the board of education and superintendent. All expenditure categories and the SACS codes by which they are identified are summarized in Online Appendix C.
We adjust expenditures for inflation using the consumer price index for all consumers so that they are measured in real (2014) dollars and for cost-of-living using the Comparable Wage Index (CWI), which facilitates comparisons across geographic areas by accounting for regional variation in the average cost of labor (Taylor & Fowler, 2006). We construct all measures as expenditures-per-pupil and then use a natural log transformation to adjust the positive skew of the distribution. The second panel of Table 1 presents summary statistics for these variables in 2014 dollars before the log transformation. The table shows that the average California district in our sample expended approximately 12,182 dollars per pupil in 2006–2007. This number declined between 2009–2010 and 2012–2013, likely due to recessionary pressures, but increased again in 2015–2016 to 12,779 dollars per pupil.
Changes to district inputs may manifest not only as changes in the levels or distribution of expenditures but also as changes in staffing if, for example, districts hire different numbers or types of staff. We therefore use district staffing data from the National Center for Education Statistics (NCES) and the CDE to measure districts’ student-to-teacher, student-to-administrator, and student-to-support staff ratios as well as the median years of teachers’ in-district experience. The third panel of Table 1 shows that the average district in 2006–2007 maintained a student–teacher ratio of 20.7 students per teacher. This number increases to as high as 23.7 in 2012–2013 but decreases to 21.7 in 2015–2016. We observe similar patterns for the other staffing ratios.
District Achievement Outcomes
School districts are expected to achieve numerous and often difficult-to-measure outcomes. An exhaustive inventory of these outcomes, and thus a comprehensive evaluation of district effectiveness, is therefore not feasible. Acknowledging this, we consider as measures of district effectiveness four student achievement outcomes that are often of practical and political interest and for which longitudinal data are readily available: student scores (standardized across all districts in the state in each year) and proficiency rates in math and English/language arts (ELA) on standardized exams. As shown in the fourth panel of Table 1, districts in our panel have achievement slightly above the state average, by roughly 10% of a district-level standard deviation in math and 16% of a standard deviation in ELA. Although average proficiency rates vary substantially over time, within any given year a one-unit increase in these standardized measures (e.g., the difference between a district with a standardized achievement measure of zero and a district with a standardized measure of one) represents a change in the share of students who are rated proficient of roughly 16 to 18 percentage points in both subjects.
District Efficiency Measures
To create measures of district efficiency, we follow Ryan et al. (2017), creating a series of efficiency ratios incorporating both school district inputs (expenditures) and outputs (achievement). Specifically, we create 12 efficiency ratios by dividing each district’s achievement outcomes in each year (math and ELA scores and proficiency rates) by its total per-pupil student expenditures, total per-pupil instructional expenditures, and total per-pupil salary expenditures. The resulting ratios do not have a concrete interpretation but have the attractive feature of implying that districts are more efficient when their achievement levels are higher for a given level of expenditure or when their expenditures are lower at a given level of achievement. To facilitate interpretation, and because in some cases their distributions are somewhat skewed, we transform each ratio by its natural log. The summary statistics for the unlogged version of the measures using student expenditures are shown in the bottom panel of Table 1. Given the relatively small magnitude of average achievement (around .10 of a standard deviation in 2006–2007 for math), and the relatively large size of average per-pupil district student expenditures (9,767 dollars per pupil in 2006–2007), the mean on the efficiency measures is extremely small (approximately zero) in each year. Summary statistics for the other efficiency measures are substantively similar.
Other District Characteristics
We control for several time-varying characteristics of school districts (see the top panel of Table 1) accounted for in prior work and shown to be related to district expenditures and student achievement, including the percentage of free and reduced price lunch students, the percentage of minority students, the percentage of special education students, the percentage of English language learner students, the percentage of K-3 students, the percentage of Grade 7 through Grade 8 students, the percentage of Grade 9 through Grade 12 students, the natural log of student enrollment, and an indicator variable for whether the district is experiencing declining enrollment (Marianno & Strunk, 2018b). We derive measures of these district characteristics from the School and local education agency (LEA) Universe Surveys produced by the NCES and from public files released by the CDE.
Empirical Strategy
As discussed above, previous work has relied on cross-sectional data to study the relationships between contract restrictiveness and school district achievement and expenditures. This has limited the extent to which estimates of those relationships can be interpreted causally because it is likely that they will be biased by unobserved heterogeneity across districts. Our longitudinal data allow us to mitigate some (though not all) of these concerns by employing a fixed effect specification. Specifically, we estimate a series of models of the form:

where Y is an outcome in district d in year t. Restrictiveness is our predictor of interest, a measure of contract restrictiveness calculated as described above. We use contract restrictiveness in the prior year because it seems likely that the CBA in effect in the previous year will have at least as much of an influence as the contemporaneous contract on district operations in a given year (because many district budgeting decisions will be made prior to the start of a given school year, for example).
6
Recall that the average time span for a contract in our sample is 2.6 years, with all CBAs being in effect in year t − 1, but with approximately 25% having been negotiated as early at t − 4. For these observations,
Key to the fixed effect identification strategy is the amount of within-district variation in contract restrictiveness over time. Figures D1 and D2 of Online Appendix D explore how contract restrictiveness changes over time using the unstandardized measure. Figure D1 of Online Appendix D plots average contract restrictiveness across the four bargaining cycles (2005–2006, 2008–2009, 2011–2012, 2014–2015) and makes clear that unions are growing stronger over time in California. Average contract restrictiveness was −0.29 (SD = 0.43) in 2005–2006 and was 0.18 (SD = 0.44) in 2014–2015, a change of 0.47, or just over a standard deviation. Figure D2 of Online Appendix D plots the change in contract restrictiveness between negotiation cycles. The figure makes clear that change in contract restrictiveness between contract years is approximately normally distributed with an average change of 0.15 or approximately one third of a standard deviation. The figure further shows that while contract restrictiveness in most districts changes incrementally, several districts are on the tails of the distribution and experience substantial changes in contract restrictiveness between contract cycles. We further observe that for the median district in our sample, their most and least restrictive CBA over the life of the panel differs by 0.74 SD. For 90% of districts, their most and least restrictive CBAs differ by at least 0.11 SD. This suggests that we have adequate within-district variation for our fixed effect analyses.
The identifying assumption of the fixed effect model is that there are no time-varying factors correlated with contract restrictiveness that also affect district expenditures, student achievement, and district efficiency. While this assumption cannot be proven definitely, as we do not observe all potential variables, Online Appendix E shows a series of models predicting changes in contract restrictiveness as a function of time-varying district-level characteristics. Online Appendix Table E1 showcases that there are few, if any, time-varying district characteristics that consistently predict changes in contract restrictiveness over time. In Online Appendix Table E2, we exploit the plausibly exogenous expiration of CBAs to explore whether a high-profile court case on union-protected state statutes, Vergara v. State of California (2014), and changes to the state school funding formula (Local Control Funding Formula [LCFF]) explain changes to contract restrictiveness over time. 8 In short, we estimate a series of difference-in-difference models that compare the restrictiveness of CBAs that expired before Vergara and the implementation of the new state funding formula, to CBAs that expired after the court case and new law had been enacted. We find that neither the court case nor the change in the funding formula drove changes to contract restrictiveness. Prior research on California CBAs also suggests that overall restrictiveness did not change as a result of recessionary pressures (Strunk & Marianno, 2019). We test this identifying assumption further by running a series of models that control for future contract restrictiveness (Online Appendix G). If controlling for future contract restrictiveness changes our main estimates, then we may be concerned that there may be unaccounted for factors related to changes in contract restrictiveness, expenditures, and achievement. Online Appendix Table G1 shows that controlling for future contract restrictiveness does not change our main estimates. 9 In Online Appendix H, we add additional lags of contract restrictiveness to explore whether the effects of contract restrictiveness take years to play out. Online Appendix Table H1 also shows that controlling for multiple lags does not meaningfully change our main estimates. 10 These tests add confidence but are not wholly conclusive that our identifying assumption is met.
Results
District Inputs
Table 2 presents estimates of the relationship between contract restrictiveness and aggregate expenditure measures (Columns 1 and 2) and several other categories of expenditure (Columns 3–6). Contract restrictiveness is positively and significantly related to student (at the 10% level) and instructional expenditures (at the 5% level); a one standard deviation increase in contract restrictiveness is associated with an increase in per-pupil student expenditures of approximately 1.2% (p = .053) or US$111 for the median district in our sample. 11
Fixed Effect Regressions of Per-Pupil Expenditures on Contract Restrictiveness.

Note. Standard errors clustered on districts in parentheses. Contract restrictiveness is from the prior year and standardized to have a standard deviation of one in each year. Financial outcomes are per-pupil and natural log transformed.
p < .1. *p < .05. **p < .01. ***p < .001.
FRL = free and reduced price lunch students; SPED = special education students; ELL = English language learner students.
It is also useful to consider how district resource allocations vary with contract restrictiveness by considering subcategories of student spending. Overall spending increases are not evenly distributed across the budget. Instructional expenditures (those related to direct teacher–student interaction) are positively related to contract restrictiveness and so too is spending on instruction-related services (i.e., services supporting teacher–student interaction). A standard deviation increase in contract restrictiveness is associated with an increase in per-pupil spending on instruction of 1.3%—approximately US$73—and on instruction-related services of 1.9% or roughly US$20. This distinct category of expenditures includes such activities as curriculum development, professional development, and general school administration. These increases do not appear to be driven by spending on books and supplies (a category that includes many, though not exclusively, expenditures dedicated to instruction and instruction-related services). Expenditures on pupil services and the operations of the school board and superintendent, activities considered distinct from the instructional categories above, have similar point estimates but are estimated less precisely, and are not statistically significant.
Table 3 presents results for expenditures on staff compensation. Given the increases in instructional and instruction-related service expenditures, it is again unsurprising to see increased salaries, which make up a large portion of instructional expenditures, associated with contract restrictiveness. A one standard deviation increase in contract restrictiveness is associated with increased salary expenditures of 1.4%, consistent across both teachers and administrators. Because salary expenditures make up a substantial share of district budgets, these increases may be of practical importance. For example, a 1.3% increase in teacher salary expenditure for the median district in our sample represents approximately US$48 per pupil or more than US$1,000 for a classroom of 22 students. Similarly, a 1.6% increase in administrator salary expenditure for the median district is equivalent to US$9 per pupil or US$5,589 for a school of average size (621 students). Spending on nonwage compensation increases to a lesser degree and is only significant for classified staff. 12
Fixed Effect Regressions of Salary and Benefit Expenditures on Contract Restrictiveness.
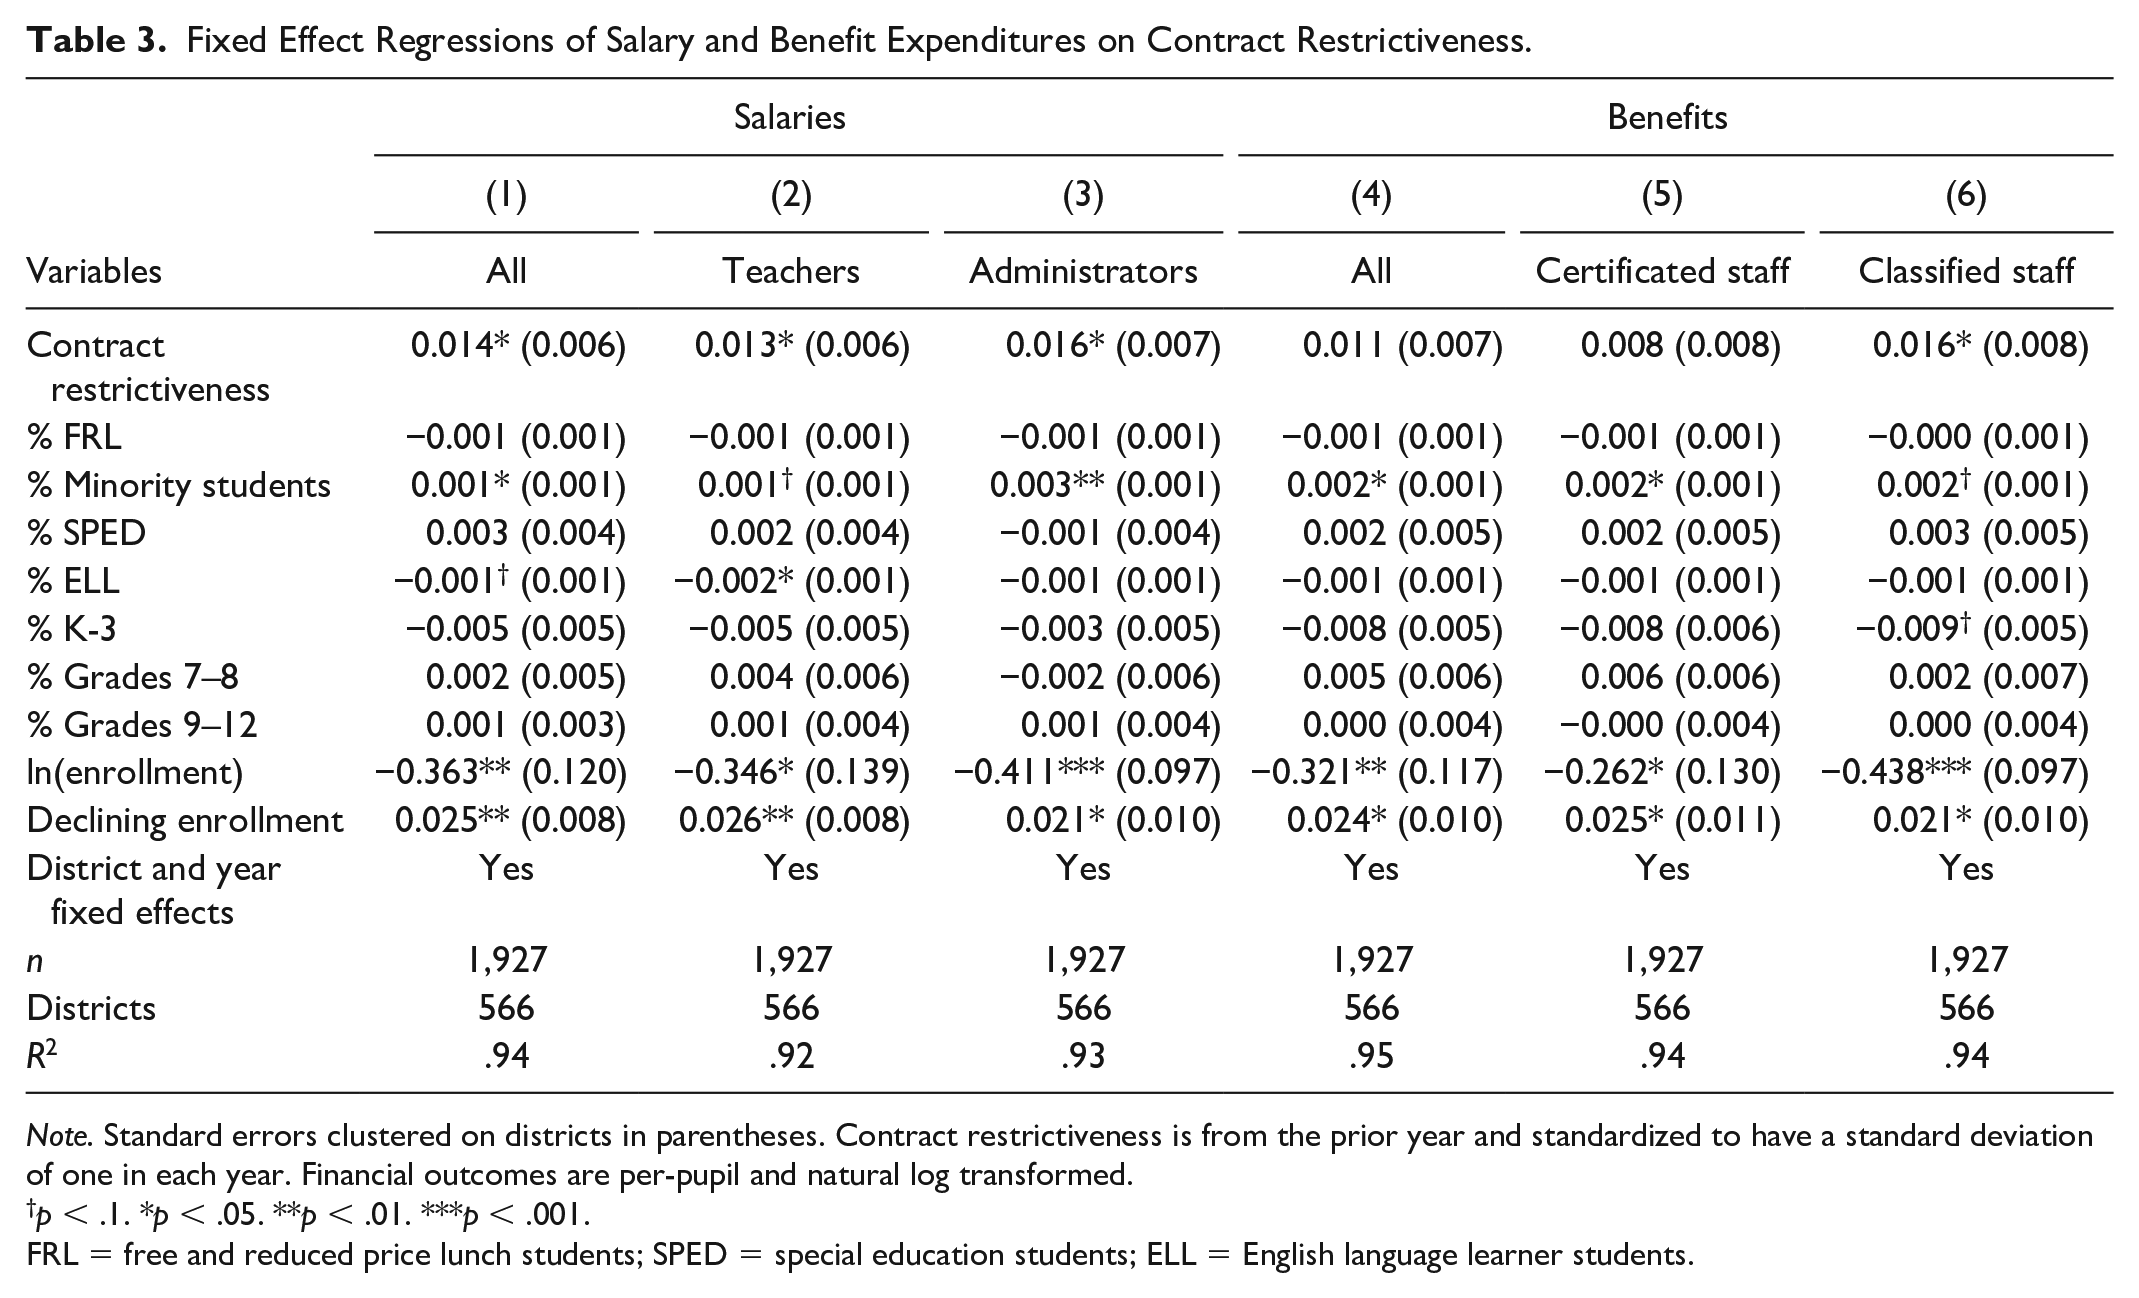
Note. Standard errors clustered on districts in parentheses. Contract restrictiveness is from the prior year and standardized to have a standard deviation of one in each year. Financial outcomes are per-pupil and natural log transformed.
p < .1. *p < .05. **p < .01. ***p < .001.
FRL = free and reduced price lunch students; SPED = special education students; ELL = English language learner students.
Spending on staff compensation can increase for a number of reasons, including raises negotiated into the salary schedule, increases in the education or experience levels of teachers, or changes in the number of staff per student. We consider several of these possibilities in Table 4. Increases in contract restrictiveness are associated with decreases in student-to-teacher and student-to-administrator ratios, suggestive of increases in the number of these staff per student. These estimates are not statistically significant but are sufficient in magnitude to explain a portion of observed increases in salary expenditures, particularly for administrators. The increase in the student-to-support staff ratio suggests that districts with stronger unions may shift staff away from pupil service roles (such as guidance counselors) and toward teaching and administrative staff, but this coefficient is imprecisely estimated. We find no evidence of changes in the average level of teacher experience; increases in teacher salary expenditures may therefore derive from increases in both the number of teachers and their overall salary levels.
Fixed Effect Regressions of Staffing Inputs on Contract Restrictiveness.

Note. Standard errors clustered on districts in parentheses. Contract restrictiveness is from the prior year and standardized to have a standard deviation of one in each year.
p < .1. *p < .05. **p < .01. ***p < .001.
FRL = free and reduced price lunch students; SPED = special education students; ELL = English language learner students.
District Outputs
As shown in Table 5, after controlling for district characteristics, including district fixed effects, contract restrictiveness is not significantly related to student achievement outcomes. This is true for both math and ELA outcomes, and regardless of whether outcomes are measured in terms of average scores or student proficiency rates. This suggests that stronger unions are not necessarily detrimental to student achievement. However, estimates are consistently negative across all four achievement measures; if contract restrictiveness is not clearly linked to diminished student outcomes, we find even less evidence that student learning is enhanced.
Fixed Effect Regressions of Student Achievement on Contract Restrictiveness.

Note. Standard errors clustered on districts in parentheses. Contract restrictiveness is from the prior year and is standardized to have a standard deviation of one in each year. Achievement measures are standardized within year across all districts in California.
p < .1. *p < .05. **p < .01. ***p < .001.
FRL = free and reduced price lunch students; SPED = special education students; ELL = English language learner students.
District Efficiency
Evidence presented above shows that stronger unions are associated with higher levels of district spending but not with changes in achievement. If districts are spending more and student learning is not improving, this suggests that districts with stronger unions also tend to be less efficient. To test this formally, we estimate models with the efficiency ratios as outcomes (Table 6). Because these ratios are transformed by the natural logarithm, the coefficients can be interpreted roughly as percent changes in efficiency predicted by a standard deviation increase in contract restrictiveness.
Fixed Effect Regressions of Efficiency Ratios on Contract Restrictiveness.

Note. Standard errors clustered on districts in parentheses. Outcomes are the ratio of the listed achievement outcome to per-pupil student expenditures, which is then natural log transformed. Contract restrictiveness is from the prior year and standardized to have a standard deviation of one in each year.
p < .1. *p < .05. **p < .01. ***p < .001.
FRL = free and reduced price lunch students; SPED = special education students; ELL = English language learner students.
As expected, estimates are uniformly negative and statistically significant. Depending on the achievement and expenditure measure used, a standard deviation increase in contract restrictiveness is associated with a decrease in efficiency of 1.3% to 2.4% (or 0.03–0.05 SD). Using the benchmarks suggested by Kraft (2020), efficiency effects in the magnitude of 0.03 to 0.05 SD can be considered small in size when compared with those obtained from other educational interventions. Back-of-the-envelope estimates based on these results imply that across all years of our data, a district with average student proficiency rates (46% in math and 52% in ELA) and average student spending per pupil (US$9,578) would be expected to spend roughly an additional US$200 (2%) per pupil with no change in student achievement for a standard deviation increase in contract restrictiveness.
Limitations
This study is not without a few limitations. First, we only measure efficiency using standardized achievement scores as our indicator of productive output. It could be that contract restrictiveness is associated with other productive benefits not fully captured by test-based measures of student learning. For example, a strong teacher CBA could build a more collaborative and caring school environment, which could result in improvements in teacher retention, student social-emotional learning, absences, suspensions, and on-time grade progression. While these factors are likely correlated with performance on standardized exams, employing alternative measures of efficiency could yield a different result than the one observed in this article. In addition, standardized tests only measure short-run student outcomes, making it impossible to say anything about the long-run effects of unions on school district efficiency. Unfortunately, given data constraints inherent to the California public datasets, we are unable to examine alternative measures of productivity.
Second, our results should not be interpreted as evidence that contract restrictiveness causes higher expenditures or overall district inefficiency. While we believe our estimates lean more toward causal evidence than those obtained in much of the prior work, they may still be susceptible to omitted variable bias, particularly from unobserved time-varying confounders. This is certainly an avenue for future research, particularly as states reform their collective bargaining regulations in ways that might allow for stronger causal identification.
Finally, our results do not generalize to all labor contexts. We generate estimates on the influence of teachers’ unions on school district efficiency by comparing districts along the margins of changes in contract restrictiveness. While doing so improves the internal validity of the estimates, it does limit, to some extent, the external validity of our study. These results are confined to California, where nearly all teachers in traditional public school districts are covered by a CBA and are represented by some of the strongest teachers’ unions in the nation (Winkler et al., 2013). Our results may not generalize to other states where not all teachers are represented by a union, where the scope of collective bargaining is different, or where schools are funded differently. Instead, our results provide an understanding of the efficiency implications of teachers’ unions in a context where unions are afforded a fairly robust scope for collective bargaining negotiations in a labor-friendly state.
Discussion and Conclusion
More than three decades of research on teachers’ unions have failed to empirically resolve theoretical claims about the effects of unions on school districts. We build on prior work by using a unique panel dataset of a novel measure of contract restrictiveness in a series of fixed effect models that control for time-invariant sources of omitted variable bias left unaccounted for in prior studies. Furthermore, we employ new measures of district efficiency that allow us to more directly explore the relationship between contract restrictiveness and the relative changes in district productive inputs and outputs over time.
We find some evidence that teachers’ unions are rent-seeking organizations and highlight the importance of simultaneously considering their influences on expenditures and productivity levels. When estimating just the relationship between contract restrictiveness and productivity, one might conclude that unions have no adverse effects on operations. However, when considered alongside our estimates of increased district expenditure levels, the same results provide suggestive evidence that expenditures are made less efficient by rigid work rules advocated for by unions.
Nevertheless, it is important to point out that the effect sizes we observe are small in magnitude. We would likely observe different effects in locations where unions face more or less favorable legal and political climates. For example, compared with their counterparts in many other states, school districts in California are relatively dependent on state aid. This may limit the ability of local teachers’ unions to bargain for higher spending levels, attenuating our expenditure results relative to what might be observed elsewhere.
Similarly, our analyses focus on school districts and unions that change the restrictiveness of their CBAs over time. We cannot speak directly to other mechanisms by which unions might influence district operations or to the aggregate impacts of unionization. For example, stronger unions might influence district operations not only by bargaining more restrictive CBAs but also by influencing school board elections (Strunk & Grissom, 2010) or inducing competition from charter schools (Stoddard & Corcoran, 2007). The effects of increasing CBA restrictiveness might also be dwarfed by the effects of forming (or disbanding) a teachers’ union in the first place. On one hand, given that CBA restrictiveness is correlated with teachers’ union strength (Strunk & Grissom, 2010), our results may indicate that unions have qualitatively similar effects on districts when advancing their interests through those other mechanisms. On the other hand, the moderating role of context and the diverse roles played by teachers’ unions mean that our results should be generalized cautiously.
Nevertheless, our findings have important implications for policy. New legislative activity designed to curtail union rights is frequently based on the premise that union actions reduce school efficiency by hamstringing administrators. We provide evidence that limiting contract restrictiveness (e.g., loosening collective bargaining rules) might indeed provide school leaders with some additional flexibility to manage their finances more efficiently. However, our estimated effect sizes suggest that the benefits of such changes would be minimal.
In short, we find little to suggest that wholesale reductions of union power in education will drastically improve the efficiency of school districts. But nor do we find evidence that status quo union power is benefiting students and schools. Our results suggest that a local, collaborative approach to modifying specific CBA policies that are the most detrimental to efficiency is warranted. Future research could help by identifying the specific policies that are the most helpful or harmful to district operations. Such an approach, built on evidence of the effects of collective bargaining and other union-supported policies, will maintain important teacher working conditions while removing obstacles to efficiency.
Supplemental Material
sj-docx-1-sgo-10.1177_2158244020988684 – Supplemental material for The Effect of Teachers’ Union Contracts on School District Efficiency: Longitudinal Evidence From California
Supplemental material, sj-docx-1-sgo-10.1177_2158244020988684 for The Effect of Teachers’ Union Contracts on School District Efficiency: Longitudinal Evidence From California by Bradley D. Marianno, Paul Bruno and Kathrine O. Strunk in SAGE Open
Footnotes
Acknowledgements
We gratefully acknowledge Leslie Landers, Michelle Widener, Dara Zeehandelaar, and our team of collective bargaining agreement (CBA) coders for their invaluable research support. We would also like to thank all of the school district personnel who provided us with copies of their CBAs.
Authors’ Note
The views expressed in this article do not necessarily reflect those of the University of Nevada, Las Vegas; the University of Illinois at Urbana–Champaign; Michigan State University; any of the districts included in this study; or the study’s sponsors. Responsibility for any and all errors rests solely with the authors.
Declaration of Conflicting Interests
The author(s) declared no potential conflicts of interest with respect to the research, authorship, and/or publication of this article.
Funding
The author(s) disclosed receipt of the following financial support for the research, authorship, and/or publication of this article: Funding for this study was provided in part by the Laura and John Arnold Foundation and an anonymous foundation. Institutional support was provided by the University of Southern California.
Supplemental Material
Supplemental material for this article is available online.
Notes
References
Supplementary Material
Please find the following supplemental material available below.
For Open Access articles published under a Creative Commons License, all supplemental material carries the same license as the article it is associated with.
For non-Open Access articles published, all supplemental material carries a non-exclusive license, and permission requests for re-use of supplemental material or any part of supplemental material shall be sent directly to the copyright owner as specified in the copyright notice associated with the article.