
Abstract
This study assesses the relative importance and explanatory power of five fundamental psychological motives for voting. Using United States survey data, we analyze self-reports on the motives of selfishness, duty, altruism, belonging, and social approval in relation to turnout. These motives have precedents in the literature, but they have not yet been evaluated simultaneously. We find that altruism and duty are the most important reported motives for turnout accounting for more than 60% of the allocations; selfish motives account for only about 15%. Turnout behavior responds positively to the motives of duty, altruism, and belonging, but it is dampened by the motive of selfishness. Turning out to vote emerges as an activity largely shaped by an individual’s social concerns and values.
Keywords
Introduction
The question, or “puzzle,” of why people vote has been tackled by participation scholars for decades and at length, but in some respects, it remains unsettled. 1 As Smets and van Ham (2013) describe, there is an “embarrassment of riches” in the abundance of explanations for why individuals vote. Indeed, the issue is not that we lack answers to the question of “why people vote” but rather that we lack measures of the relative importance of these different explanations. This article intends to provide such measures, in particular of the causes related to an individual’s psychological motives for voting.
We can conceptualize individual turnout behavior as being shaped by internal and external causes related to motivations, abilities, and barriers to vote (Harder & Krosnick, 2008, p.527). These factors address, respectively, why we vote, how capable we are to vote, and what external forces limit our capacity to vote. Trying to understand what motivates citizens to vote has generated much research, both theoretical and empirical. In general, the turnout literature has expanded from emphasizing narrowly construed selfish benefits and civic duty, toward the more recent accounts that incorporate other drivers such as altruism and group-based explanations.
The initial theoretical efforts to model why people vote concentrated on addressing the paradox of voter turnout: in most circumstances no or low turnout should be expected when purely selfish motives are at work (Downs, 1957; Riker & Ordeshook, 1968). Motives related to civic duty were among the first drivers invoked to counter the low turnout predictions. Theoretical work that came after explored reformulations of the original rational choice models and some of these efforts were able to achieve high-turnout equilibria, though often under hard-to-meet assumptions (Ledyard, 1984; Palfrey & Rosenthal, 1983, 1985). 2 More convincingly, newer strands of theoretical work have introduced further motivations for turnout, beyond selfishness and duty, such as social incentives (Abrams et al., 2010; Feddersen & Sandroni, 2006; Fowler, 2006; Hamlin & Jennings, 2011; Morton, 1991; Uhlaner, 1989). In the case of the empirical turnout research, the focus has frequently been on explaining variations in voting across time and locale. This work has often emphasized differences in citizens’ personal resources and social and institutional contexts, dimensions that are linked more to abilities and barriers to vote than to motivations (Arceneaux & Nickerson, 2009; Cancela & Geys, 2016; Gallego, 2010; Gerber & Green, 2000; Geys, 2006; Highton, 1997; Plutzer, 2002; Smets & van Ham, 2013; Verba & Nie, 1972).
By now, there is a multiplicity of explanations for what motivates people to vote. But, how do citizens themselves explain their motives for voting? How predictive of turnout behavior are each of these reported motives? And, in general, how important are selfish and duty motives, the original proposed drivers, versus social motives? The aim of this study is to provide an empirical assessment of the relative importance and explanatory power of the different posited motives for turnout.
Specifically, we consider five motives that have their roots in the turnout literature but which also have been found to influence individuals’ transactions and behavior more generally (Robison & Ritchie, 2010). These motives relate to some of our most fundamental needs and wants and can be identified as selfishness, duty, altruism, belonging, and social approval. Previous turnout literature has focused on subsets of these motives, but there have been limited empirical efforts to examine them simultaneously. The closest effort to examining these five motives would be Abrams et al. (2010) and Clarke et al. (2004), although neither of these studies accounts for altruism. Using national-level survey data from the United States we do the following. First, we assess the relative importance of each of the conjectured motives as expressed in self-reports. Second, we examine the explanatory power of the motives on turnout. And, third we compare the relative importance of selfishness, duty, and the social motives for voting to their relative importance in other types of activities (i.e., purchasing gasoline, getting a haircut, and recycling). The analyses reveal that altruism and duty, in that order, are reported as the most important motives for turnout. Turnout behavior is similarly sensitive to duty, altruism, and belonging, in a positive way, but it is dampened by selfishness. And, as expected, the type of exchange matters: social motives are more important among activities that emphasize the exchange of relational goods, such as voting and recycling, than among activities that emphasize the exchange of commodities, such as when purchasing gasoline. In general, the selfishness motive has a limited and limiting role in explaining why people vote.
In what follows, we introduce the five hypothesized motives (section “Motives for Voter Turnout”) and then our study’s expectations (section “Expectations”). Section “Data and Methods” describes the survey data used (two national surveys) and the associated methods, and section “Findings” presents our findings. Finally, the last two sections present alternative considerations and conclusions.
Motives for Voter Turnout
We describe next five psychological motives that can be used to explain voter turnout, while allowing for exogenous influences such as individual capacities and contextual barriers. The motives we advance for explaining voter turnout address selfishness of preferences (i.e., an interest in one’s own consumption of goods) and socio-emotional drives derived from the needs for internal and external validation, the well-being of others, and belonging (Robison & Ritchie, 2010). Following the original work of Maslow (1943), we consider fundamental needs that can then give rise to motives to acquire goods, including socio-emotional goods. Decision makers are assumed to allocate resources to enhance their own well-being and in response to their network of social relationships. In what follows, we identify these five motives as selfishness, personal duty (internal validation), altruism, belonging, and social approval (external validation). Our rationale for focusing on these five motives is that they can be considered comprehensive psychological explanations of different types of behaviors, as previously argued in work focusing on exchanges more generally (e.g., Robison et al., 2012; Robison & Ritchie, 2010). In the context of voting, each of them separately or in partial combinations have precedents in the voting literature. We argue that these motives may nearly exhaust the main psychological determinants for voting. 3 However, to the best of our knowledge, they have not been evaluated simultaneously. In what follows, we present each motive, ground them within the previous literature, and conclude with our specification for turnout.
Selfishness
We engage in many activities and exchanges to earn income and acquire commodities. This need to enhance our physical welfare selfishly motivates agents in most neoclassical economic models (Samuelson, 1947). In the voting literature, from the initial turnout studies of Downs (1957), Riker and Ordeshook (1968), and Tullock (1968), the assumption of individuals maximizing their own consumption is both a key feature and a point of departure. In some of these works, the expected payoff to voter

where
Personal Duty
One of our primary needs is for internal validation. This need motivates us to act in harmony with our ideals and is referred to here as “personal duty.” We seek our own approval when adopting behavior consistent with our core values and principles. In the context of voting, an individual may vote because of their belief that it is their duty and the “right thing to do.” Earlier on, Riker and Ordeshook (1968) argued that the D term in (a) captured an array of political satisfactions derived from voting, including “the satisfaction from compliance with the ethic of voting” (p. 28). Subsequent research has provided substantial evidence for a motive broadly related to duty, in particular civic duty (e.g., Blais, 2000, 2006; Blais & Young, 1999; D. E. Campbell, 2006), though scholars have emphasized different aspects including the following: intrinsic benefits, such as “I enjoy complying with the act of voting” (Riker and Ordeshook, 1968); expressive benefits, as in “I enjoy expressing myself, my party, or my nation when voting,” (Aldrich, 1993; Fiorina, 1976; Hamlin & Jennings, 2011; Hur, 2017); and contingent benefits, as in “I enjoy voting per se, but potentially even more when the stakes are high” (Goodman, 2018). In general, the turnout literature has continued to grapple with how to model and interpret ethical and moral considerations. Goldfarb and Sigelman (2010) have argued that civic duty is best incorporated as a constraint, rather than as a taste, since “a sense of duty is a norm” (p. 285). Goodman (2018) explores the coexistence of a traditional dimension to civic duty from an intrinsic sense of commitment and a contingent dimension influenced by contextual electoral factors. Finally, in the rule-utilitarian models, such as Feddersen and Sandroni’s (2006), ethical behavior to vote emerges endogenously, as opposed to being intrinsic or contingent, when agents are assumed to take into account social welfare in their decision making. 4 In this study, when we refer to personal duty, we are considering internal psychological rewards from acting in accordance with one’s ideals.
Altruism
We are altruistic when we take costly actions to accrue benefits to others. Altruism is at work when an individual internalizes the well-being of others. A substantial body of work in economics and psychology has examined the role of altruism in exchange behaviors (Andreoni & Miller, 2002; Camerer, 2003; De Waal, 2007; Eisenberg & Miller, 1987; Fehr & Fischbacher, 2003). The experimental dictator games in which a player gets to allocate money between herself, and another player at her discretion have revealed the remarkable extent of the altruistic motive. Based on a meta-analysis, players in these games give or share around 30% of their endowment with others (Engel, 2011). In the context of voting, an altruistic citizen may turn out to vote to support a party or a policy outcome that is expected to provide benefits to those citizens she cares about (Edlin et al., 2007; Fowler, 2006; Fowler & Kam, 2007; Jankowski, 2004, 2015). For example, in Edlin et al. (2007), the
Belonging
We carry out many activities to feel connected to other people, causes, and organizations, and to achieve a sense of belonging. Voting can be a behavior that connects us to relevant social groups, such as family, neighbors, and local organizations, as well as causes, such as those of candidates, parties, and even nations. There are various strands within the turnout literature that address the need for connectedness and belonging, from models that emphasize expressive factors to models that stress group-level mobilization efforts. Schuessler (2000) developed in detail the notion of expressive voting in which individuals can be motivated to vote to attach themselves to a political outcome to which they identify (see also, Brennan & Lomasky, 1993; Fiorina, 1976; Hamlin & Jennings, 2011; Hillman, 2010). Voting in this framework is akin to belonging to a club. An individual’s utility for a favored candidate has an expressive benefit that does not depend on the probability
Social Approval
We seek external validation when we act in ways to earn the “goodwill” and approval of significant others. That is, we can experience rewards from the social validation extended to us by others. In the context of turnout, an individual may vote to gain the approval of those socially close such as family, friends, and colleagues. Abrams et al. (2010) present a voting model that emphasizes the role of informal social networks, as opposed to large formal groups, in spurring turnout. Their model, as well as Clarke et al.’s (2004), is close to ours in the extensiveness of the motives included; altruism, though, does not have an explicit role in their presentation, neither in Clarke et al.’s. In their model, individuals may emulate the behavior of those socially close to them; if their close network considers politics important, then they are incentivized to vote to gain their approval and avoid their disapproval. The instrumental
Putting It All Together
In general, we assume individuals choose a level of political participation that maximizes their expected social and economic utility, given the benefits they derive from participating while constrained by resource-related costs, as in Benabou and Tirole (2006) and Valdivieso and Villena-Roldan (2014). That is, in our specification an individual chooses a level of participation that maximizes,

where
To motivate the empirical results, we provide a basic example of a utility function (a logarithmic transformation of a Cobb-Douglas function) that illustrates our concepts:

When maximizing, and by first-order conditions, the optimal level of participation


Based on Equation (6), the
The first objective of this study is to empirically estimate these drivers for voting. To do this, we asked respondents to report the relative importance of the motives by allocating 100 points across them, under the assumption of maximum participation

Since we do not know ∑k or
Our second objective is to examine if and how the motives explain reported voting behavior. Continuing with our sample utility function, optimal participation levels are determined as in Equation (7). For a given marginal cost

where
Finally, our third objective is to validate the
Expectations
We now present three primary hypotheses that address motive aggregate allocation, motive behavioral impact, and motive comparative allocation.
Motive Aggregate Allocation (H1)
How important is each reported motive? There is no previous study that has sought reports, and therefore empirical baselines, on all five motives that we have described. As a result, there is limited information that can guide our expected rankings of reported motives. Nonetheless, we believe two exploratory comparisons can be presented. Since the formative works of Downs (1957) and Riker and Ordeshook (1968), much of the theoretical turnout literature has sought motives besides pure own consumption to achieve plausible large turnout equilibria. Given the difficulty of constructing an explanation of voting behavior based exclusively on selfishness of preferences, we conjecture that selfish motives exist but that they will play a small role in respondents’ reports compared to all other motives. We hypothesize that at the aggregate level (
Motive Behavioral Impact (H2)
What impact do motives have on behavior? The aggregate reported importance of a motive, as mentioned earlier, does not necessarily translate into importance at the time of explaining behavior. For example, respondents on average may give equal weight to each motive, but in terms of propensity to vote, duty may be the sole discriminant between high- and low-frequency voters. Different studies have identified linkages for most of the posited psychological motives and turnout, but there is wide variation in what gets included in each specification and no consistent ordering in the strength of the effects. For example, if we focus on studies with the most comprehensive specifications, Clarke et al. (2004) in an analysis of 2004 British elections find that “system benefits,” akin to citizen duty, has the largest effect on turnout, by 41%. Abrams et al. (2010), examining a U.S. online panel from 2004, find instead that social disproval and the importance of political knowledge have the largest impact on turnout, by 30%. Both studies exclude altruism. Jankowski (2015) and Fowler (2006) find that in their respective U.S. samples of study, altruism interacted with partisan-related measures, are the strongest predictors of turnout; civic duty and social approval are respectively excluded. Finally, in Smets and van Ham’s (2013) meta-analysis of individual-level turnout research, civic duty, caring about who wins, and having voted in the past election are among the factors with the highest effect sizes, though they caution against definitive conclusions about relative strength because of the varying model specifications. From this body of research, we conjecture more supporting empirical evidence for personal duty, social approval, and altruism motives. As such, we expect the following (
Motive Comparative Allocation (H3)
Are the motives for voting theoretically and empirically sound? If the motives advanced are appropriate constructs, their relative importance should vary in expected ways as we examine largely different activities. Previous work examining these five motives suggests the importance of selfish motives versus duty and more social motives varies depending on the activity. In a hypothetical prisoner-of-war setting, Robison et al. (2012) find that when having to allocate a finite resource, participants are driven first by own consumption concerns but not as a prime motive: while participants keep 33% of the resource for themselves (selfishness), they give up 19% to keep a promise (personal duty), 25% to help others (altruism), 9% to enlist approval (social approval), and 14% to be part of the group (belonging). In the context of recycling, Jin (2013) surveys university personnel about these five motives and finds their allocations to be a low 8% for own consumption, but 28% for self-respect (duty), 56% for altruism, and 5% for goodwill and belonging. These results are in line with the literature on relational goods that emphasize the importance of social connections and empathy in driving socio-emotionally rich activities such as recycling and voting (Bruni & Stanca, 2008; Robison & Ritchie, 2010; Uhlaner, 1989). We conjecture then (
Data and Methods
The data for our main analyses were produced by two commissioned online surveys implemented, respectively, through polling by Amazon Mechanical Turk (MT) in late 2013 and Growth from Knowledge Group (GFK) in early 2014. In each survey, we sought samples of around 1,000 respondents. MT samples are recruited through Amazon’s crowd-sourcing labor market platform; participants are paid small amounts of money for completing the surveys. The MT survey enlisted 1,018 participants from October 31, 2013, to November 15, 2013 and, after excluding incompletes and invalid cases, results in a data set of N = 990. The MT survey included questions on motives for voting as well as for three other activities: purchasing gasoline, getting a haircut, and recycling. GFK is a world-wide polling enterprise noted for its online probability-based sampling platforms. The GFK survey obtained 1,019 respondents from the 3,150 entrants in their weekly omnibus survey of March 7 to 10, 2014, making for a response rate of 32.3%. After exclusions, the complete data set consists of N = 981 cases. Respondent weights were also provided and used, though results remain the same in unweighted analyses. The GFK survey included questions solely on motives for voting. Both the MT and GFK surveys incorporated relevant background demographic information.
We commissioned two surveys to assist both with reliability and generalizability. Given its lower cost and ease of implementation, the MT survey was designed as a large instrument, with an expansive questionnaire. However, since we are eliciting subjective reported motives, it was valuable to obtain another sample of study to alleviate concerns with reliability (Nisbett & Wilson, 1977). The GFK survey was designed as a shorter instrument but obtained with sampling techniques and weights, which helped allay concerns with representativeness. Even though there is evidence pointing to the advantages and adequateness of using online convenience samples such as Amazon’s MT, in particular with proper controls (e.g., Levay et al., 2016; Mason & Suri, 2012), including the GFK survey attained through probability-based sampling provides further confidence with regards to generalizability.
Appendix A compares the MT and GFK samples to population estimates in terms of select background variables and turnout rate. As would be expected, the MT sample is compositionally somewhat younger and with lower income than the U.S. Census population estimates; it is also more Caucasian and more highly educated. The GFK sample on the other hand is demographically very much on target. There is likely over-reporting of turnout in both the MT and GFK samples, a common finding in survey work; however, there seems to be less of an incidence in our samples. For example, while over-reporting in the MT sample with regards to having voted in the last general election (2012) was around 11%, over-reporting in the well-known ANES and CCES election studies was, for that election, close to 20% and 25%, respectively (Enamorado & Imai, 2019). One possibility is that over-reporting of turnout is lessened when the general survey instrument is not focused exclusively on political items.
The central focus of this study is the importance of each of the five motives for voting. To elicit their relative importance, respondents were asked to allocate percentage points, from 0 to a 100, to each motive, such that the five percentages add to 100. The “motives for voting” question was included in both the MT and GFK surveys and was posed to all respondents. Those who do not vote were prompted to answer the question as a hypothetical. Respondents were also allowed to indicate other motivations for voting, in an open-ended format, but only in the MT survey. Descriptive prompts for each motive are provided below (the motives’ name was not shown) and the full question wording can be found in Appendix B.
To be clear, we obtained motivations for turnout from all respondents, including nonvoters. This was done specifically to probe how the different motives influence turnout (so, nonvoters had to be included) and to assist in making comparisons across the different activities using the same samples. Also, the study is based on self-reports which can give rise to measurement concerns with social desirability and biases toward prosocial motivations and behavior. This is an important issue that can cloud interpretation. Because of this, in the robustness section, we discuss the results under different specifications, although, these types of effects cannot be entirely ruled out.
The reported motives for voting are then analyzed as outcomes (
Findings
We begin our analyses by examining the aggregate allocation of motives. Figure 1 shows the relative importance (mean scores) of each motive for voting within the MT and GFK samples and Table 1 presents the relevant statistical tests. In Figure 1, we observe a clear and consistent ranking among the motives. For both the MT and GFK samples, the order of importance is: (a) altruism, (b) personal duty, (c) belonging, (d) selfishness, and (e) social approval. Altruism is the driving motive among respondents: averaging 44% and 36% in the MT and GFK samples, respectively. Personal duty is the second most important reported reason, with MT and GFK averages of 23% and 28%, respectively. Clearly, with close to two-thirds of the allocations, altruism and personal duty are the most important reported drivers of voting. By contrast, selfishness is the second to last motive, with averages of 13% in the MT sample and 16% in GFK. The smallest allocation goes to social approval, at 2% and 3% in the MT and GFK samples, respectively. Given prior research, this was somewhat unexpected, but one possibility is that respondents were disinclined to report this motive as worded, in which case, this driver was not entirely captured. In future work, we hope to further clarify this. Specifically, the omission of “family members” in the social approval prompt may have skewed the allocations. The similarity of the results across the two samples is remarkable, which bolsters our cross-activities analyses (below) that rely exclusively on the MT sample.

Mean scores of motive allocations for voting: MT and GFK samples.
Mean Relative Importance of Motives for Voting: MT and GFK (U.S.) Samples.

Note. Respondents allocated 100 points across motives. Entries are means, standard deviations, t statistics, and p-values. Tests are two-sided. MT = mechanical turk; GFK = growth from knowledge.
Having established the ranking of each motive, Table 1 presents t-tests of difference of means for our first hypotheses (
Examining the motives’ aggregate allocations establishes the centrality of altruism and personal duty but also clarifies the need to recognize all motives since each is trivially distinguishable from a null of no allocation. This implies that when modeling turnout decisions, motives related to self-interest, duty, and social relations should all be accounted for.
Next, we examine the impact of motives for voting on behavior. Table 2 presents estimates from logit models predicting whether a respondent is a frequent voter (i.e., one who votes in every/most elections) for the MT and GFK samples. Since the motives’ scores are linearly dependent, they cannot be all included simultaneously in our nonlinear models. Therefore, we begin our analyses by excluding the selfish motive from the specifications, as the initial slack variable of interest, and marginal effects for the other motives are estimated at the expense of reductions in selfishness. 6 Models 2A and 2C include the four nonselfish motives and models 2B and 2D include these motives and socioeconomic variables as well. In terms of model fit, the specifications that include both motives and background characteristics are preferred over the ones that include just motives (χ2 = 76.7 for MT; χ2 = 121.8 for GFK). This is to be expected, given that the turnout literature has provided much evidence that resource-based factors matter (e.g., Smets & van Ham, 2013; Wolfinger & Rosenstone, 1980). In this regard, we obtain results consistent with previous evidence: age and education are statistically significant in both the MT and GFK models, in a positive direction; full-time employment is positive and statistically significant in the MT sample; and high income is positive and statistically significant in the GFK sample.
Logit Models Predicting Being a Frequent Voter Given Motive Scores and Controls: MT and GFK (U.S.) Samples.

Note. The dependent variable is “1” if respondent votes in every or most elections; “0” otherwise. GFK sample fitness tests are with unewighted data for ease of comparison to the MT sample. Selfishness is the omitted motive. MT = mechanical Turk; GFK = growth from knowledge.
Significance levels are *p < .05. **p < .01.***p < .001.
Table 2 shows that duty, altruism, and belonging, at the expense of selfishness, increase the likelihood of being a frequent voter, while social approval dampens these chances. In the MT sample (Model 2B), when we change the duty motive score ±20% points around the mean (about ±1 SD in the excluded motive), all else at mean or modal values, the corresponding change in the predicted probability of being a frequent voter is 0.14 points, the largest positive effect. The corresponding changes in probabilities for the other motives are a bit smaller but positive, 0.06 (altruism) and 0.08 (belonging), or negative, −0.15 (social approval). The substantial effect for social approval is in part the result that the toggle is largely spanning this variable’s range. A toggle of social approval by ±10% points (~1 SD), instead of ±20% points, reduces its marginal effects by half. We view the results related to social approval with caution since, as mentioned earlier, this motive’s importance may not have been entirely captured. All changes in probabilities are statistically significant at conventional levels. In the GFK sample, we encounter the same pattern. A toggle of ±20% points in the duty score around its mean, all else equal, has the largest positive effect, at 0.21 points. As in the MT sample, the other motives experience somewhat smaller changes, 0.14 (altruism) and 0.18 (belonging), or a negative one, −0.18 (social approval). All changes are statistically significant. At the bottom of Table 2, we report relevant tests of contrasts among these probabilities. While the marginal impact of duty can be distinguished from that of altruism, it is statistically indistinguishable from that of belonging, which in turn is indistinguishable from altruism.
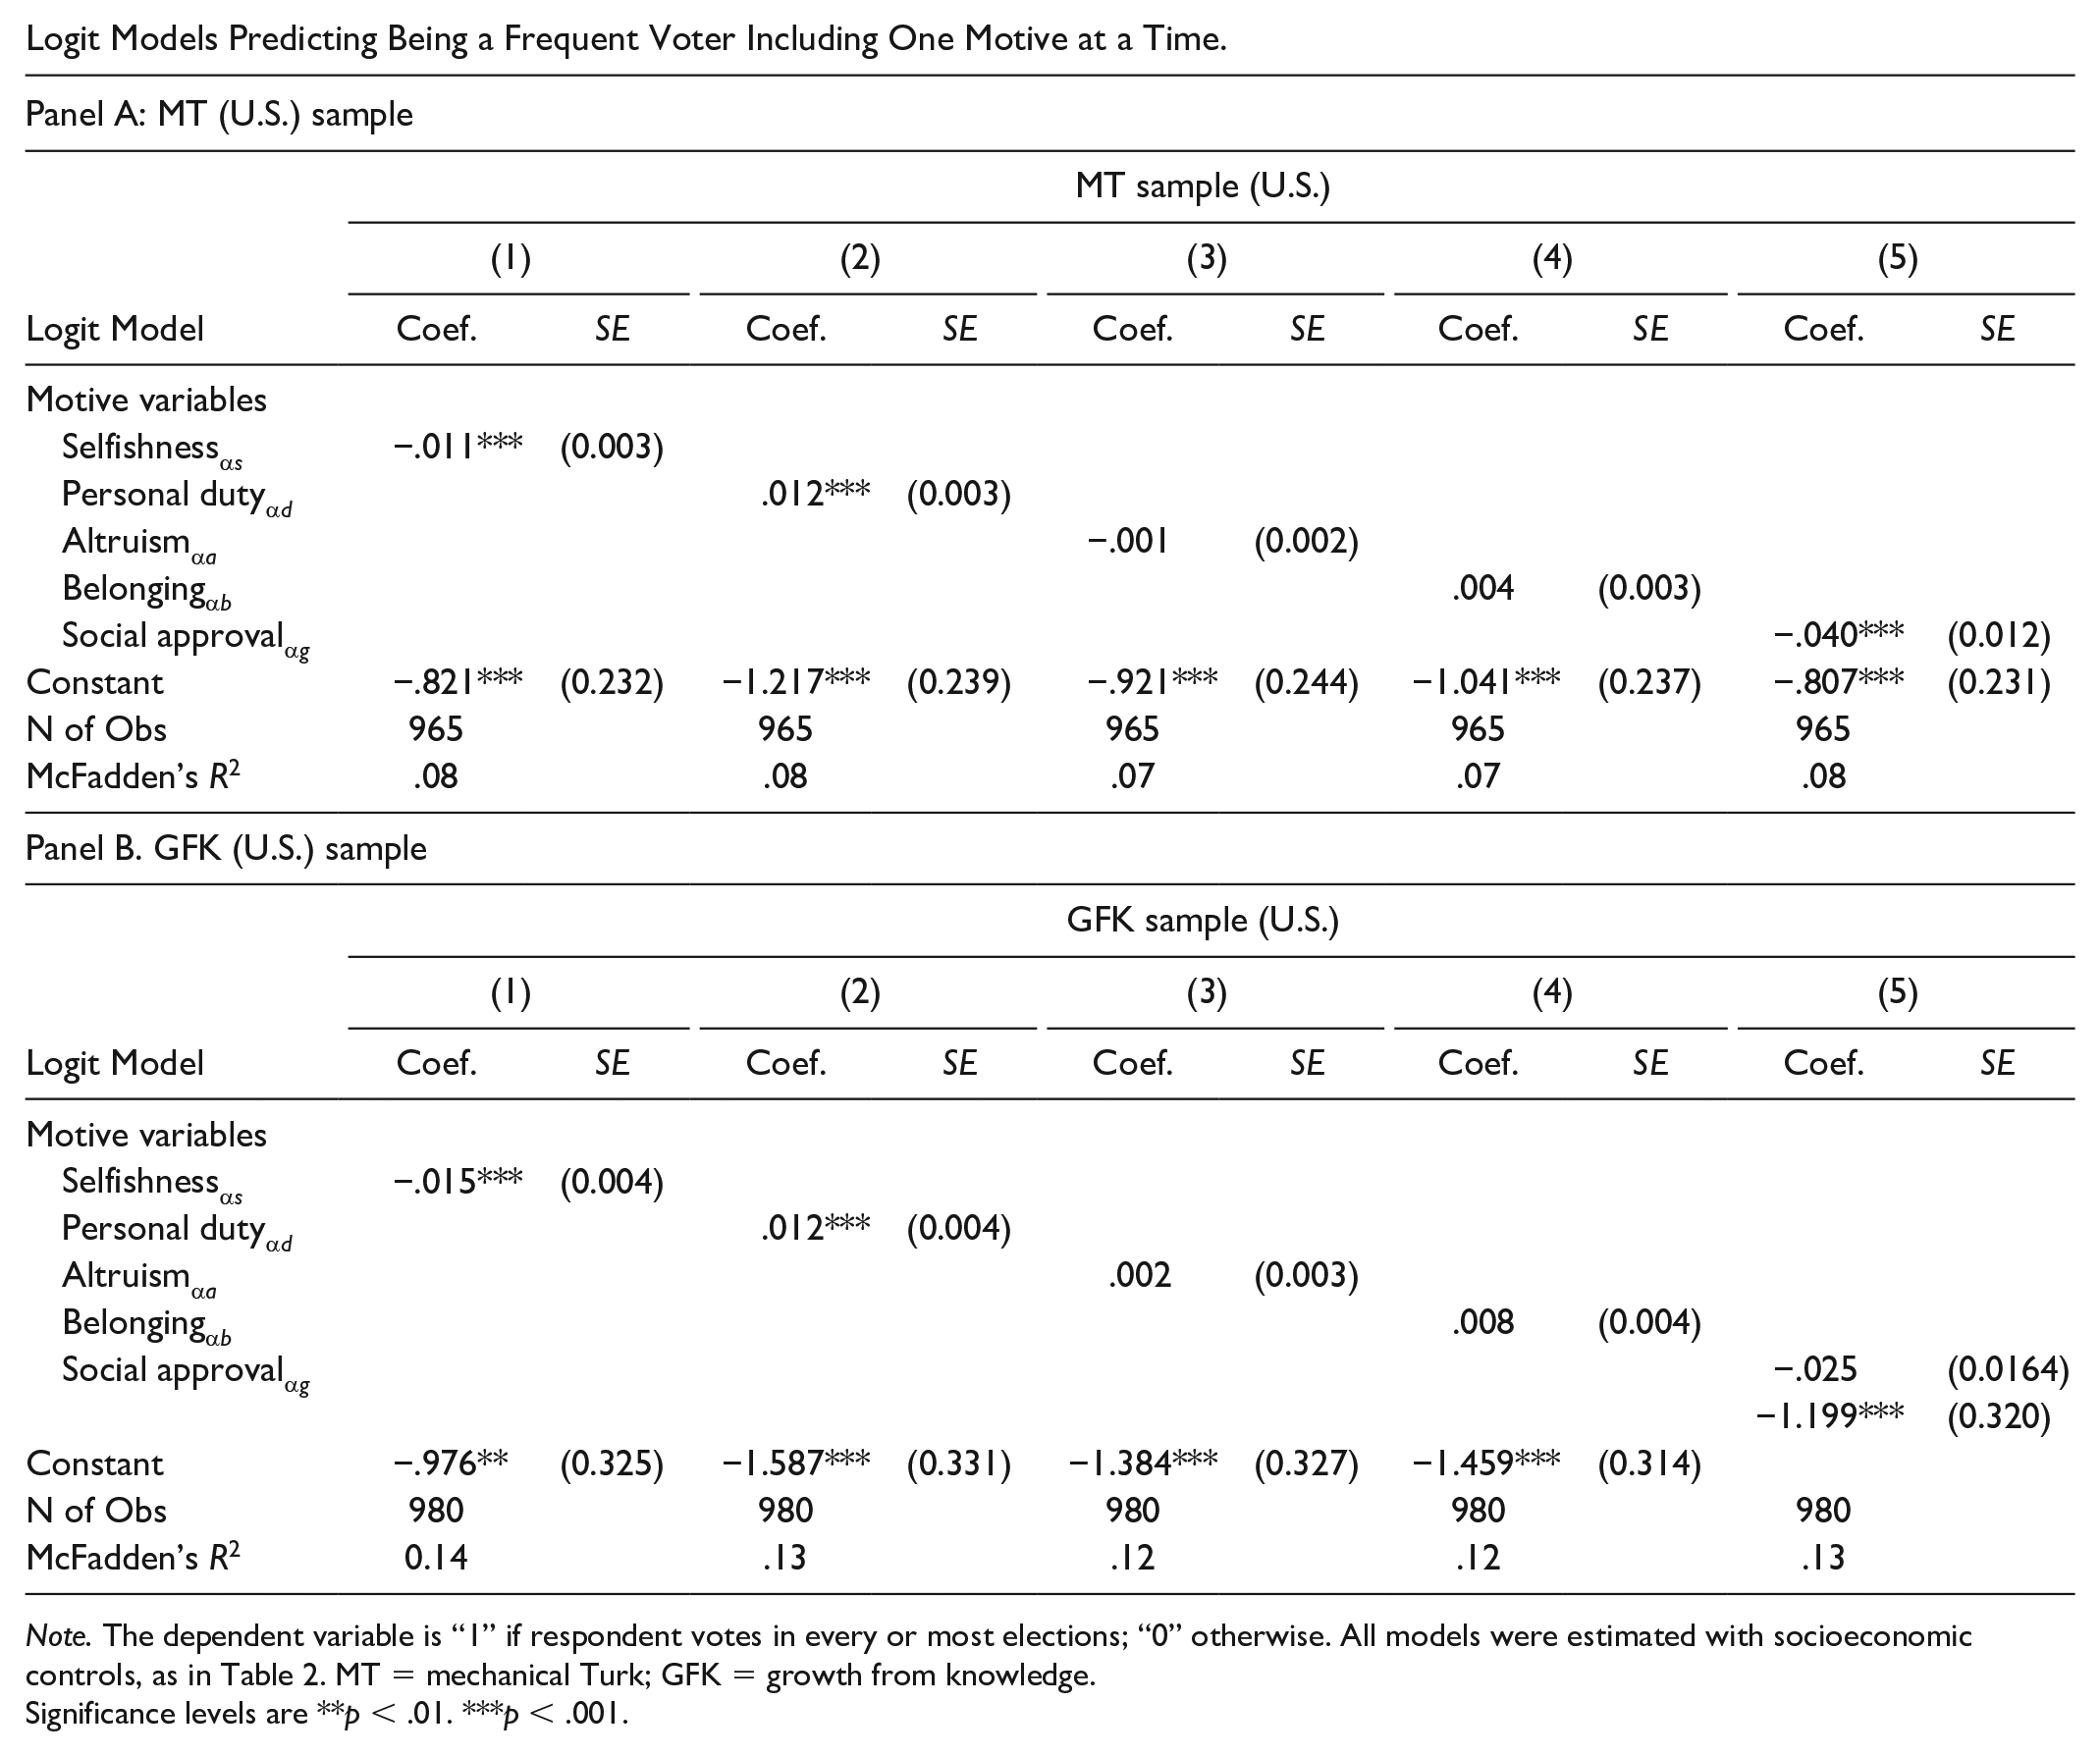
The models in Table 2 allow us to measure the tradeoffs between each nonselfish motive and selfishness. Still, the impact of selfishness remains opaque. A complementary approach to address this challenge is to contrast each motive against all others by including only one motive at a time in the estimation. For example, running a logit model predicting frequent turnout that only includes the selfish motive (plus background factors) allows us to contrast the effect of selfishness at the expense of all other motives combined. Such estimation models, but for each of the motives and samples, can be found in Appendix C, while Figure 2 provides the relevant response curves. Specifically, Figure 2 shows predicted probabilities of frequent turnout as a function of each of the motives, as they range from 0 to 60 percentile points. The red line in each graph highlights the mean of the respective motive. Largely, the same observations can be made from the MT (Panel A) and GFK (Panel B) samples. If we focus on the responsiveness around the means in each graph, which are the areas where the data are more likely, we see that duty and belonging (and minimally altruism) have a positive influence on frequent turnout, while selfishness and social approval on the other hand reduce turnout chances. The critical graph to zero in on, is in fact, the one for selfishness because there we can examine a relevant trade-off that was missing: selfish motives versus nonselfish ones combined. In this setting, turnout behavior is distinctly diminished by selfishness.

Predicted probability of being a frequent voter and motives: MT sample (Panel A) and GFK sample (Panel B).
In general, the results suggest duty, altruism, and belonging positively modulate the propensity to turnout, with personal duty at the lead. As hypothesized (
We end our main analyses by comparing the allocation of motives across different activities (
Mean Motive Scores Across Activities in the United States, Australian, and Argentinian Samples.

Note. MT = mechanical turk; GFK = growth from knowledge.
Robustness and Limitations
In what follows, we further probe our study’s findings as well as highlight its limitations. Specifically, we examine issues related to background correlates and spuriousness, nonvoters, further motivations, omitted variables, motives in contexts beyond the United States, and satisficing and social desirability biases from self-reports.
Background Correlates and Spuriousness
We view our hypothesized motives as psychological drivers that can influence behavior, but other personal characteristics could be influencing both reported motivations and behavior. The results presented in Table 2 provide preliminary evidence that this is not the case: the estimated coefficients for the motives remain substantively the same when we compare the motives-only models (2A and 2C) to the models with both motives and personal socioeconomic characteristics (2B and 2D). Furthermore, we estimated models predicting separately each of the motive’s scores as a function of personal socioeconomic characteristics, both for the MT and GFK samples (Supplement B). Out of the 40 coefficients for each sample, 3 were statistically significant in the MT sample and 7 in the GFK sample, suggesting again that spurious linkages are not a significant concern. Variations in motives reflect psychological traits that are not immediately determined by one’s socioeconomic context.
Nonvoters and Voters
All respondents were asked to allocate points across motives—even if they did not vote. This was done explicitly to link motives to turnout and to have the same samples when making comparisons across different activities. Nevertheless, two items remain pending: how do voters and nonvoters differ in terms of motive importance and how do motives impact the propensity to vote when nonvoters are excluded? To address the first question, we re-examined the motive allocation separately for each group (Supplement C). For example, in the MT sample (first column of Supplement C) if we exclude the 150 nonvoting respondents (~15%), we obtain for voters the following mean scores: 12% (selfishness), 25% (duty), 44% (altruism), 18% (belonging), and 2% (social approval). The MT and GFK motive allocations for voters are substantively the same as those obtained with the full sample (Table 1). A key distinction between voters and nonvoters’ allocations is that selfishness trumps personal duty among the latter. With regards to the second query, we re-estimated the models predicting turnout behavior but now excluding nonvoters and adjusting the dependent variable to flag among voters those who vote in every election (1), versus those who vote in very few, some, or most elections (0) (Supplement D). This new specification is getting at the propensity to vote frequently, among those who vote on a somewhat regular basis. For both samples, as in our main analyses (Table 2), we find that duty, altruism, and belonging are positively related to turnout though only belonging (in the MT sample) and personal duty (in the GFK sample) achieve statistical significance. In general, as might be expected by excluding nonvoters the motive effects are reduced.
Further Motivations
To address the possibility that other key drivers are at work, the MT survey allowed for other reasons to be reported, in an open-ended format, after having allocated the 100 points among the five motives. From the MT sample of 990 respondents, 150 (or ~15%) wrote in other reasons; 129 of these 150 add-ins can be recategorized into one of our five existing motives, whereas only 21 of the answers (~2%) seem to be addressing a motive or reason we had not put forth. Of the 129 responses that we can categorize, they include reasons as follows: “to get my voice heard,” which can be assigned to “belonging”; “there is an important issue I would like to see set in place” and “to try and make a difference,” which can be mapped with “altruism”; and “if you don’t vote you have no right to complain” and “I feel bad if I don’t,” which can be assigned to “duty.” Of the 21 responses that do not quite match our motives, a few address reasons related to accountability (three responses) and expressive voting (two responses), but most are related to preemption reasons (16 responses), such as “to keep someone out of office,” “to prevent people I disagree with from being elected,” “I wanted to vote Obama out,” and “I vote to keep Republicans out of office.” Preemption reasons could be linked to motives of “belonging” but through opposition by expressly denying a social bond with an individual, group, or cause. Overall, we did not uncover major unaccounted motives at work.
Omitted Variables
When examining the impact of motives on turnout behavior, we omitted certain variables that have been found in the literature to be consistent factors of influence: residential mobility, voted in previous election, party identification, political interest and knowledge, and media exposure (Smets & van Ham, 2013). Our surveys included three of these factors: residential mobility and voted in the previous election were in the MT survey and partisanship was in the GFK survey. We re-estimated the full models in Table 2 after including these additional variables (Supplement E). In the MT sample, “years in the community” is not statistically significant, whereas “voted in the last election” is statistically significant and, as expected, a very strong predictor, by 0.78 points. The motives variables are dampened and lose their statistical significance except for social approval. However, we view this specification merely as confirmatory rather than as the final model for estimation because motives and past behavior are themselves intertwined and in precisely the ways we are trying to tease out (e.g., habitual behavior can be the result of motives for duty and belonging). Indeed, if we estimate instead a logit model predicting “voted in the last election,” we obtain essentially the same results in terms of significance and size of the motive effects as in Table 2 for the MT sample (Supplement F). In the GFK sample, adding the measure of “strong partisan,” which captures whether a respondent identifies as a strong Republican or a strong Democrat, barely changes the estimated coefficients, statistical significance, and associated probabilities of each motive (Supplement E).
Other Contexts
The two commissioned surveys for this study were based in the United States and only U.S.-based respondents were considered for the analyses. Examining reported motives in a comparative setting, across a full array of countries, would be the basis of an entirely new study. Nevertheless, we sought to obtain preliminary insights by commissioning two small (N ≈ 200) online surveys in Australia and Argentina in early and mid-2014. The surveys were carried by Cint, a global survey enterprise that includes internet crowd-sourcing, like Amazon’s MT services. We chose Australia and Argentina as preliminary cases because both countries have compulsory national voting and apply sanctions if no legitimate reason for abstention has been put forth, including minor financial penalties (International Institute for Democracy and Electoral Assistance [IDEA], 2018). Therefore, we expect both personal duty and selfishness (through concerns for sanctions) to become more relevant for voting in these new samples compared with the U.S. context. We confirm these expectations, in most of the instances as shown in Table 3 (Panels B and C). Personal duty averages 23% in the U.S. sample but increases to 28% in the Australian sample and notably to 42% in the Argentine sample. Selfishness averages 13% in the U.S. sample and increases to 18% in the Australian sample but decreases to 10% in the Argentine sample, which might be the result of less-stringent enforcement in the Argentine context. In general, the increased prominence of duty under compulsory voting conforms with our expectations; however, this does not ensure more engaged political participation. As recent research has shown, compulsory voting can be linked to increases in invalid voting (Kouba & Lysek, 2016, 2019) and invalid voting can at times stem from, among other considerations, lack of interest, and disengagement (Moral, 2016; Singh, 2019). It remains to be seen whether and how more duty-driven citizens contribute to invalid voting in different contexts. 8 Finally, as in the U.S. case, in the Australian and Argentine samples, we see as expected a decrease in the selfishness motive and increases in the social motives as we move from arm’s length exchanges (purchasing gasoline) to more social activities (recycling and voting).
Self-Reports
Our study is, by design, eliciting subjective reports and as such is subject to the common concerns with survey work, namely that the data are hypothetical (i.e., elicited without actual incentives being in place) and subject to potential satisficing and social desirability biases (i.e., people may take cognitive shortcuts when responding and they may report what others socially expect them to). These limitations hold for this study. Nevertheless, several clarifications can be made. First, both surveys were online and anonymous, which, are formats that can help reduce social desirability biases (Holbrook & Krosnick, 2010; Larson, 2019) and the voting questions were placed within larger instruments without a concerted focus on politics or political participation. Second, the literature on vote over-reporting, which in part addresses responses being driven by social desirability, has found that high-resource individuals (i.e., those with more education, income, engagement in public affairs, and length in the community) are the types more likely to misreport their vote (Ansolabahere & Hersh, 2012; Enamorado & Imai, 2019; Silver et al., 1986). When we consider some of these factors as predictors of socially based motives (Supplement B), we do not find consistent associations. Also, this study analyzes multiple surveys—two in the United States for replication purposes and two preliminary ones in settings with distinct incentives (i.e., penalties for failure to vote). The way in which the results are comparable across the U.S. surveys and vary when introducing the non-U.S. surveys support the notion that we are plausibly tapping into these motives. Last, the comparisons of motives across activities, including activities less likely to trigger primed answers such as purchasing gasoline, were in line with our expectations; again, this suggests we may be reasonably eliciting respondents’ motives.
Conclusions
This article examines why people vote and who votes by analyzing reports on five fundamental motives for voting: selfishness, duty, altruism, belonging, and social approval. Each of the motives has precedents in the turnout literature but up until now have not been jointly evaluated. Therefore, we provide a much-needed empirical baseline with regards to their relative standing and influence. In the United States context, if a citizen turns out to vote, we find that altruism and duty are reported as the main psychological motives behind that decision, with more than 60% of the allocation. In one of the study samples, altruism accounts for 44% of the underlying motivation and personal duty accounts for 23%. Meanwhile, selfish motives account for only 13%. Individuals explain their voting motives as centered on doing well by others and their causes and by their own ethical commitments—their selfish consumption concerns play a very minor role.
In terms of behavior, turnout is positively responsive to the duty, altruism, and belonging motives when contrasted to selfish motivations, with personal duty at the lead. That is, the types of individuals who give more importance to these drivers, at the expense of selfishness, are more likely to be frequent voters. One implication is that mobilization efforts could be focused around these socially driven considerations, as already shown in some field experiments (e.g., Gerber et al., 2003; Gerber & Rogers, 2009). Such efforts could prove substantial for turnout because the linkages are considerable: ±20% points toggle in the importance of one of these motives can translate into changes in the likelihood of frequent turnout ranging from 0.06 points to 0.21 points. Turnout behavior is negatively associated with selfish considerations. This result might be in line with previous conceptions in the literature that voting in the United States is in general a “low-stakes decision,” or a marginal decision (Aldrich, 1993; Blais, 2000). Citizens in the United States context are not heavily invested in voting for the expectation of large personal benefits, as also revealed by their limited willingness to expend resources on this activity. In our MT survey, respondents were willing to wait, on average, only 1 hour to vote and the median respondent would only travel up to 5 miles to do so.
We hope our research encourages follow-up research queries and we identify a few promising ones. First, our study as designed and implemented cannot entirely rule out the presence of social desirability effects in the respondents’ self-reports. Future work could replicate the study but with an additional battery of questions specifically designed to control for desirability biases (see, Larson, 2019) and with improved wording to better capture social approval motives. Also, a design based from more expansive open-ended questions could be the starting step toward a text-analytic study. Next, a follow-up line of inquiry could contrast motive allocations across different forms of political participation, such as for protests (very visible), campaign contributions, and social media commentary (less visible). Finally, expanding these queries in a comparative setting could be promising, by seeking variation in institutional and political context factors. There is previous turnout work that has marked on empirical regularities, such as increased turnout with close elections and stricter compulsory voting laws, increased turnout under proportional systems, and general declining trends in turnout levels (e.g., Abrams et al., 2010; Aldrich, 1993; Edlin et al., 2007). These regularities should concord with any assumed microfoundation for voting, including its psychological dimensions.
Overall, we have not reintroduced a catchall “taste for voting,” but rather carefully identified and offered evidence for key drivers for voting that stem from some of our most fundamental needs. Our study uncovers that turnout behavior responds similarly to those sentiments we might expect when an exchange involves relational goods. By fleshing out the motives for voting within a broader spectrum of activities, we have also gained a better understanding of what distinctively drives voting.
Supplemental Material
Supplementary_Material – Supplemental material for What Motivates People to Vote? The Role of Selfishness, Duty, and Social Motives When Voting
Supplemental material, Supplementary_Material for What Motivates People to Vote? The Role of Selfishness, Duty, and Social Motives When Voting by Valentina A. Bali, Lindon J. Robison and Richard Winder in SAGE Open
Footnotes
Appendix A
Summary Statistics (Mean) for Select Variables Across Samples and in Comparison to National Figures.

| MT (U.S.) Sample | GFK (U.S.) Sample | U.S. Census (2014) | |
|---|---|---|---|
| (N = 990) | (N = 981) | Adult population (18+) | |
| Age | 35.1 | 46.8 | 47.9 |
| Household income (median) | $40K–$50K | $50K–$59K | $53,657 |
| White | 80.1% | 68.1% | 65.5% |
| African American | 6.3% | 11.6% | 12.2% |
| Hispanic | 5.7% | 13.2% | 14.9% |
| Some college+ | 84.9% | 59.2% | 58.1% |
| Female | 51.3% | 51.1% | 51.7% |
| Full-time employed | 45.6% | 49.1% | 51.7% |
| Votes—every general election | 37.8% | 48.8% | |
| Votes—most general election | 26.6% | 18.1% | |
| Votes—some general election | 9.9% | 7.7% | |
| Votes—very few general elections | 10.6% | 6.0% | |
| None—does not vote in general elections | 15.1% | 19.1% | |
| Voted in the last general election (2012) | 69.3% | NA | |
| Turnout rate (VEP) 2012 | 58.0% |
Note. The U.S. census population estimates are based from the 2014 Current Population Survey and 2014 American Community Survey. MT = mechanical turk; GFK = growth from knowledge. See: https://www.census.gov and https://factfinder.census.gov. The voting-eligible population (VEP) turnout rate was obtained from the U.S. Election Project (McDonald, 2020, http://www.electproject.org).
Appendix B
Questionnaire wording for motives on voting: MT and GFK surveys
Please consider the following reasons or motivations that might explain why you would vote in a general election. Describe the relative importance of each reason/motive by allocating percentage weights (from 0 to 100) to each motive.
For example, if 30% of your motivation for voting in a general election is so that your friends and co-workers will think better of you, place the number 30 (without the percent sign) beside that reason/motive.
(If you do not vote in general elections, please answer the question as if you were to vote in general elections.)
Note that the five percentages allocated to the motives must sum to 100.
What are your reasons/motives for voting in a general election?
I vote to increase my income or reduce my expenses: for example, I vote because there is a potential economic benefit, such as reducing taxes or increasing government benefits.
I vote to support people and causes that I care about, so that those people and causes may be more successful.
I vote because I think it is the right thing to do and I feel better about myself when I do.
I vote because it makes me feel like I am participating in something larger than myself: it makes feel like I am part of a community.
I vote so that my friends and co-workers will think better of me.
Only for MT survey: Are there other reasons you vote in a general election? If so, please tell us the reason(s) in the space below.
Appendix C
Logit Models Predicting Being a Frequent Voter Including One Motive at a Time.
| Panel A: MT (U.S.) sample | ||||||||||
|---|---|---|---|---|---|---|---|---|---|---|
| Logit Model | MT sample (U.S.) | |||||||||
| (1) | (2) | (3) | (4) | (5) | ||||||
| Coef. | SE | Coef. | SE | Coef. | SE | Coef. | SE | Coef. | SE | |
| Motive variables | ||||||||||
| Selfishness αs | −.011*** | (0.003) | ||||||||
| Personal duty αd | .012*** | (0.003) | ||||||||
| Altruism αa | −.001 | (0.002) | ||||||||
| Belonging αb | .004 | (0.003) | ||||||||
| Social approval αg | −.040*** | (0.012) | ||||||||
| Constant | −.821*** | (0.232) | −1.217*** | (0.239) | −.921*** | (0.244) | −1.041*** | (0.237) | −.807*** | (0.231) |
| N of Obs | 965 | 965 | 965 | 965 | 965 | |||||
| McFadden’s R2 | .08 | .08 | .07 | .07 | .08 | |||||
| Panel B. GFK (U.S.) sample | ||||||||||
| GFK sample (U.S.) | ||||||||||
| (1) | (2) | (3) | (4) | (5) | ||||||
| Logit Model | Coef. | SE | Coef. | SE | Coef. | SE | Coef. | SE | Coef. | SE |
| Motive variables | ||||||||||
| Selfishness αs | −.015*** | (0.004) | ||||||||
| Personal duty αd | .012*** | (0.004) | ||||||||
| Altruism αa | .002 | (0.003) | ||||||||
| Belonging αb | .008 | (0.004) | ||||||||
| Social approval αg | −.025 | (0.0164) | ||||||||
| −1.199*** | (0.320) | |||||||||
| Constant | −.976** | (0.325) | −1.587*** | (0.331) | −1.384*** | (0.327) | −1.459*** | (0.314) | ||
| N of Obs | 980 | 980 | 980 | 980 | 980 | |||||
| McFadden’s R2 | 0.14 | .13 | .12 | .12 | .13 | |||||
Note. The dependent variable is “1” if respondent votes in every or most elections; “0” otherwise. All models were estimated with socioeconomic controls, as in Table 2. MT = mechanical Turk; GFK = growth from knowledge.
Significance levels are **p < .01. ***p < .001.
Acknowledgements
The authors would like to thank the article editor and three anonymous reviewers for thoughtful comments that greatly improved the article.
Declaration of Conflicting Interests
The author(s) declared no potential conflicts of interest with respect to the research, authorship, and/or publication of this article.
Funding
The author(s) received no financial support for the research, authorship, and/or publication of this article.
Supplemental Material
Supplemental material for this article is available online.
Notes
References
Supplementary Material
Please find the following supplemental material available below.
For Open Access articles published under a Creative Commons License, all supplemental material carries the same license as the article it is associated with.
For non-Open Access articles published, all supplemental material carries a non-exclusive license, and permission requests for re-use of supplemental material or any part of supplemental material shall be sent directly to the copyright owner as specified in the copyright notice associated with the article.