
Abstract
The present article proposes a new labor market index, called the positive labor market mobility index, which focuses on quantifying the amount of “desired” labor market mobility present in the transitions of young individuals, providing a useful way of comparing countries on that matter. Well-established indices in the literature aiming at measuring mobility take into account all movements among states and/or the diagonal elements of the transition probability matrix that denote immobility. On the contrary, the index proposed in this study uses only “favorable” or “desired” movements among labor market states, providing a more relevant to labor mobility assessment index, where the interest lies in quantifying positive transitions, from education or training to employment, for example. The positive mobility index is estimated for individuals in Europe, whose age was 15 to 29 during the years of the financial crisis, from 2008 to 2015. Annually raw micro-data from the European Union Labour Force Survey (EU-LFS) for these 8 years are used for this purpose. Moreover, the values of the proposed labor market mobility index are correlated with an early job insecurity indicator, estimated for the same age group. The results reveal the significant differences among European countries, when “desired” transitions of young individuals are taken into account. Moreover, the analysis performed indicates that the proposed index could be a good predictor for the degree of early job insecurity for young individuals in EU member states.
Keywords
Introduction
Markov systems are systematically used in the literature to simulate the movements among labor market states and the way they develop with respect to time (Alvarez et al., 2008; Bosch & Maloney, 2007; Flek & Mysikova, 2015; Karamessini, Symeonaki, & Stamatopoulou, 2016; Karamessini, Symeonaki, Stamatopoulou, & Papazachariou, 2016; Symeonaki et al., 2019a, 2019b; Symeonaki & Stamatopoulou, 2015; Ward-Warmedinge et al., 2013). The reason behind this extensive use is that Markov systems provide one of the most efficient and powerful ways of capturing the movements of a population system that consists of individuals stratified into predefined states in relation to a distinct attribute (Bartholomew, 1982; Symeonaki et al., 2000, 2002, 2019a, 2019b; Vassiliou, 1982; Vassiliou & Symeonaki, 1998, 1999).
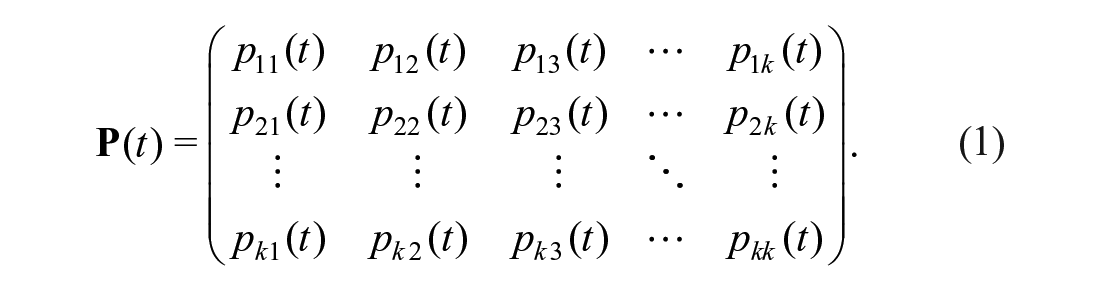
In the study of population dynamics, a Markov system is defined as a set of individuals, classified in distinct categories in relation to a predefined feature, that move between states following the sequence of transition probability matrices
A distinction between “good” moves and “bad” moves was first proposed in Caliendo (2009); movements from unemployment and inactivity to employment were characterized as “good,” whereas movements from employment to unemployment and inactivity were characterized as “bad.” He even argued that it would also be interesting to consider some job-to-job transitions as “bad” and concluded that an increase in “good” transitions was broadly accompanied by reductions in “bad” transitions. Negative and positive partial mobility was introduced in Sengupta and Ghosh (2010), where the case of relatively moving upward or downward was considered. This required the introduction of partial mobility, where mobility was estimated with respect to the positioning of a specific sub-group. It was also argued that the only movements that could be considered as an improvement in the positioning are those from a lower state to a higher state, as the system under study was hierarchical. Moreover, as a general rule, school-to-work transitions are considered as successful (Pavlova et al., 2017; Ryan, 2001, among others) and therefore can be perceived as “positive” movements. A first attempt toward the definition of positive labor fluidity was made in Symeonaki, Stamatopoulou, and Karamessini (2017), where the need for establishing a more meaningful labor market mobility index was presented.
Traditionally, the mobility of a population system at time
At this point, it is worth to mention that Matsumoto and Elder (2010) provide a stricter definition of the transition from education to the labor market when analyzing the results from International Labour Organization’s (ILO) School-to-Work Transition Survey (SWTS). They regard an individual as having completed his or her movement from education to the labor market, if and only if the individual is in fixed-term and satisfactory employment. Thus, a transition to employment is positive, only if the employment is stable and satisfactory. Unfortunately, when one analyses data from the European Union Labour Force Survey (EU-LFS) survey, this distinction between temporary and permanent employment, or part-time and full-time jobs cannot be made due to data limitations. In the EU-LFS, when transitions between labor market states are measured, the state of “employment” corresponds by definition to an individual that “carries out a job or profession, including unpaid work for a family business or holding paid traineeship, including an apprenticeship” (Eurostat, 2019, p. 26), and no distinction is made between type of contracts or hours worked.
Our focus is on youth transitions in Europe (aged from 15 to 29), capturing their evolution over a period of 8 years (2008–2015), a period characterized by the outburst of the financial crisis and its aftermath. However, the proposed index could be estimated for any age span or the general population, without any amendments. Our interest is on this age span, for which school-to-work transitions are particularly important. The successful settlement of young individuals into the labor market is still under discussion in Europe, as younger individuals were the most affected by economic and financial crisis. Thus, the new index will contribute to the discussion on the labor market mobility, by bringing to light the different patterns of young individuals’ flows across the EU and revealing the consequences of the economic crisis. In this context, the indicator aims at supporting social policy makers into effective youth employment policies.
We are also interested in examining whether the proposed positive labor market mobility indicator could be used as a predictor of early job insecurity and more specifically as to whether greater values of the positive labor market mobility index imply less early job insecurity. Early job insecurity refers to job uncertainty for individuals who have not yet moved successfully to the labor market. It is perceived in the present study as an objective phenomenon linked to the thread of unemployment and all significant determinants that potentially could hold individuals back from finding and maintaining their position. More specifically, the early job insecurity indicator introduced in Symeonaki, Karamessini, and Stamatopoulou (2017); Karamessini et al. (2019); and Symeonaki et al. (2018) will be used in the correlation/regression analysis performed.
The article is organized as follows: The “Review of Existing Mobility Indices” section presents the well-established mobility indices used in the literature and their shortcomings in the case where the Markov system is a labor market system. The “Defining the Positive Labor Market Mobility Index” section provides the reader with the information concerning the definition of the proposed positive labor market mobility index,
Review of Existing Mobility Indices
Let a Markov population system where individuals are stratified into

The probability of remaining at the same state

The transition probability matrix of the population system is denoted by
In the literature, one can identify limited efforts to develop mobility indices based on transition matrices (Bartholomew, 1982; Bibby, 1975; Prais, 1955; Shorrocks, 1978). Two types of well-know mobility indices of this kind are presented in the present section which could potentially be used to quantify the transitions among labor market states. These are as follows:
Relative indices such as the Prais–Shorrocks index (Prais, 1955; Shorrocks, 1978), which correspond to the amount of labor fluidity, and
Absolute mobility indices that take into consideration the direction of the transitions, such as upward and downward mobility.
Relative mobility rates take into consideration the transition probabilities of the individuals between states, while absolute mobility indices by definition measure the actual number of members who change their position, reflecting also the direction of the transitions.
One of the first relative mobility indices introduced was the Prais–Bibby mobility index (Bibby, 1975; Prais, 1955) given in Equation 2:

where
In Shorrocks (1978), a similar measure to the Prais–Bibby mobility index was introduced, known now as the Prais–Shorrocks index, and its axiomatic properties were provided. The index is described by Equation 3:

If
It is clear that both
The Bartholomew index

A measure to quantify immobility is the immobility ratio which is based on the concept of the Prais–Bibby mobility index:

This ratio provides the member’s rate of staying in the same position at time
Finally, Equations 6 and 7, respectively, define the absolute mobility indices of upward and downward mobility that are estimated with the aid of the actual number of individuals moving upward or downward:


where
It is clear that the Prais–Shorrocks index, the immobility ratio, and the Prais–Bibby index consider only the diagonal elements of the respective matrices and the Bartholomew mobility index bases its values on the mobility that is observed off the main diagonal of the transition probability matrices, weighting transitions by the “distance” between states. The latter is not purposeful if the system is not hierarchical, that is, if an ordering in states does not exist. The upward and downward mobility indices also assume a hierarchical ordering of the states which is not true in the case of a labor market system. They would be appropriate, for example, in the study of educational intergenerational social mobility (Symeonaki et al., 2016; Symeonaki & Filopoulou, 2017)), where the states correspond to low, medium, and high educational attainment. It is also true that these indices are all highly correlated in empirical applications (Nichols, 2008; Nichols & Rehm, 2014).
Moreover, the existing indicators originate from Markov population systems whose members in general are stratified into exhaustive and exclusive states that are not necessarily comparable (occupational categories, for example) or from hierarchical population systems where movements toward one direction are always positive, for example, educational attainment or income categories.
An example is now provided to highlight some limitations of the existing mobility indices. Let a labor market system, modeled as a Markov system where individuals are stratified into the following categories: employment, education/training, unemployment, and inactivity according to their labor market state. Let also two different transition matrices,

and

For the matrices
Both matrices yield the same values for the mobility indices
Defining the Positive Labor Market Mobility Index
The purpose of the index proposed in this section is to shed light to the amount of mobility, considering simultaneously the type of movements of the individuals and provide a meaningful index linked to positive mobility that can be used for comparison among different countries. In essence, we focus on an index of positive mobility that implies greater job opportunities in the system and as a consequence, less job insecurity.
Now, let a Markov population system where individuals are stratified into four exhaustive and exclusive states:
Employment,
Education or training,
Unemployment, and
Inactivity.
The transition probability matrix at time
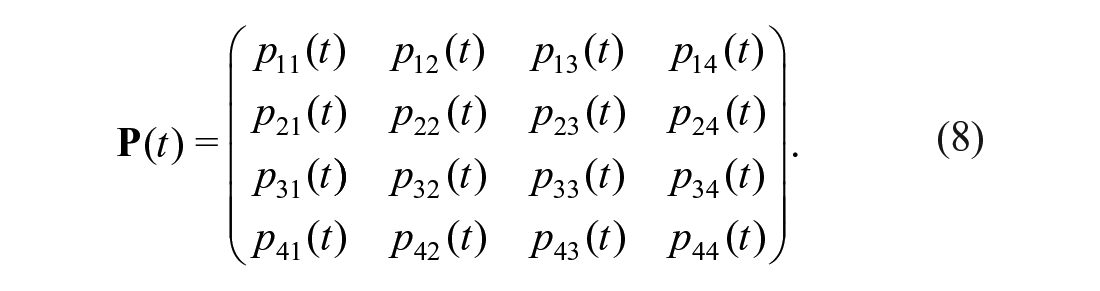
Moreover, the transition diagram that depicts the transition probabilities of the system is presented in Figure 1. The definitions of the positive labor market mobility index and negative labor market mobility index are now provided.
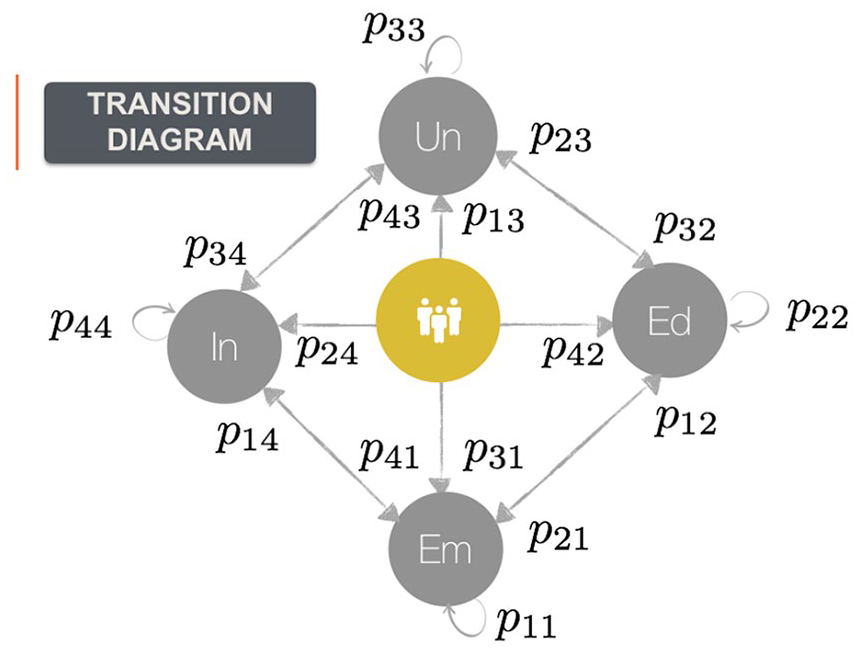
A diagram depicting movements among labor market states.
Employment, Education or training, Unemployment, and Inactivity.
Then, positive labor market mobility index is defined by

Negative labor market mobility index, denoted by

It is true also that

The transition probabilities located at the first two columns are considered in the mobility index, as they are the ones that correspond to positive movements (in the sense that they are not negative and do not lead to exclusion from the labor market). In other words, flows into employment and education or training are considered positive, while flows into unemployment and inactivity are perceived as negative. This is an attempt to quantify what is referred to in Caliendo (2009) as “good” and “bad” moves. In accordance to Shorrocks (1978), we now provide the following definitions:
Employment, Education or training, Unemployment, and Inactivity.
The family of matrices where
Employment, Education or training, Unemployment, and Inactivity.
The families of matrices where
Examples of perfectly positive mobile and strong perfectly positive mobile are provided in Equations 11 and 12, respectively:

and

It is clear that in a labor market system governed by a strong perfectly positive mobile transition matrix, employment is an absorbing state that, once entered, cannot be abandoned, while in a perfectly positive labor market system, individuals can either move to employment or education/training irrespective of the state of origin.
Data and Limitations
The methodology presented in the “Defining the Positive Labor Market Mobility Index” section is now applied to the EU-LFS data with the aim of measuring the positive labor market mobility for young individuals aged 15 to 29, for the years 2008–2015. To estimate the proposed index, cross-national raw data for those years are used that relate to all EU countries and the EFTA (European Free Trade Association) countries Norway and Switzerland. In is known that the EU-LFS purpose is to produce comprehensive knowledge on the labor market outcomes and relating issues that will allow for advanced statistical analysis and ensure comparability between countries by using common questionnaires.
In the EU-LFS, individuals are asked to fill in their “current labour market status at the time of the survey” (respective variable is MAINSTAT) and their “labour market status one year before survey” (respective variable is WSTAT1Y). MAINSTAT and WSTAT1Y are estimated to measure the elements of the transition probability matrices. MAINSTAT was brought into the EU-LFS questionnaire as an effort to measure the respondent’s own belief for his or her main labor market state. It is therefore a subjective measurement of the labor market outcome of the respondent which is different from the objective measurement of the labor market state estimated through the variable ILOSTAT. The purpose of this variable is different from the international definitions of employment status (ILOSTAT). MAINSTAT’s role is very important because it makes it possible, for example, to identify students working part-time, who would look at themselves as economically inactive and not as persons in employment. Moreover, due to conceptual differences, the labor market state a year before the survey should be linked with the subjective labor market status (MAINSTAT) and not with the objective one (ILOSTAT). The limitation here is that MAINSTAT and WSTAT1Y are not always included in the survey, as they are not part of the core EU-LFS questionnaire. It is a decision that each country’s National Statistical Authorities should make and the consequence of this limitation is that for some member states, the values of these variables are missing. For this reason, results are not included for Germany, the United Kingdom, and Ireland.
Another limitation lies in the fact that such indices that use the individual’s position at two times could only capture a maximum of one alteration in the position (e.g., from education or training to unemployment). Thus, bias may be arising from “round-tripping,” that is, the unreported short-term movements between different labor market states that take place within the year. For more details about the effects of “round tripping” on the labor market dynamics, see, for example, Kiefer (1988) and Gora and Lehmann (1995).
Finally, it should be also kept in mind that the retrospective and self-reported data on the labor market history of respondents may lead to a recall bias on their mobility, as it is not certain that the individuals may remember the specific point that their labor market status has changed. For a systematic analysis of the recall effect on measured labor market dynamics, see, for example, Paull (2002). With micro-data from the British Household Panel Survey (BHPS), he concluded among others that the individuals with the most transient behavior are more likely to give inconsistent information.
In the EU-LFS survey (Eurostat, 2019, p. 26), the categories among which the respondent can choose the respective questions are the following:
Carries out a job or profession, including unpaid work for a family business or holding, including an apprenticeship or paid traineeship, and so on;
Unemployed;
Pupil, student, further training, unpaid work experience;
In retirement or early retirement or has given up business;
Permanently disabled;
In compulsory military service;
Fulfilling domestic tasks; and
Other inactive person.
We cluster these categories to produce the labor market states:
Employment (1)
Education or training (3),
Unemployment (2), and
Inactivity (4–8).
Results and Discussion
Based our analysis on Walther’s (2006) and Pohl and Walther’s (2007) typology of “youth transition regimes,” we distinguish four clusters across European countries. Due to limited data for both the United Kingdom and Ireland (MAINSTAT and WSTAT1Y are not included in their questionnaire), results for the liberal regime are not presented in the analysis of this section. In particular, the universalistic regime in Nordic countries (Denmark, Finland, Sweden) is characterized by advanced welfare systems, inclusive education, and centrally standardized and flexible training system. The post-compulsory routes into typical and vocational education lead to high entrance to tertiary education. The employment rates are high both for men and women, while the transitions of entering the labor market are smooth and stable (Lorentzen et al., 2019).
On the contrary, continental countries in the employment-centered regime are defined by selective and standardized education and training. The transitions of the young people into employment are considered smooth and successful, especially in countries with developed apprenticeship systems such as Germany and Austria, where the employment rates of graduates are among the highest in Europe (Eurofound, 2014; Hadjivassiliou et al., 2016; Scherer, 2001).
A southern European/sub-protective transition regime is also defined, with rudimentary welfare structures and strong family networks. The standardized education systems are not selective, while the vocational training is considered weak in general. The countries in this regime are also characterized by rigid labor markets, high rates of youth unemployment, and precarious employment. Going from school to a stable employment is considered to be very slow, especially in the case of Italy, where more than 40% of young people delay substantially their graduation from tertiary education (Pastore, 2017). Finally, there is much turnover between employment, unemployment, and inactivity, while the temporary contracts reach high levels and trap young people into insecure careers, especially in the case of Spain (Iannelli & Soro-Bonmat, 2001; Rodriguez-Modroo, 2019).
Finally, the post-socialist countries of Central and Eastern Europe defined by Fenger (2007) as “developing” regarding their welfare state are characterized by comprehensive school systems, with high rates of post-compulsory general education and weak linkages between education system and labor market (Hadjivassiliou et al., 2016). The quality and the speed of the transitions within the labor market are different between the countries. In particular, the school-to-work transition appears quite short in Baltic countries (Estonia, Latvia, Lithuania) and a very high rate of young people hold permanent, full-time contracts, while the picture is the opposite, concerning the Eastern European countries (Eurofound, 2014).
The estimates of the positive labor market mobility index for the years 2008–2015 are now provided. The respective results refer to EU countries, Norway, and Switzerland for the years for which the necessary variables (MAINSTAT and WSTAT1Y) have been included in the countries’ national questionnaires. Table 1 exhibits the values of the proposed index for the European countries under study, per year.
Positive Labor Market Mobility Index,

Note. EU-LFS: European Union Labour Force Survey.
It is clear that in 2008, the positive labor market mobility index varied between 0.565 (Italy) and 0.738 (Sweden), while in 2015, the index took values between 0.530 (Romania) and 0.761 (Luxembourg), implying that the finincial crisis has broadened the differences between countries. It is also worth observing that the values of the positive mobility index decreased for all countries in 2009. We note here that the values of

which proves the significant effects of the crisis’s breakout on education, training, and employability of young Europeans. Apparently, in 2009, the values of
Figures A1 to A8 in the appendix depict the values of the positive labor market mobility index per year, where one can observe the ranking of the countries for each year separately. Sweden, Switzerland, Finland, and Luxembourg exhibit the greatest values of positive labor market mobility over those years, while Croatia, Greece, Spain, and Romania the lowest.
An illustrative picture of the evolution of the proposed index over the years is provided in Figure 2.

Positive labor mobility index by different transition regimes, EU-LFS, 2008–2015.
Each line corresponds to a specific country and different subplots are presented according to the different transition regimes that are mentioned above. It appears that Denmark, Finland, and Sweden are exhibiting higher levels of “positive” mobility of their young citizens, compared with the other regimes, with the index values oscillating between 0.7 and 0.8. The mobility patterns seem to be relatively stable in time, as the values of
On the contrary, the positive mobility index takes values between 0.6 and 0.7, across countries belonging to the employment-centered regime, with Luxembourg and Switzerland indicating more positive movements within their labor markets. Actually, the values of
Concerning now the southern European countries, the positive labor market mobility index takes low values in general, especially in Greece and Italy throughout the years. The extreme austerity measures forced as a consequence of the economic crisis worsened the situation even more in Southern Europe, as the index seems to be affected negatively. In Spain, for example, the index was equal to 0.627 in 2008 and 0.506 in 2015, while in Cyprus, the index dropped from 0.697 in the beginning of the crisis to 0.598 in 2015.
Finally, national differences are notable also in the last subplot. In some post-socialist countries, the proposed index is also influenced over the years (e.g., in Romania
The values of the proposed index are now correlated with the values of the multidimensional early job insecurity indicator proposed in Symeonaki, Karamessini, and Stamatopoulou (2017); Symeonaki et al. (2018); and Karamessini et al. (2019) that provides evidence of the amount of early job insecurity in European states for the same age group, 15 to 29. This specific early job insecurity indicator considers a set of specific measures that capture various elements of early job insecurity with the aid of EU-LFS for EU member states and the EFTA countries Norway and Switzerland. These measures are aggregated into a composite indicator of early job insecurity to understand and juxtapose the amount of early job insecurity among countries. This holistic early job insecurity indicator accounts for the whole range of the phenomenon under study, focusing on indicators linked to the labor market outcomes domain, the job quality domain, the school-to-work transitions domain, and the job security domain.
Figure 3 presents the scatterplots of
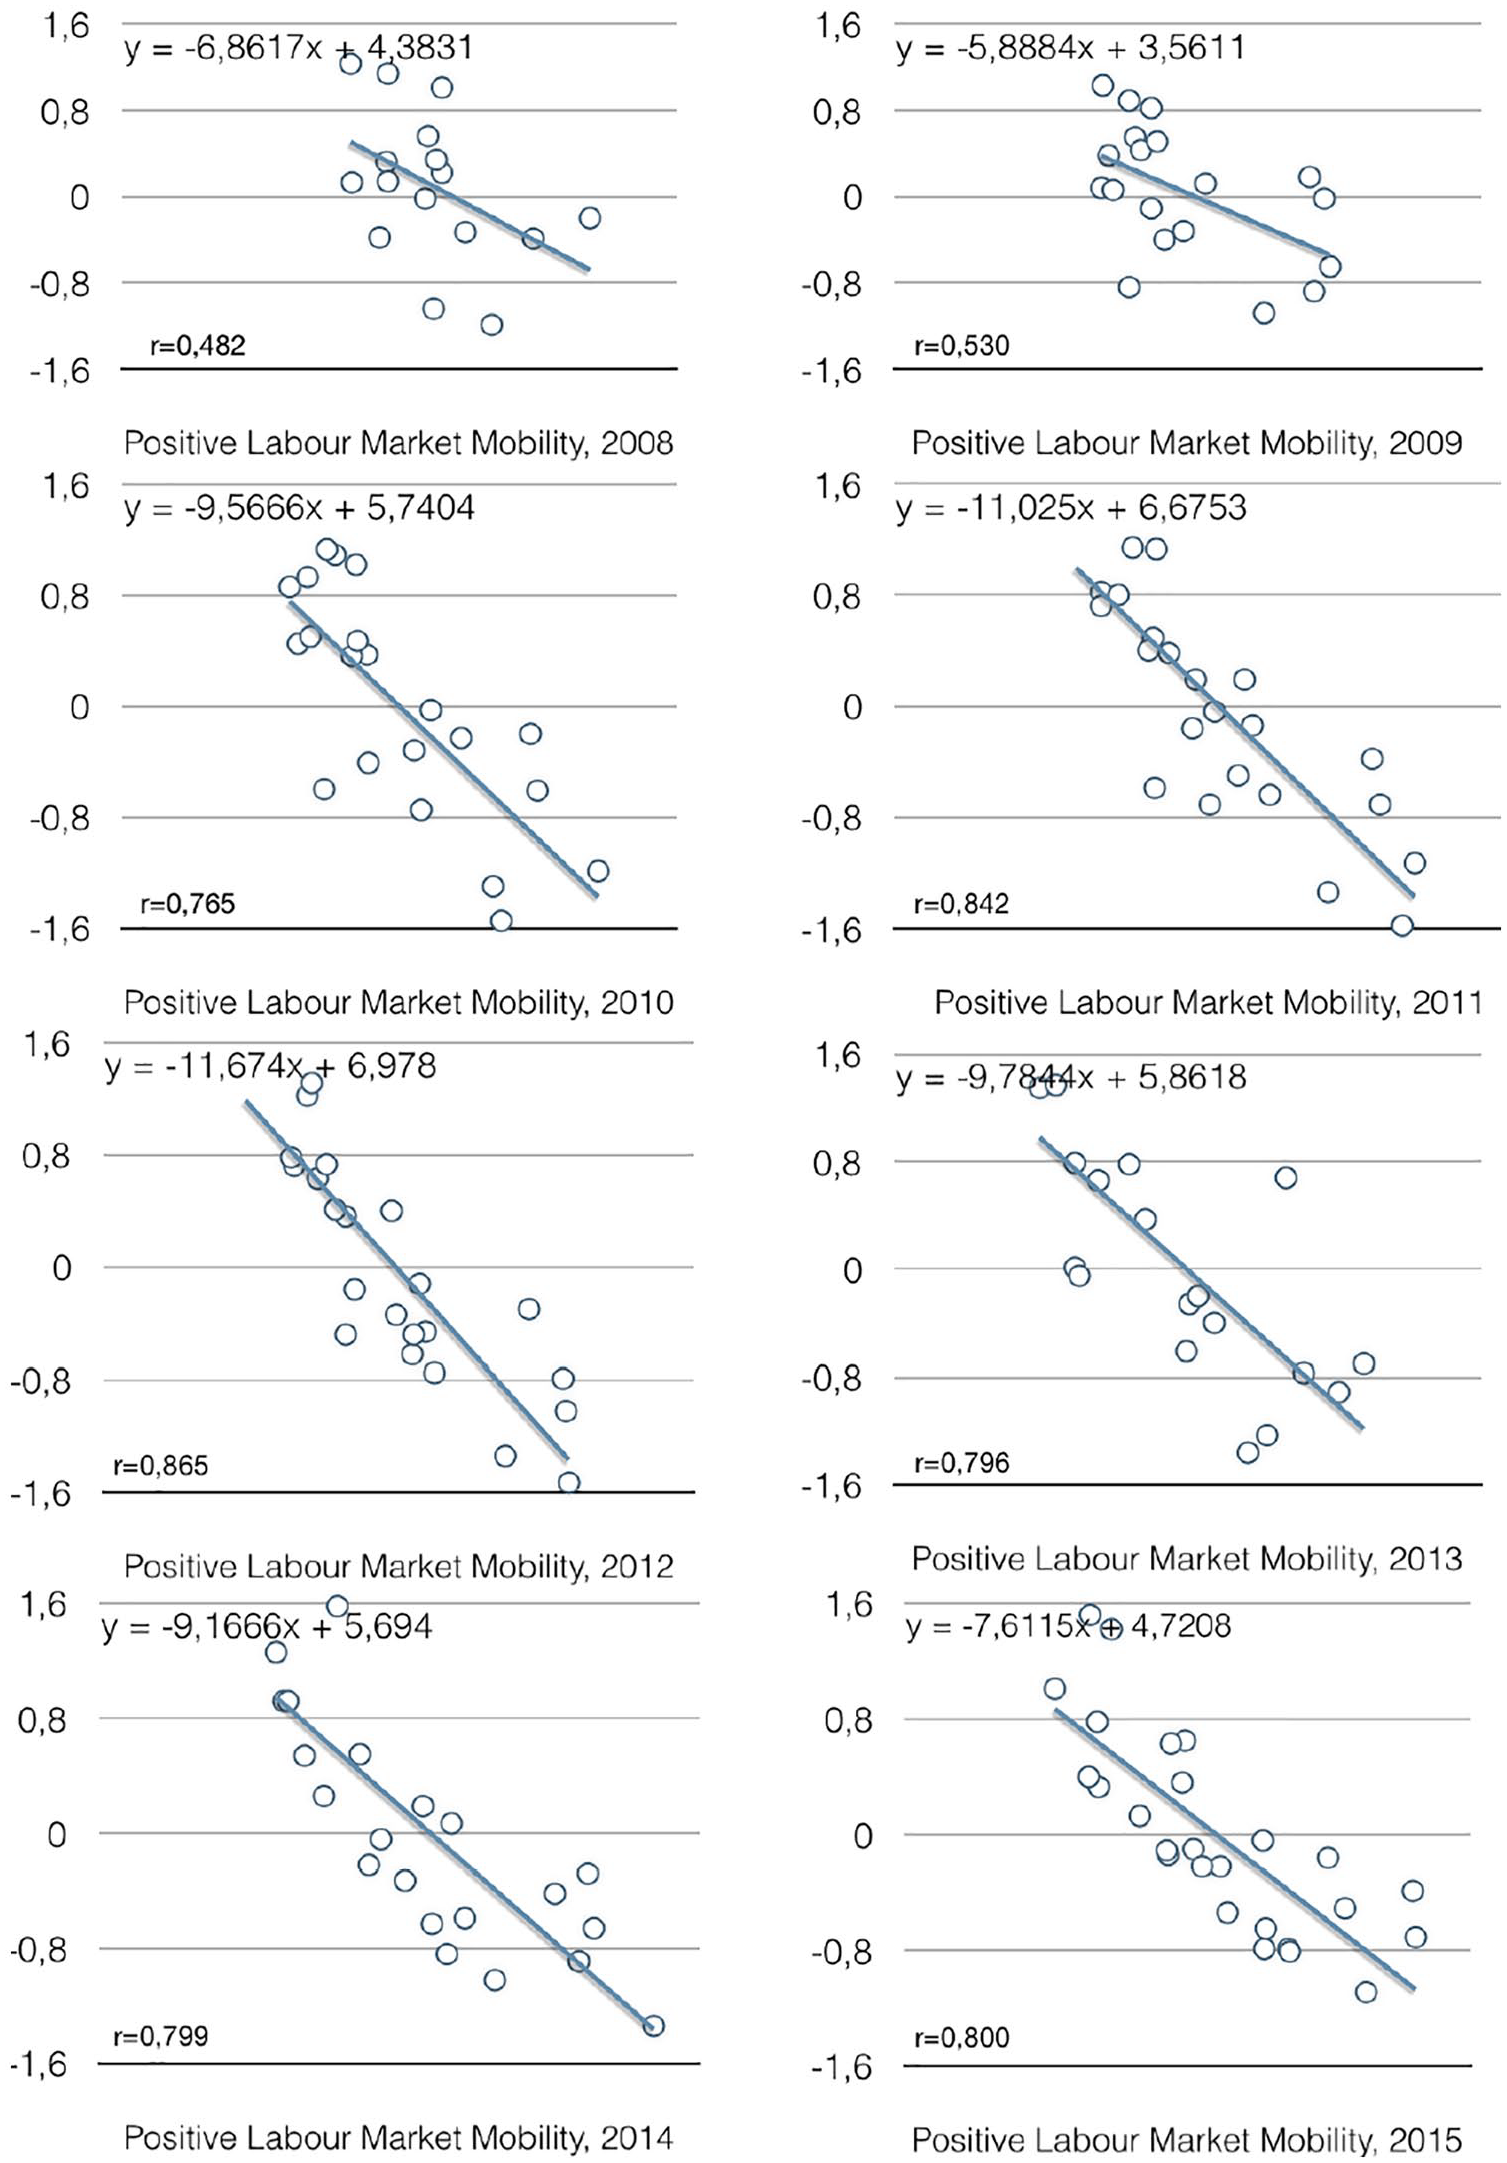
Scatterplots of positive labor mobility index and early job insecurity, 2008–2015.
Conclusions and Future Steps
In this study, we have introduced a new index of positive labor market mobility that reveals information concerning the amount of “desired” mobility present in the labor market system. The proposed index is estimated for individuals whose age varied from 15 to 29 during the years 2008–2015 in Europe with the aid of micro-data derived from the EU-LFS for the respective years. Positive labor market mobility is measured using the transition probabilities between labor market states for EU member states, for which the required data were available. Countries are ranked according to these measurements with Luxembourg, Sweden, Finland, and Switzerland having the highest degrees of positive labor market mobility for those years and Greece, Croatia, Romania, and Spain the lowest.
It is crucial to note here that the values of positive labor market mobility decreased for all studied countries at the outbreak of the economic crisis in 2009. After 2010, some countries, mainly characterized by advanced welfare regimes, managed to move past those consequences, while in others, the values of the index kept decreasing.
Moreover, positive labor market mobility is proved to be highly correlated with early job insecurity especially after 2010. Thus, there is no ambiguity in how the crisis has formulated positive labor market mobility and by extension early job insecurity in European countries and that maybe allows for some nuance in the way policies should be implemented. Stressing the discrepancies among European countries can lead to a wiser design of Youth Guarantee programs, adjusted to the national and social specificities of each country. Moreover, it can give feedback for a more balanced division of funding or focused and beneficial actions, via the Youth Employment Initiative. As a consequence, the European Employment Strategy, the National Reform Programs, and the Stability/Convergence Programs could be briefed in the direction of more inclusive and fair approaches.
An aspect of future work of this research could include a consideration of varying weighting schemas for the elements of the transition probability matrix included, bearing in mind that even positive movements are not equally important. Going from unemployment back to education or going from unemployment to employment is somehow of different quality. This could be achieved either by
Examining, validating, and evaluating different weighting schemas through correlation analysis, or by
Developing a machine learning system for measuring the weights using theory, heuristic experts’ knowledge, and empirical rules.
Footnotes
Appendix
Declaration of Conflicting Interests
The author(s) declared no potential conflicts of interest with respect to the research, authorship, and/or publication of this article.
Funding
The author(s) disclosed receipt of the following financial support for the research, authorship, and/or publication of this article: This article is based on research funded by the European Union’s Horizon 2020 research and innovation program under Grant Agreement No. 649395 (NEGOTIATE—Negotiating early job-insecurity and labor market exclusion in Europe, Horizon 2020, Societal Challenge 6, H2020-YOUNG-SOCIETY-2014, Research and Innovation Action [RIA], Duration: March 1, 2015—February 28, 2018).