
Abstract
This applied study profiled four self-directed behavioral health support tools from Learn to Live, Inc., when offered as an employee benefit. Each of these automated online programs featured eight structured lessons that emphasized cognitive-behavioral therapy techniques. Archival operational information collected across multiple employers in the United States was analyzed for 1,297 unique participants with longitudinal program use data. Significant reductions were found on validated measures of clinical symptoms specific to each program: Depression (d = 0.93, n = 268; Patient Health Questionnaire–nine-item scale [PHQ-9]), Insomnia (d = 0.69, n = 295; Medical Outcomes Study [MOS] Sleep), Social Anxiety (d = 0.53, n = 170; Social Phobia Inventory [SPIN]), and Stress, Anxiety, & Worry (d = 0.50, n = 633; Generalized Anxiety Disorders–seven-item scale [GAD-7]). Moderators of improvement included greater initial clinical severity and greater engagement in the programs (more lessons used and use of optional live support from a coach or friend/family). Follow-up survey results (n = 290) revealed high satisfaction and improved work absenteeism and job performance. Financial return to the employer from improved work productivity was estimated at US$2,431 per employee user.
The need for mental health support for working adults is well documented in the literature (Attridge, 2019). Epidemiological data on prevalence rates in the United States indicate that about one in every five (20%) working adults have diagnosable mental health disorders and/or substance abuse problems (Karg et al., 2014). Some of the most common of these disorders are depression and related mood disorders (7.4% prevalence; Karg et al., 2014), social anxiety disorder (7.1% prevalence; Kessler et al., 2009), and generalized anxiety disorder (5.7% prevalence; Karg et al., 2014). Although not a mental health disorder, acute symptoms of a lack of sleep affect close to 30% of adults in the United States, and 10% of adults in the United States have chronic insomnia problems (Bhaskar et al., 2016; Olfson et al., 2018). For each of these disorders, women have a higher prevalence rate than men.
There is a growing literature on technology-based tools for individuals interested in seeking support for a range of behavioral health issues. According to recent reviews of the literature, more than 200 studies have been conducted exploring the use of technology-based tools for individuals interested in seeking support for a range of behavioral health, stress, and related concerns (Andersson, 2018; Davies et al., 2014; Lattie et al., 2019).
These resources feature self-directed digital tools that are available anytime on the internet. Such tools are fully automated and do not involve live interaction with a behavioral health professional. Advantages of these tools include being able to provide users with greater access to therapeutic support—often at similar levels of clinical effectiveness when used properly—and at a much lower cost to deliver than traditional services involving behavioral health providers (Arnberg et al., 2014; Drake, 2016; Firth et al., 2017; Griffiths & Christensen, 2007; McKay et al., 2016; Wickwire, 2019). According to Schneider et al. (2014), “As first-aid for mild to moderate mental health problems, evidence-based computerized approaches have broad acceptability” (p. 90). Many of these computerized tools are based on principles and clinical techniques of cognitive-behavioral therapy (CBT).
Depression has been successfully addressed in several internet-delivered CBT (called iCBT) programs (Clarke et al., 2005; Cuijpers et al., 2010; Melling & Houguet-Pincham, 2011). Recent studies have also documented the clinical effectiveness of iCBT programs for people with anxiety problems (Dryman et al., 2017; Jakobsen et al., 2017; Nordgren et al., 2014). Social anxiety has also started to receive attention with iCBT interventions (Kampmann et al., 2016; Klein et al., 2011). And finally, sleep problems and insomnia have also been successfully addressed with iCBT programs (Espie et al., 2012, 2019; Hagatun et al., 2019; Lancee et al., 2012; Ritterband et al., 2017; Seyffert et al., 2016; Vedaa et al., 2019).
Most of these studies have emphasized establishing the clinical effectiveness of the programs with experimental study designs using small samples of participants, testing one particular iCBT program or online resource for one kind of clinical issue (e.g., a study of iCBT for clinically depressed cases). In contrast, the present study used an alternative approach by examining the external validity of these kinds of programs in real-world settings from a commercially available suite of four iCBT programs. It included users who ranged in severity from subclinical to clinical status. It also measured outcomes in both clinical and work performance areas, using the results for the later to estimate cost savings from avoided further lost work productivity.
This applied archival study was conducted with operational data from voluntary registered users of Learn to Live, Inc., which provides a suite of iCBT-based self-directed programs for the behavioral health issues of anxiety, depression, social anxiety, and insomnia. The program was hosted on a single dedicated website (www.learntolive.com) and accessed from any internet-capable device. There was no direct cost to the participants in this study, as access to the programs was sponsored by employers, who made the service available as a benefit to all employees and their covered family members.
Participants entered a code at the host website and began by taking a 5-min online “Comprehensive Assessment” (CA) covering five topic domains: anxiety, stress, depression, social anxiety, and insomnia. Standardized validated clinical assessment tools were used for each topic. After reviewing the assessment results and, in most uses, an algorithm-driven program recommendation, participants had the opportunity to enroll in one of four CBT-based programs. Participants also had the option to engage in more than one progam.
Each program consisted of eight lessons containing brief assessments, videos, animations, and online application of CBT tools. The number of lessons actually used within each program was optional and was determined by the participants over the course of their natural experience with these iCBT tools. Practice of tools was recommended between lessons. Users also had the choice to use coaching from the service and choose a preferred channel—email, text, or telephone—to communicate with the coach. The coaches were employed by the service provider, and every coach had at least a master’s-level education in psychology or counseling. Users could also select someone from their existing social network to communicate with during program use as a “teammate.” There was no direct cost to the participants in this study, as access to the programs was sponsored by employers, who made the service available as a benefit to all employees and their covered family members.
Research Questions
Method
Data Collection and Determination of Study Sample
The data for the study were from normal business activity that occurred during a 33-month period from August 2016 through April 2019 from the employer market segment of customers of the Learn to Live service. Whereas the other three program topics were offered from the start of the study period, the Insomnia program was added to the service suite more recently in November 2017.
To get to the final sample of users for the study, some exclusion criteria were established. As the focus was on longitudinal data, users of the service who had completed the preliminary CA but then chose not to use a program were excluded. Those who stopped after the first lesson were also excluded, because no post-lesson data are collected until the second lesson. Other exclusion criteria included the removal of a very small number of users (<1%) who completed all eight lessons of the program in a single day. This “speed” approach to program use could not realistically be expected to produce optimal benefit from these tools and was very different than the typical program user. The final exclusion criterion was to limit the duration of program use to a period of 6 months or less (<183 days between the dates of the first and last lessons used).
When applied to the starting pool of potential study participants who had used two (or more) lessons, these study design criteria resulted in removing 13% of users for the Stress, Anxiety, & Worry program; 11% for the Depression program; 8% for the Social Anxiety program; and 5% for the Insomnia program. The final study sample represented a total of 1,366 participants across the four programs. However, as 69 of these participants had used more than one of the programs, the sample represented 1,297 unique individuals. Most participants (95%) enrolled in only one program, with the remaining 5% using multiple programs. More specifically, 54 participants used two programs (4%), six participants used three programs (<1%), and none used all four programs (0%).
Profile of Study Sample
The demographic characteristics of the sample are listed in Table 1. Each program had a similar profile of the attributes analyzed. Similar to prevalence rates for these behavioral health disorders, the majority of program users described themselves as women (70%–78% depending on the program). The average age of the users ranged from 38 to 43 years old, depending on the program (with roughly similar percentages in each of the four age categories). Most of the participants had access to the program from very large size employers (estimated average count of 26,358 total employees). But a wide range of employers was represented, as small employers (<1,000 employees) accounted for 13% of users, medium size employers (1,000–4,999 employees) had 4% of users, large employers (5,000–9,999 employees) represented 21% of users, very large employers (10,000–50,000 employees) had 40% of users, and jumbo employers (more than 50,000 employees) accounted for 22% of all users. The race of participants was not collected as part of the program registration. However, a question on race was asked on the follow-up survey (n = 290). The results showed the following: 88% Caucasian, 3% Native American, 2% Asian American, 2% Hispanic or Latino American, 1% African American, and 2% with “Other/No answer.” Finally, the geographic location of users was not asked specifically of users, but the employers involved who offered the service are all located in Midwest region of the United States.
Profile of Program User Demographics: By iCBT Program.

Note. iCBT = internet-delivered cognitive-behavioral therapy; M = mean.
Clinical Symptom Measures
Each of these measures is a published, reliable, and validated scale from the scientific literature. These measures were aggregated in the CA and used in each lesson of the programs.
Anxiety
The Generalized Anxiety Disorders–seven-item scale (GAD-7) was used to assess self-reported symptoms of anxiety (Spitzer et al., 2006). This is one of the most widely used screening and outcome tools available for anxiety. The GAD-7 has been shown in past research to have adequate levels of reliability and validity (Kroenke et al., 2007; Löwe et al., 2008). Sample items include the following: (a) Feeling nervous, anxious, or on edge; and (b) Not being able to stop or control worrying. Instructions refer to how much the statement applied to the person over the past 2 weeks. Scores were categorized into levels of severity: low = 0 to 4, mild = 5 to 9, moderate = 10 to 14, and severe = 15 to 21. The mix of these severity levels in the study sample of 633 participants was as follows: low 25%, mild 34%, moderate 20%, and severe 21%. Clinical status for anxiety was defined as moderate or higher severity (scores of 10+).
Depression
Depression symptoms were assessed with the Patient Health Questionnaire–nine-item scale (PHQ-9). This scale has been used in hundreds of research studies and has well-established validity and reliability (Kroenke & Spitzer, 2002; Martin et al., 2006). The instructions state, “Over the last 2 weeks, how often have you been bothered by any of the following problems?” Sample items include the following: (a) Little interest or pleasure in doing things; (b) Feeling down, depressed, or hopeless. Scores were categorized into five levels of severity: minimal = 0 to 4, mild = 5 to 9, moderate = 10 to 14, moderately severe = 15 to 19, and severe 20 to 27. The mix of these levels of severity in the study sample of 268 participants was as follows: minimal 3%, mild 18%, moderate 33%, moderately severe 31%, and severe 15%. Clinical status for depression was defined as moderate or higher severity (scores of 10+).
Social anxiety
The Social Phobia Inventory (SPIN) was used to assess self-reported symptoms of social anxiety (Connor et al., 2000). The SPIN has been shown in past research to have adequate levels of reliability and validity (Antony et al., 2006). The instructions state, “Select the answer that best describes how much the following problems have bothered you during the past week.” Scores were categorized into five levels of severity: minimal = 0 to 18, mild = 19 to 30, moderate = 31 to 40, severe = 41 to 50, and very severe 51 to 68. The severity for social anxiety in 170 participants was as follows: minimal 19%, mild 15%, moderate 31%, severe 25%, and very severe 9%. Clinical status for social anxiety was defined as moderate or higher severity (scores of 31+).
Insomnia
To assess self-reported symptoms of sleep disturbance and insomnia, the Sleep Scale from the Medical Outcomes Study (MOS)—Rand Corporation (Hays & Stewart, 1992) was slightly modified for use by Learn to Live. The MOS Sleep scale has been shown in past research to have adequate levels of reliability and validity (A. L. Stewart et al., 1988). The six-item short version used Item Numbers 4, 5, 7, 8, 9, and 12 from the original full 12-item scale. The instructions for the measure state, “How often during the past week did you . . .” The items include the following: (4) “get enough sleep to feel rested upon waking in the morning?”; (5) “awaken short of breath or with a headache?”; (7) “have trouble falling asleep?”; (8) “awaken during your sleep time and have trouble falling asleep again?”; (9) “have trouble staying awake during the day?”; (12) “get the amount of sleep you needed?” Scores were categorized into four levels of severity: minimal = 0 to 29, mild = 30 to 43, moderate = 44 to 60, and severe = 61 to 100. The severity of insomnia in the 295 participants was as follows: minimal 28%, mild 28%, moderate 21%, and severe 22%. Clinical status for insomnia was defined as moderate or higher severity (scores of 44+). In the preliminary CA, the instructions for this scale used the “past 4 weeks” reference time period, whereas in each program lesson, the instructions had a reference time period of the “past week.”
Follow-Up Survey Sample
A total of 290 of the 1,297 unique users also participated in the survey and had usable survey data (22%). Dates of survey completion ranged from December 2016 to March 2019. The typical time period between the date of the last session used in a program and the date of completing the follow-up survey was about 1 month. Survey completers were similar to the non-completers on factors of user age, gender, employer size, and baseline level of clinical severity on all four of the clinical outcome measures. However, the survey group differed from the non-survey group on rate of taking the CA (survey group lower), number of lessons used (survey group higher), and use of both of the live support options (survey group higher). In the survey sample, 270 of the 290 users had responses on a set of questions asking about work outcomes. This indicated that 93% of the survey sample was employed. A similar level of employee status could be assumed for the full sample of users in the study. The other 7% were likely spouses or other covered family members with access to the service.
Follow-Up Survey Measures
The specific questions and responses on the self-report survey were as follows.
Satisfaction with experience
A single item asked, Overall, how satisfied were you with the Learn to Live experience? Analyses included all five available options and combined the percentage of respondents who selected either of the two satisfied options into one focal group.
Attitude toward employer
A single item asked, Do you now have a more favorable attitude toward your employer because they cared enough about you to provide Learn to Live as a free benefit? Analyses included all three available options, with the percentage of respondents who selected “Yes” as the focal group.
Impact of program use
A stem question asked, How much has using the information, programs, and resources from Learn to Live improved these areas of your life? Seven different areas are listed afterward, with two of these seven representing overall health and overall work outcome areas: (a) My understanding of emotional challenges or sleep challenges and (b) My ability to be productive at work or school.
Work schedule
A single item asked, About how many hours does your employer expect you to work in a typical 7-day week? (If it varies, estimate the average.) Response was to fill in the blank for the number of hours scheduled.
Work absenteeism
A single item on hours of job absenteeism was adapted for this study from the single item on the World Health Organization’s Health and Productivity Questionnaire (HPQ; Kessler et al., 2003). Single item: This item concerns your level of absenteeism from work. During the past 4 weeks, how many times did you miss an entire day of work because of issues with your physical or emotional health? And also, how many times did you miss part of a workday (arrived late or left early) because of your physical or emotional health? Response was to fill in the blank for the total number of missed workdays.
To also get the pre-use data for this outcome, the question was repeated with these instructions: During the 4-week period BEFORE you first used Learn to Live, how many times did you miss an entire day of work because of issues with your physical or emotional health? And also, how many times did you miss part of a workday (arrived late or left early) because of your physical or emotional health? Response was to fill in the blank for the total number of missed workdays.
Work productivity
A single item on work productivity was adapted for this study from the single item on job performance from the World Health Organization’s HPQ (Kessler et al., 2003). Single item: This question concerns your level of productivity on-the-job. How would you rate your overall job performance on the days you worked during the past 4 weeks? Please use the rating scale of 0 to 10, where 0 is the worst performance and 10 is the top performance.
To also get the pre-use data for this outcome, the question was repeated with these instructions: Please answer the same question of the period BEFORE you first used Learn to Live. How would you rate your overall job performance on the days you worked during the 4-week period before you first used Learn to Live?
LPT
To estimate the potential financial impact of program use for employees, it was necessary to convert the work absenteeism and work productivity outcomes into a combined measure of the hours of lost work productivity. The single metric of hours of LPT concept is based on the work of the American Productivity Audit Project (W. F. Stewart et al., 2003).
For illustrative purposes, consider this hypothetical example: This metric starts with considering all of the hours someone is scheduled to work in a month. Assume a 160-hr standard full-time schedule. From this schedule, subtract the hours of absence at baseline (assume 10 hr), leaving 150 hr actually worked. Next, the work productivity 0 to 10 rating results are used to determine how much of the remaining time at work was unproductive time. The 0 to 10 rating reflects the full range of low to high work productivity, and, when multiplied by 10, it becomes a metric of 0% to 100% of work time. Assume that at baseline there was a 60% level of work productivity. The amount of unproductivity is the difference between this level and the maximum of 100%. In this example, 40% of the time worked was unproductive (100% maximum minus the 60% at baseline). To get the number of hours of unproductive time, multiply the actual hours worked (150) by the level of unproductivity (40%). This amount of unproductive time (60 hr) is then combined with the number of hours of absence from work (10) to yield the total LPT result (i.e., 60 + 10 = 70 hr). This calculation is repeated for both the pre- and post-use periods.
Results
Part 1: Profile of Program Utilization
Overall, the most popular program was Stress, Anxiety, & Worry with 633 users, which represented about half of all participants. The other programs had fewer users: 295 users for the Insomnia program, 268 users for the Depression program, and 170 users for the Social Anxiety program.
Most of the participants also used the preliminary online CA tool prior to starting to their online program. In the Stress, Anxiety, & Worry program, 88% took the CA. In the Depression program, 88% took the CA. In the Social Anxiety program, 87% took the CA. In the Insomnia program, 75% took the CA. After taking the CA, the participant formally enrolled in the Learn to Live offering and selected a specific program to start. A match between the recommended program and the program actually used, ranged from 44% match among the CA subsample of users of the Insomnia program; 65% match among the CA subsample of users of the Social Anxiety program; 74% match among the CA subsample of users of the Stress, Anxiety, & Worry program; and 82% match among the CA subsample of users of the Depression program. A match between the program recommended by the CA (i.e., coded as match = 1; not match = 0) and the level of clinical symptom severity at baseline was significantly positively correlated for all four programs (r range = .50–.55, all ps < .001).
Each set of eight iCBT program lessons was designed to be completed in a structured sequence order from Lesson 1 to Lesson 8. A prior lesson must be completed for the user to progress to the next lesson in the program. As shown in Table 2, actual use of the possible lessons among study participants ranged from a total of two to all eight in each of the four programs. Overall, the number of lessons used averaged about four lessons per user for participants in each of the mental health–related programs, but about five lessons for the Insomnia program. The number of lessons used can be considered an intervention “dosage” effect provided by these iCBT tools. This dosage effect is tested later in the article for possible differences in the impact on outcomes.
Profile of Program Utilization Factors: By iCBT Program.

Note. iCBT = internet-delivered cognitive-behavioral therapy; M = mean.
The timing of program usage had some variability but was somewhat consistent across the four programs. The median period of use of the online tools was about 3 weeks, whereas the mean was higher at around 4 to 5 weeks. Duration of use was positively correlated with the total number of lessons completed (r of .37–.46 depending on the program), and therefore was not tested as a moderator factor of outcomes.
Some participants also used the services of a “coach” from the clinical staff. Usage of coaching support ranged from 17% of participants in the Insomnia program to 38% of participants in the Depression program. Another option of the service was to self-identify another person (or multiple people) from the user’s existing social network who could serve as a “teammate” for peer support. Use of a teammate ranged from only 2% of Insomnia users to 15% of Depression users. It was far more common to select one of these live supports rather than to use both at the same time.
Part 2: Improvement in Clinical Symptoms After Program Use
General Linear Model analyses were performed to test the extent of change from before to after program use (i.e., pre vs. post). The data source for start of use was either the preliminary CA or, if the user had not completed the CA, the first lesson of the program. Even though most of the users had scores from both the CA and the first lesson (75%–88%), the CA data were preferred as it represented the earliest score available for baseline or starting level of clinical severity. Preliminary analyses revealed no meaningful differences in clinical improvement outcomes for all programs based on whether or not the CA was completed. For most users, the time period between taking the CA, registering for a program, and then starting the first lesson was less than 1 day. The data source for the score at the post or end of program use varied also within person from Lessons 2 through 8.
Test results indicated that each program had significant improvement from pre- to post-use in clinical symptom severity scores. See Table 3 for details. On a descriptive basis, the difference between the mean scores at pre and at post was calculated and divided into the pre-score average. The result was a percentage change (i.e., reduction in severity or improvement) from before to after use of the program. The Depression program had a large size statistical effect and 34% improvement in depression symptoms. The Stress, Anxiety, & Worry program had a medium size effect and a 28% average improvement in clinical symptoms of anxiety. The Insomnia and Social Anxiety programs had medium size effects and average psychometric improvements of 24% and 19%, respectively. On average, across the four programs, use of these iCBT programs resulted in a 26% improvement in symptom severity.
Improvement in Clinical Symptoms from Pre to Post: By iCBT Program.

Note. M = mean. F tests from repeated-measures GLM test of within-subjects factor of change over time from pre- to post-program use. iCBT = internet-delivered cognitive-behavioral therapy; GAD-7 = Generalized Anxiety Disorders–seven-item scale; PHQ = Patient Health Questionnaire; SPIN = Social Phobia Inventory; MOS = Medical Outcomes Study; CA = Comprehensive Assessment; GLM = generalized linear model.
p < .001.
Part 3: Improvement by Initial Level of Clinical Severity
The percentage of program users who were initially above the clinical risk threshold was 57% when averaged across the four programs. But it ranged from a majority of the users for Depression (79%) and Social Anxiety (65%) programs, to a minority of users for the Insomnia (43%) and Stress, Anxiety, & Worry (42%) programs. Reasons for these differences between programs in percentage at clinical level are unknown. The extent of improvement was tested between the users who were clinical versus subclinical in their symptom severity at baseline. The mean scores and test results are displayed in Table 4. In general, more improvement occurred among the clinical users compared with the subclinical users (29% vs. 17%, respectively, when results were averaged across programs). Clinical users of the Stress, Anxiety, & Worry program had 2.9 times the improvement relative of the subclinical users. Clinical users in the Social Anxiety program had 2.2 times the improvement of the subclinical users. Clinical users of the Insomnia program had 1.5 times the improvement of the subclinical group. In the Depression program, users in the clinical group had 1.2 times the improvement of the users in the subclinical group.
Improvement in Clinical Symptoms Pre to Post for Groups Based on Clinical Severity at Baseline: By iCBT Program.
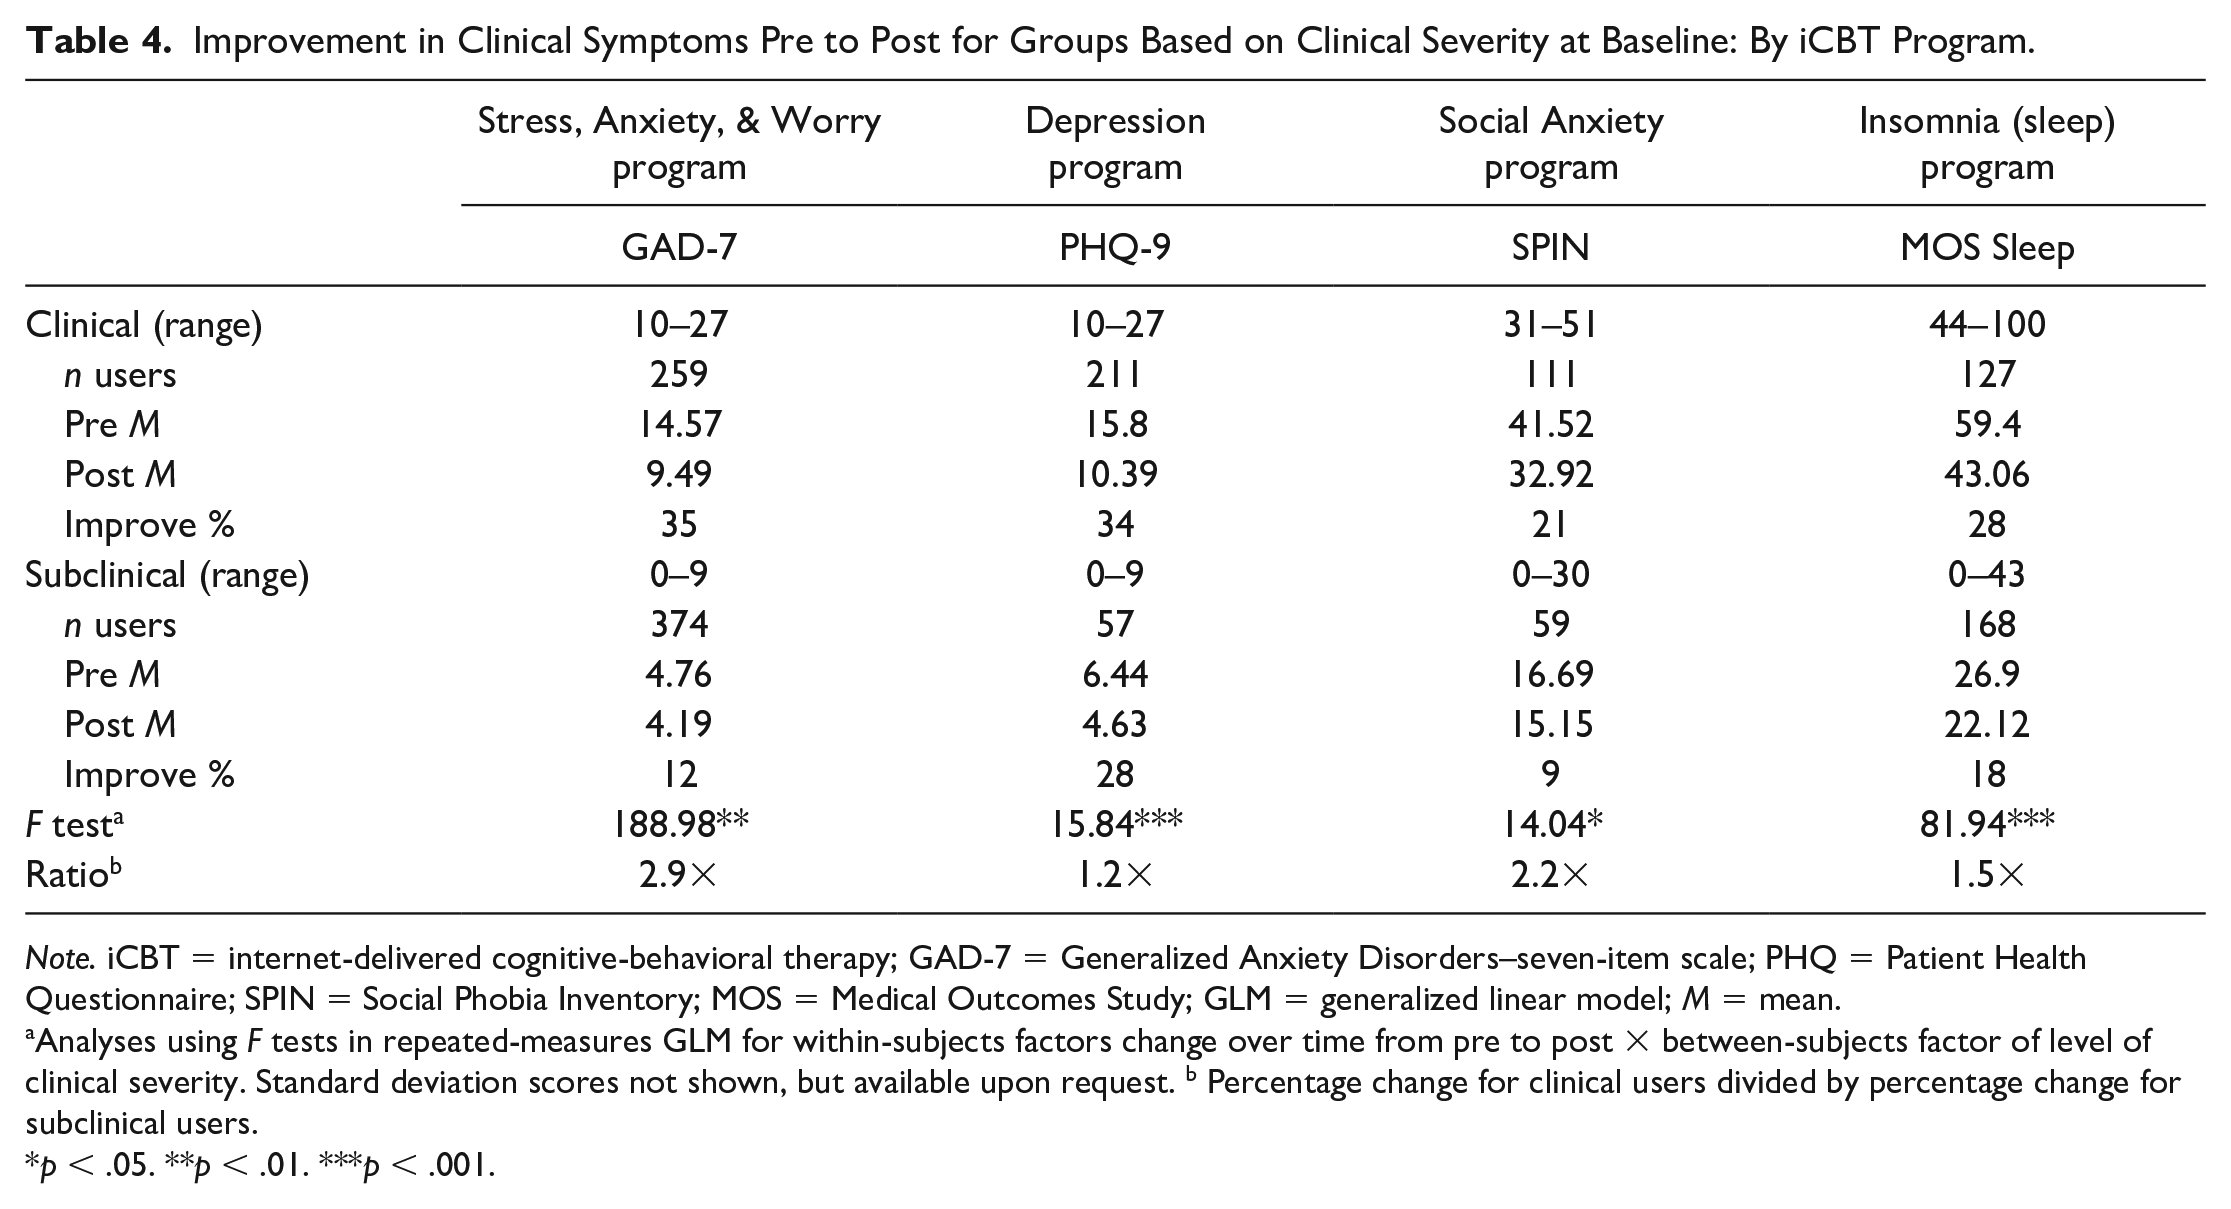
Note. iCBT = internet-delivered cognitive-behavioral therapy; GAD-7 = Generalized Anxiety Disorders–seven-item scale; PHQ = Patient Health Questionnaire; SPIN = Social Phobia Inventory; MOS = Medical Outcomes Study; GLM = generalized linear model; M = mean.
Analyses using F tests in repeated-measures GLM for within-subjects factors change over time from pre to post × between-subjects factor of level of clinical severity. Standard deviation scores not shown, but available upon request. b Percentage change for clinical users divided by percentage change for subclinical users.
p < .05. **p < .01. ***p < .001.
Additional tests were conducted only among users who started out above the clinical level of symptoms to find out how many of these individuals had improved enough after program use to no longer be at risk clinically. For the Stress, Anxiety, & Worry program, 53% (126 of 259) of users who were above the clinical threshold for anxiety had improved to be subclinical status after program use, χ2(1) = 65.64, p < .001. For the Depression program, 48% (102 of 211) of users who were above the clinical threshold for anxiety had improved to be subclinical status after program use, χ2(1) = 36.67, p < .001. For the Social Anxiety program, 35% (39 of 111) of users who were above the clinical threshold for anxiety had improved to be subclinical status after program use, χ2(1) = 52.57, p < .001. For the Insomnia program, 56% (71 of 127) of clinical users at the start had improved to be below the clinical threshold score after program use, χ2(1) = 65.64, p < .001. When these results were averaged across the programs, about half (48%) of clinical users were no longer above the clinical severity threshold after program use.
Part 4: Improvement by Level of Program Use
Analyses were conducted to test whether improvement after program use varied by the number of lessons of the program used. The number of lessons used was condensed into three groups: Group 1 included those participants who used only the first two lessons in a program (34% of users on average across all programs), Group 2 included those participants who used between three and seven lessons (44%), and Group 3 represented the participants who completed all eight lessons (22%). For each program, this process yielded a count of participants in each of the three groups large enough to conduct statistical tests. The generalized linear model (GLM) test results for the interaction effect of the factor of time and the factor of the number of lessons used were highly significant for each program (see Table 5). For each program, the minimal use group had the lowest level of improvement, whereas the program completion group had the highest level of improvement. Results for the moderate use group were in-between. Across the four programs, there was an average of 13% improvement among the users of two lessons, a 28% improvement among those who used between three and seven lessons, and a 49% improvement for those who completed the full eight-lesson program. Thus, on average, those who completed all eight lessons had about four times (3.9) the extent of improvement compared with those who completed just two lessons.
Improvement in Clinical Symptoms by Partial to Full Program Participation: By iCBT Program.

Note. Standard deviation scores not shown, but available upon request. iCBT = internet-delivered cognitive-behavioral therapy; GAD-7 = Generalized Anxiety Disorders–seven-item scale; PHQ = Patient Health Questionnaire; SPIN = Social Phobia Inventory; MOS = Medical Outcomes Study; GLM = generalized linear model.
Analyses using F tests in repeated-measures GLM for within-subjects factors change over time from pre to post × between-subjects factor of level of clinical severity. Standard deviation scores not shown, but available upon request. b Percentage change for all lessons group divided by percentage change for two lessons group.
p < .001.
Part 5: Improvement by Combination of Level of Clinical Severity and Lessons Used
The starting level of clinical severity and the number of lessons used were examined together within each program. See results in Table 6. Overall, the pattern of findings was similar for each program, such that the greatest improvements occurred for the subgroups of participants who had started at the clinical status and who also had completed the entire program as designed. In contrast, for three of the four programs, little improvement was found in the other subgroups of users who had subclinical risk at the start and who had the least amount of participation in the program (i.e., only two lessons). The difference between these two extreme subgroups was dramatic: 66% versus 1% (respectively) with the Stress, Anxiety, & Worry program, 47% versus –4% (respectively) with the Social Anxiety program, 38% versus –4% (respectively) with the Insomnia program, and 57% versus 25% (respectively) with the Depression program.
Extent of Improvement in Clinical Symptoms by Interaction of Clinical Versus Non-Clinical Severity at Baseline and Number of Lessons of Use: By iCBT Program.

Note. Standard deviation scores not shown, but available upon request. iCBT = internet-delivered cognitive-behavioral therapy; M = mean.
The percentage of improvement in the clinical outcome score for each subgroup was also averaged (unweighted mean) across the four programs. The findings are displayed in Figure 1 for the six subgroups of users based on the combination of their initial clinical status and the total number of lessons used. This shows the same pattern of increasingly better outcomes as the number of lessons increases for both the subclinical and the clinical status users, but with more improvement at each level of program use among the clinical-level users than the subclinical users.
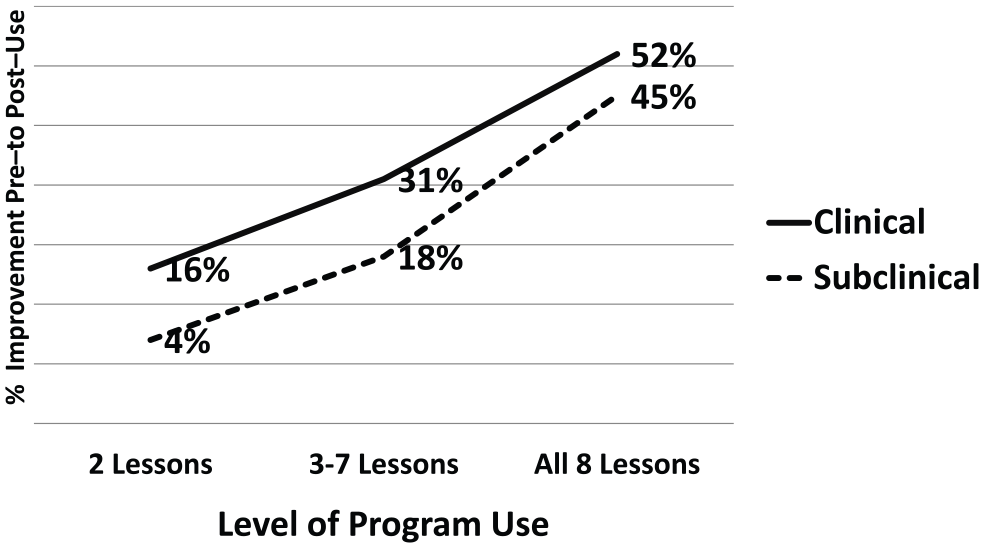
Percentage of improvement in clinical symptoms (averaged across four iCBT programs) by level of program use for clinical and subclinical users.
Part 6: Improvement by Optional Live Support of Coaches or “Teammates”
Use of a live coach occurred about 3 times as often as use of a teammate (across the four programs, 27% of all users had a coach vs. 8% who had a teammate). Each of the four programs had enough users with a coach to conduct tests, but only two of the four programs had enough users with a teammate to conduct tests.
In each program, those who utilized support from a coach tended to use a greater total number of lessons and also to have longer duration for the time period of program use (see Table 7). Use of a coach was also associated with slightly higher initial levels of clinical symptom severity at baseline in two of the programs (Insomnia and Stress, Anxiety, & Worry). In general, use of a coach occurred to a similar extent among men and women and among users in different age groups (results not shown). The two exceptions were in the Social Anxiety program, where use of a coach occurred slightly more among women than men (r = .17), and in the Insomnia program, where use of a coach occurred slightly more among older users (r = .14).
Optional Live Support from Program Coach or Personal Teammate: By iCBT Program.

Note. iCBT = internet-delivered cognitive-behavioral therapy; NA = not applicable, too small sample size. Pearson’s correlation: r values; M = mean.
p < .10. *p < .05.
Use of a coach was associated with greater clinical improvement in each program (see Table 7). Averaged across the four programs, those with a coach had an improvement of 32% from their baseline symptom scores compared with 24% improvement for those lacking a coach. This is 1.3 times more improvement for participants with a coach. Users with coaching support in the Social Anxiety program had 1.7 times greater improvement, F(1, 168) = 4.43, p < .05. Users with coaching support in the Insomnia program had 1.5 times greater improvement, F(1, 293) = 15.60, p < .001. Users with coaching support in the Stress, Anxiety, & Worry program had 1.2 times greater improvement, F(1, 631) = 8.43, p < .001. Users with coaching support in the Depression program had 1.2 times greater improvement, but this did not reach statistical significance, F(1, 266) < 1, ns.
Similar tests for the live teammate support were limited to the Stress, Anxiety, & Worry and Depression programs. For both of these programs, the choice to use a teammate was associated with higher initial levels of clinical symptom severity at baseline. Use of a teammate was associated with slightly more lessons used, but this reached significance for only one of the two programs. Use of a teammate occurred slightly more often among younger age users in both programs (Stress, Anxiety, & Worry, r = –.10; Depression, r = –.19). Use of a teammate was unrelated to duration of use and gender of the user.
Averaged across the two programs, users with teammate support had a 41% improvement in clinical symptoms compared with 29% improvement for those lacking such support. More specifically, users with teammate support in the Stress, Anxiety, & Worry program had 1.4 times the improvement of those without a teammate, F(1, 631) = 10.54, p < .001. Users with teammate support in the Depression program had 1.5 times the improvement of those without a teammate, F(1, 266) = 4.43, p < .10. This is a relative difference of 23% more improvement for participants with a teammate.
In summary, ongoing support from a professional coach was chosen more often than support from a personal friend or family member, but the impact of using a live support on outcomes was similar for both coaching and teammates (each at 1.4 times greater improvement). Users with support from a coach were somewhat higher in clinical severity at the start and tended to participate to a greater extent in the programs by doing more of the lessons and being in the program over a longer period of time.
Part 7: Improvement by User Gender and Age
Gender had no impact on the amount of clinical change in any program. User age had no impact in two of the programs (details not shown), but significant moderator effects for age were obtained in two other programs. For the Stress, Anxiety, & Worry program, slightly greater improvement in anxiety symptom scores was found among users in the youngest and the oldest age groups (both 32% improvement) compared with results for those in their 30s and 40s—both groups had 23% improvement; F(3, 616) = 19.71, p < .001. For the Depression program, there was slightly greater improvement in symptom scores among users in the 40- to 49-year-age group (38% improvement) compared with the users in other age groups (range = 32%–33%), F(3, 264) = 3.12, p < .05. The overall lack of moderator effects found for these demographic factors (six of eight tests were not significant) indicated the consistency of program impacts for women and men and for users of different ages. In addition, other similar moderator tests found no differences in clinical improvement after program use for the factor of the size of the employer where the participants worked (data not shown).
Part 8: Survey Outcomes
A descriptive approach guided the analysis of the survey data to explore user responses concerning satisfaction with use of the service and impact on a range of health and work outcomes. The results on the survey items were similar among users of the four programs (see Table 8). Satisfaction with the experience was very high, with an average across programs of 90%. Satisfaction ranged from 85% to 99% depending on the program. Having a better attitude toward the employer (for caring enough to provide the service) was also high at an average of 72% across programs. This outcome ranged from 68% to 80% depending on the program. Other questions explored the impact on the user’s understanding of emotional or sleep challenges and on the user’s level of productivity at home or work. Most of the responses reflected a moderate or small degree of impact, with about one in every 10 users reporting a big impact. However, about one in every 10 users also reported no impact of the program for health outcomes, and about one in every five users reported no impact on their work productivity. On average, across programs, 62% of users reported a big or moderate impact on how use of the program had improved their understanding of emotional health or sleep challenges and 46% of users reported a big or moderate impact of program use on their ability to be productive.
Follow-Up Survey Results on Satisfaction, Attitude Toward Employer, and Impact on Health and Work: By iCBT Program.

Note. The number of unique users across all programs was 290. iCBT = internet-delivered cognitive-behavioral therapy.
Other items on the survey asked more specifically about work absenteeism and productivity level in the past month for periods before and after use of the program. These items were relevant to the 93% of the survey sample who were employed (n = 270). Results for this section are presented for each program in Table 9.
Follow-Up Survey Results for Employee Productive Work Time Compared at Pre- and Post-Use of Program and Estimated Cost Savings: By iCBT Program.
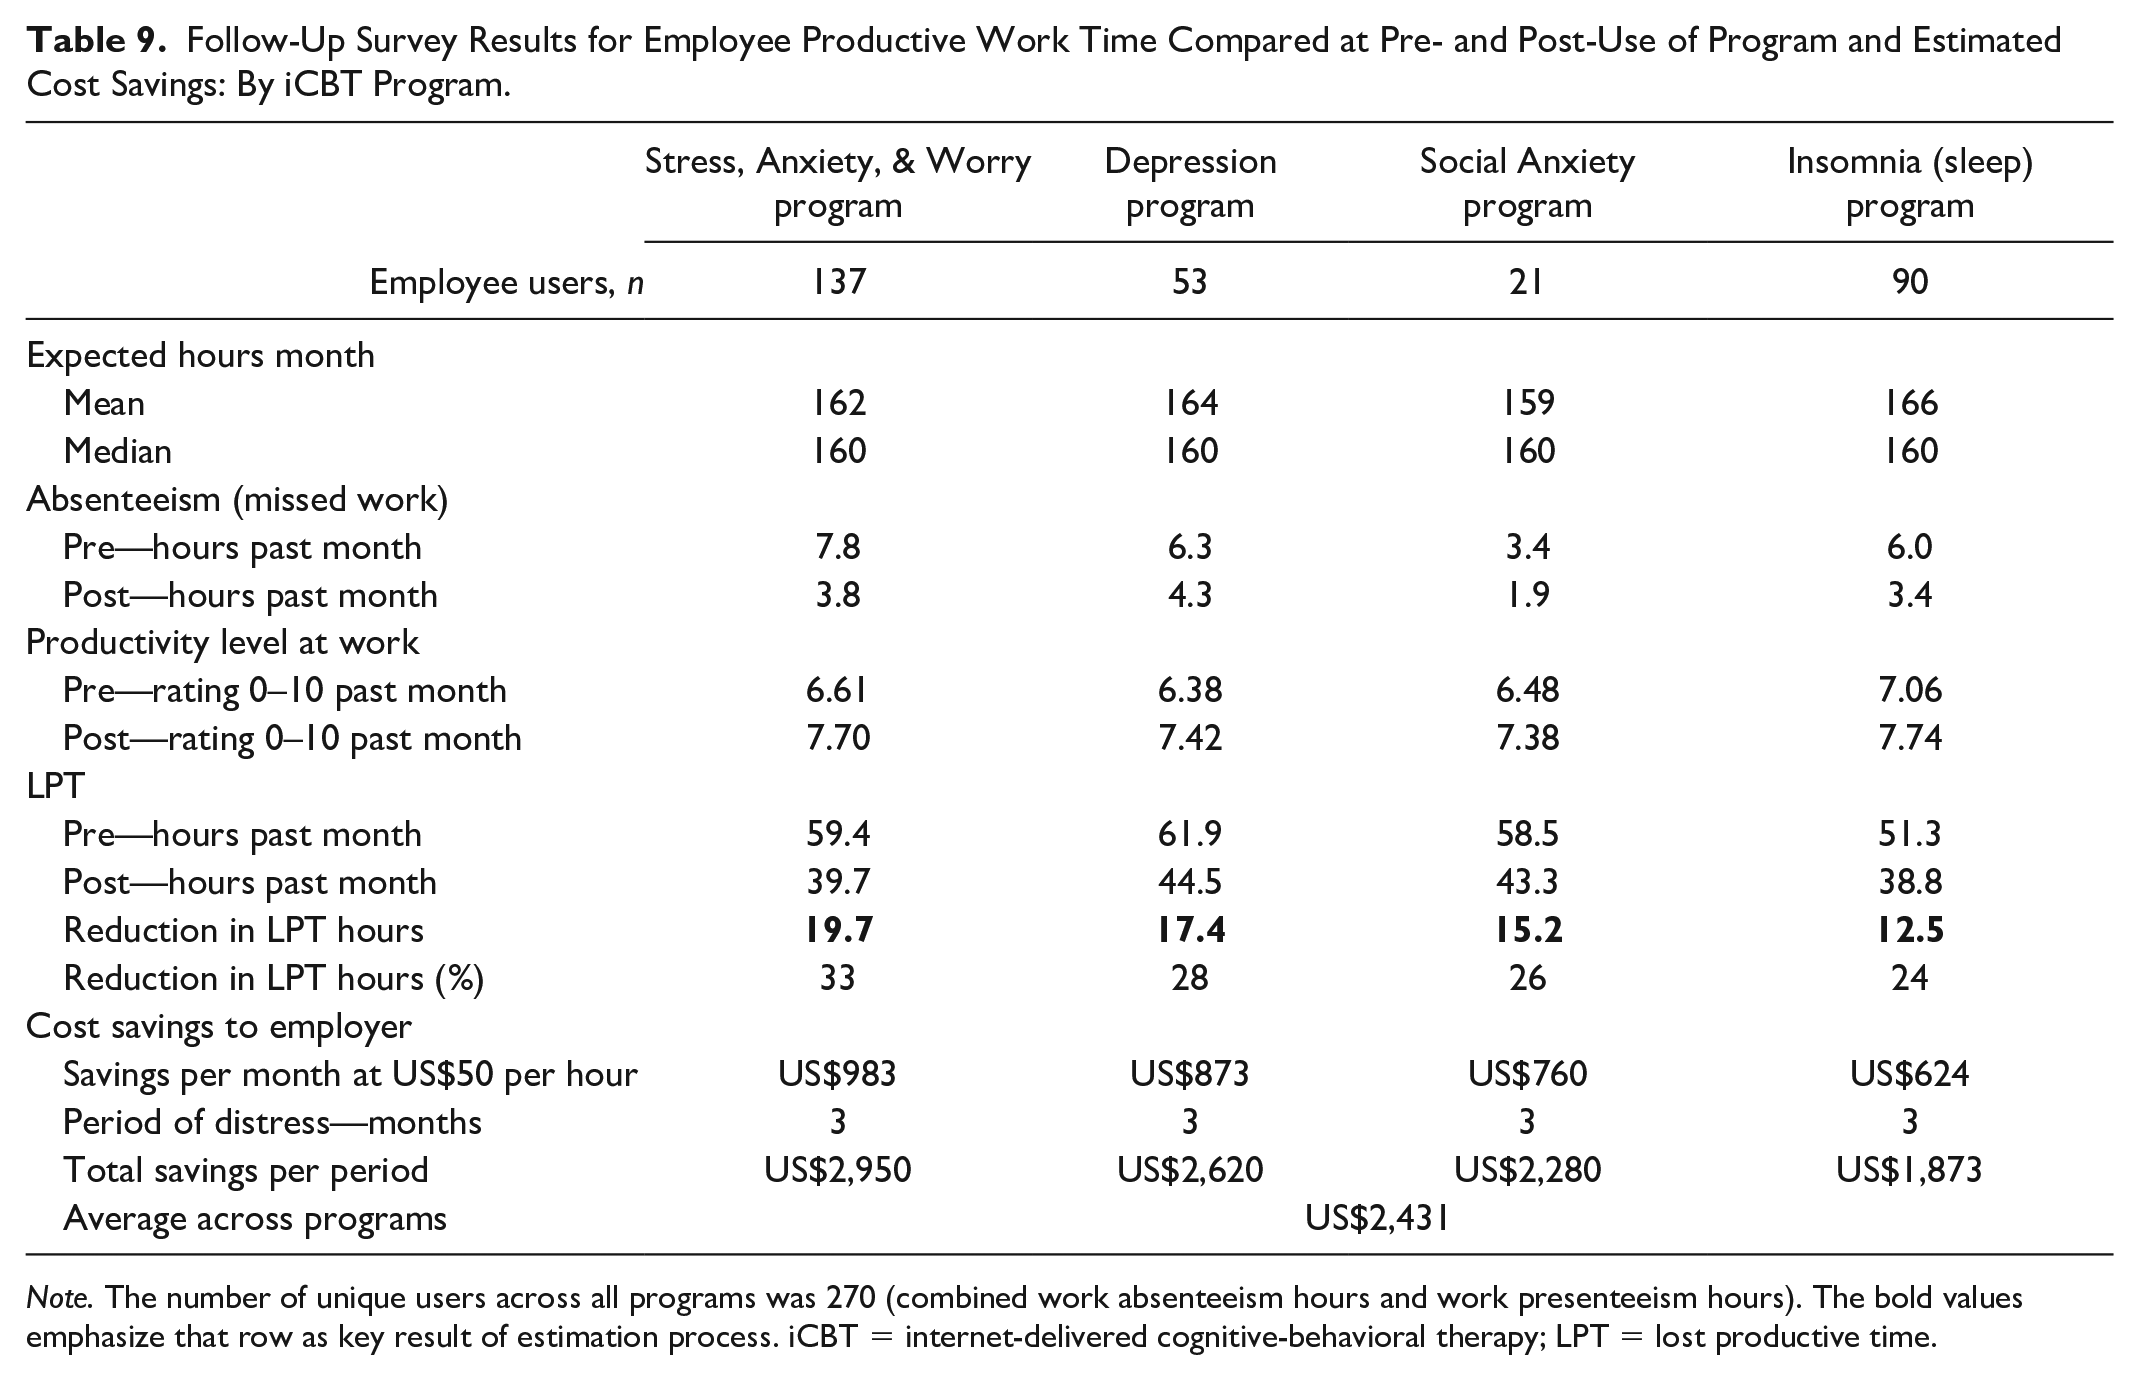
Note. The number of unique users across all programs was 270 (combined work absenteeism hours and work presenteeism hours). The bold values emphasize that row as key result of estimation process. iCBT = internet-delivered cognitive-behavioral therapy; LPT = lost productive time.
On average across the four programs, there were 5.88 hr of missed work in the past month at before starting use of the program, and this was reduced to 3.35 hr after use of the program. This change was 2.53 hr of less time away from scheduled work. The level of performance on the job at the start of the program use averaged 66% (on scale of 0%–100%) across the four programs, and this was increased to 76% at follow-up. These findings indicate a reduction in work absence and also a rebound in the level of performance while on the job after use of the programs.
When the productivity ratings were converted to hours of unproductive time and combined with the hours of missed work, the total LPT result for before use of the program, when averaged across programs, was 57.78 hr (i.e., 51.91 + 6.68, respectively). When this same calculation process was repeated for the average findings across the four programs for the post-use period, the result was 45.26 hr (based on sum of 41.58 hr of presenteeism + 3.35 hr of absenteeism). The difference in LPT hours from pre to post was a reduction of 16.21 hr of LPT, which is a 28% reduction. This outcome represents about 2 full days of work per month that were restored after use (based on a standard 8-hr workday). Of this change, 84% of the time was due to improved work presenteeism compared with only 16% due to improved work absenteeism.
Cost savings in avoided LPT suggest that these online self-directed tools can offer value to both the user and to the employer sponsor. Assuming a US$50 per hour cost value for an hour of work (according to the recent U.S. Bureau of Labor Statistics, 2019, data for average wages and compensation in the private-sector jobs was US$49.85), the workplace cost savings to an employer in just 1 month of time were as follows: US$624 for Insomnia, US$760 for Social Anxiety, US$873 for Depression, and US$983 for Anxiety. Given that these kinds of behavioral health issues can persist for months or even years when untreated, the associated workplace performance deficits (and financial costs of lost work productivity) are likely far greater than the 1-month time frame used here. Therefore, if a more realistic 3-month period of adverse impact is considered (which is typical in employee assistance program (EAP) work outcome and return on investment [ROI] studies; Chestnut Global Partners, 2019), then the total hours of LPT become 48.6 hr and, when valued at US$50 per hour, the average savings from these iCBT programs were estimated at US$2,431 per employee user.
Discussion
This study examined whether digital tools could reduce symptoms associated with the problem areas of anxiety, depression, social anxiety, and insomnia. Significant improvements were found for each program, with a large size statistical effect for the Depression program and medium size effects for the other three programs. Across programs, there was an average of a 26% reduction in severity of clinical symptoms.
The initial level of clinical severity among program users was an important factor contributing to improvement, with twice as much improvement for “clinical” users compared with subclinical users. It was not surprising to find that the clinical group of users had a relatively greater level of improvement after use of the program compared with the subclinical group of users. At the most basic level, those with more elevated scores have more “room for improvement” than those with lower scores in the subclinical range as they had higher scores to start with at the first lesson. However, it is actually not a limitation to the study results, as it makes the chance of finding significant reductions in clinical symptom scores in the total sample harder to achieve than if only the clinical status users were examined and the subclinical users had been removed. Rather, it is a strength of the study design to find significant results in spite of the limited range among the subclinical participants.
It is also relevant to learn that in this applied business context, the subclinical portion of the users represented a large share (43% on average across the programs) of the total number of participants who self-selected to use these online behavioral health support resources. One can speculate that the motivation for use among these subclinical users was perhaps to learn more about this particular behavioral health issue or to get therapeutic support when the issue was still at a minimal or mild level of severity. These findings represent a positive prevention effect from these iCBT tools for helping most of these people at subclinical levels to stay at their lower level of severity.
The other important moderator factor was the “dosage” factor of how many lessons of the online programs were used. Overall, the best results were associated with users who were both high in clinical severity at the start and who fully used all eight of the program lessons. The least amount of improvement was found among the users who started out at subclinical status and who did only two of the eight lessons. Improvements for completers of all eight lessons were 3 times those of users of only two lessons. This beneficial effect of adherence to the full program content is a finding consistent with other research on adherence in use of similar kinds of iCBT tools for mental health issues (Dryman et al., 2017; Karin et al., 2018; Karyotaki et al., 2015).
Use of the optional live coaches from the service, which boosted the level of engagement in key aspects of program participation, resulted in an average of 26% improvement in clinical symptoms. Optional use of peer supports as “teammates” also had a positive impact on outcomes in two of the programs where there were enough users of this kind of support to test, with an average of 23% more improvement. The positive role of coaching support while using digital self-directed tools for depression has also been found in past research (Melling & Houguet-Pincham, 2011; Palacios et al., 2018).
Even though there were about three women for every man in this study, the gender of the users was not related to differences in clinical outcomes for these iCBT programs. This study also found mixed results for the impact of age on clinical outcomes, with only small size effects in two of the four programs. Thus, the effectiveness of these iCBT programs was not limited to one gender or to a particular age cohort of workers.
The post-intervention survey data revealed high levels of satisfaction, more positive attitudes toward the employer as sponsor, and modest perceived impact of program use on understanding clinical topics addressed by the program (emotional health and sleep) and on the ability to be productive at work or home.
Among the employee users who answered the survey, the level of work absence in the past month was reduced from 6.8 hr at the start of program use to 3.8 hr at the follow-up. Both the pre- and post-levels of absence were about half as much as the typical troubled worker who uses an EAP for counseling (either in-person or by telephone), which average 13.0 hr of absence in the past month when starting counseling and 6.4 hr at follow-up (based on industry norms from over 223,000 EAP counseling cases; see Attridge, 2016). However, the levels of work productivity at pre- and post-use for the iCBT users in this study of 66% and 76% (respectively) were similar to the 64% and 79% levels found for the typical worker who used EAP counseling (based on industry norms from over 242,000 EAP counseling cases; see Attridge, 2016). Thus, when compared with the typical employee user of EAP in-person or telephone counseling, the employer uses of these iCBT self-guided programs were lower in hours of work absence but similar in work productivity levels.
For a more general comparison, the typical “healthy” worker misses about 3 hr of work per month due to health issues and has a 84% level of work productivity (on the same 0%–100% scale; see review by Attridge, 2016). This difference between users of iCBT services and the average employee in work absenteeism and work productivity level is evidence for why providing online support for employees with anxiety, depression, social anxiety, or sleep issues is needed and also that these important work outcomes can be improved after use of online programs. These findings are also consistent with many other applied studies showing that behavioral health issues tend to affect employee work productivity much more than they affect work absenteeism (Goetzel et al., 2004; Johns, 2010).
Limitations
There are certain limitations to this study. It was conducted on “real-world” samples of users who had access to one commercially available online service. It is unknown whether these findings can be replicated in other samples of employees. How the use of the online program tools was related to the changes observed on the clinical outcome measures needs further scrutiny to determine the most impactful aspects of the experience and tools. Moreover, there were no comparison groups in the study, nor was random assignment of users to the program possible due to the real-world non-experimental nature of the study. Thus, the relative change in assessment scores for users of these iCBT tools compared with a matched group of non-users (or to other possible interventions) was not tested. Comparison with a control group in experimental conditions, however, is rare in the research literature on outcomes of workplace counseling programs (Attridge, 2001; Attridge et al., 2018), nor has it been done in applied outcome studies of other commercially available iCBT programs (Carpenter et al., 2016; Dryman et al., 2017; Schladweiler et al., 2017).
The outcome of reduction over time in clinical symptom severity also could have been addressed with the alternative methodology developed by Jacobson and Truax (1991). The “Reliable Change Index” (RCI) approach uses the standard error variance obtained from the study sample at the pre-period to calculate a metric that specifies the exact numerical difference between the starting score and last score that becomes a benchmark for what would be unlikely to have occurred by chance alone (i.e., p < .05 difference). This RCI approach was taken in a related study of college student users of the same four online iCBT programs from Learn to Live (Attridge et al., 2019).
Finally, the survey was the single source for both the pre-use and post-use levels of the work absenteeism and work performance outcomes. It would be better from a measurement validity perspective to have the pre-levels of these key outcomes collected on the preliminary CA or at the first lesson, rather than estimated retrospectively on the survey. Even though a small literature has established the validity of self-report measures of work absence and performance (Jenkins, 2014; Kessler et al., 2003, 2004; Mitchell & Bates, 2011), using company records of employee absence hours and work productivity levels could provide greater validity for these measures than our use of self-reported data.
Implications
The present study replicates the findings from other commercial providers of digital technology approaches for supporting common mental health and insomnia issues (Carpenter et al., 2016; Espie et al., 2018; Hirsch et al., 2017; Palacios et al., 2018; Schladweiler et al., 2017). More generally, the analysis of data collected through routine business practices in this study supports the clinical efficacy of how these kinds of services are used in the real world. It also provides a unique perspective by comparing four distinct clinical topics that all shared the same digital platform and same interactive website tools.
The present study also broadens the range of who can benefit from these programs by including users who were lower in clinical symptom severity than the standard randomized controlled trial (RCT) study design that includes only participants who were “at-risk” clinically (Clarke et al., 2005; Hagatun et al., 2019; Nordgren et al., 2014). This wider range in the severity level of users could be important to employers, as there are typically many more employees who are at subclinical levels of severity with these behavioral health problems than those who are at the clinical levels. The subclinical user pool represents the segment of working adults appropriate for preventive interventions (Wang, Lam, et al., 2016). Finding similar outcomes across users of different ages (mostly) and genders in the study suggests general effectiveness of these kinds of tools across common demographic characteristics.
Finally, a strength of this study is the inclusion of workplace outcomes for employee users of iCBT tools (see discussion in Wang, Patten, et al., 2016). While having a small impact on reducing work absenteeism, these tools tend to improve the work productivity of employees. Such outcomes may financially benefit the employer sponsor of these services indirectly through reductions in the business costs associated with employee lost productive work time and perhaps also through greater loyalty resulting from more favorable employee attitudes toward the employer.
Footnotes
Acknowledgements
The author wishes to thank Russell Morfitt, PhD, and Brandon Densmore, both of Learn to Live, Inc., for their assistance in preparing the data and the analytical approach for this study.
Author’s Note
All aspects of this evaluation project and preparation of the manuscript followed the ethical guidelines of the American Psychological Association.
Declaration of Conflicting Interests
The author(s) declared the following potential conflicts of interest with respect to the research, authorship, and/or publication of this article: The author is an independent research scholar and received financial support from Learn to Live, Inc. as a consultant for conducting this research evaluation project. Since 2017, the author occasionally has worked as a paid consultant on other related projects for this same company.
Funding
The author(s) disclosed receipt of the following financial support for the research, authorship, and/or publication of this article: The author received partial financial support for the research and/or authorship of this article from Learn to Live, Inc.