
Abstract
The Nigerian bond market is currently one of the most liquid in sub-Saharan Africa. Many African countries regard it as a model from which to learn and based on which to develop their respective bond markets. The developments achieved in the Nigerian bond market are of particular interest to both investors and fixed income analysts—both domestic and international. One of the important tools required for fixed income analysis, pricing, and trading is the yield curve. To the best of our knowledge, even though the Nigerian bond market has a secondary market yield curve, the yield curve is a yield-to-maturity curve, and not zero-coupon yield curve. The purpose of this study is to model the zero-coupon, par, and forward yield curves for the Nigerian bond market. We use various methods such as the piecewise cubic Hermite method, the piecewise cubic spline method (with not-a-knot end condition), the Nelson–Siegel–Svensson method, and the variable roughness penalty method. Data are obtained from the FMDQ OTC website. The results show that the piecewise cubic Hermite method is very suitable for producing the Nigerian par and zero-coupon yield curves. Our best recommended method for producing the Nigerian zero-coupon yield curve is therefore the piecewise cubic Hermite method, followed by the Nelson–Siegel–Svensson method. For the forward yield curve, the results show that the best method is the Nelson–Siegel–Svensson method, followed by the variable roughness penalty method.
Keywords
Introduction
The Nigerian bond market has been in existence since 1946, and that was when the first government bond—the Development Stock—was issued (Soludo, 2005). Various financial reforms were undertaken afterward to develop and deepen the bond market. In 1958, a financial reform was introduced and this resulted in the creation of the Central Bank of Nigeria (CBN), as well as the creation of marketable public debt securities. The CBN was mandated to be in charge of the issue and management of the government debt securities. While the Development Stock was issued to finance developmental projects and to provide avenue for capital market investment, treasury bills were issued for open market operations and to provide avenue for money market investment. To encourage trading at the secondary market level, the Nigerian Stock Exchange (NSE) was founded in 1960 and was fully operational in 1961. The exchange provided a platform for secondary market trading of the Development Stock. In 1968, Treasury Certificate was introduced to further deepen the money market of Nigeria. The Nigerian bond market looked promising, at both primary and secondary market levels. However, in 1986, a structural adjustment program saw a decline in the issue of the only capital market debt instrument, the Development Stock. The purpose was to allow the financial sector develop a well-defined capital market which was not only based on public sector investment alone, but also on the private sector investment. More attention was then, therefore, paid to the development and enhancement of the equity stock market (Akinsokeji, Adegboye, & Edafe, 2016). By 1988, the issuance of Development Stock had been completely suspended.
In 1989, there was an introduction of another long-term bond—Treasury Bond—which was nonmarketable. About 58.6% of the treasury bills and 100% of treasury certificates were converted into treasury bonds. In other words, the treasury certificates were out from the market and only less than half of the treasury bills were left in the market. The nonmarketable treasury bonds subsequently constituted a huge share (about 69%) of the domestic bonds in Nigeria. The remaining 31% of the government bonds were short term in nature—treasury bills with maturities of 91 days. As a result, the Nigerian bond market virtually became inactive, as a huge portion of the bond market constituted nonmarketable treasury bonds. The only government marketable securities were money market debt securities. The Nigerian capital market therefore comprised equity securities only.
In 2000, the Debt Management Office (DMO), a semi-autonomous body, was established to issue and manage federal government’s domestic and foreign debt securities; regulate the Nigerian bond market; and to carry out necessary reforms to make the government bond market more liquid and active. The CBN was made to act as the issuing house and registrar. In 2003, DMO issued its first Federal Government marketable long-term bond—the Federal Government of Nigeria (FGN) Bond. Since then, the DMO has consistently been issuing long-term FGN bonds, whereas the CBN issues the treasury bills. In 2006, the Primary Dealers and Market Makers (PDMMs) played active role in the issuance, sale, and marketing of bonds. This resulted in active secondary market trading of bonds in Nigeria.
The Nigerian bond market is currently one of the most liquid in sub-Saharan Africa, probably just second to South African bond market (Ajayi, 2013). As a matter of fact, many countries in Africa regard the Nigerian bond market as a model from which to learn, and based on which to develop their respective domestic bond markets. For instance, in August 2015, a delegation of Kenyan financial market authorities visited the FMDQ OTC to study the Nigerian OTC market and the E-Bond Trading System. In early 2017, a delegation from the Ghanaian financial market also went on a study tour to study FMDQ OTC’s businesses and operations, to upgrade their (Ghanaian) bond market operations (FMDQ OTC, 2017a). The Nigerian bond market is now in a position which many African bond markets look up to. Currently, the Nigerian government bonds have maturities ranging from 3 months to 20 years.
The developments achieved in the Nigerian bond market are expected to draw the attention of investors and fixed income analysts—both domestic and international. According to the International Organization of Securities Commissions (IOSCO), one important tool required for analysis, pricing, and trading functions in the bond market is the benchmark yield curve (IOSCO, 2011; Lartey & Li, 2018, 2019). In fact, the Nigerian government frequently issues benchmark debts for the purpose of providing benchmark yield curve. According to the African Financial Market Initiative (AFMI), the Nigerian yield curve is constructed using the FMDQ OTC methodology (AFMI, 2016). Meanwhile, according to FMDQ OTC (2017b), the Nigerian yield curve is a graphical representation of the prevailing mark-to-market yields of benchmark treasury debt instruments, that is, the treasury bills and FGN bonds. Oladunni (2015) also states that the Nigerian yield curve is constructed by plotting the yields-to-maturity of bonds against their remaining terms-to-maturity. These mean that even though the Nigerian bond market has a secondary market benchmark yield curve (unlike many other African bond markets), the yield curve being used by the Nigerian bond market is a yield-to-maturity (YTM) curve, and not zero-coupon yield curve.
Meanwhile, even though YTM curve is the most popular yield curve in many bond markets and trading platforms, it must be used with caution. There are some challenges inherent in the assumptions underlying the concept of YTM. YTM assumes constant payment of coupons which are reinvested at constant rates (coupon rate) during the bond’s life. However, fluctuations in market interest rates would not make this assumption realistic, resulting in reinvestment risk (Choudhry, 2008). On the contrary, the zero-coupon yield assumes no coupon payment and hence assumes no reinvestment of coupons. This makes zero-coupon yield curve preferable to YTM curve. Bank for International Settlements (BIS) also recommends that central banks submit estimates of zero-coupon yields and the methods of estimation to the BIS (BIS, 2005). To the best of our knowledge, the Nigerian secondary bond market, like many other African bond markets, is yet to have zero-coupon yield curve. The CBN is at the forefront of providing the necessary prerequisites to develop the Nigerian bond market. One step taken by the central bank in this regard has been an initiative to commission a project to fit the Nigerian government zero-coupon yield curve (Sholarin, 2014). This is an indication that the Nigerian bond market truly requires zero-coupon yield curve.
Furthermore, according to FMDQ OTC (2016), when estimating closing prices (and yields) in the secondary bond market, yields of nontrading sovereign bonds are derived (by the FMDQ OTC), by using simple interpolation and extrapolation, from the yields of trading sovereign bonds. This presupposes, to the best of our knowledge, that simple (linear) method is used to interpolate and extrapolate the yields. However, as linear interpolation is not differentiable, we recommend not to use linear interpolation for the yield estimation and yield curve fitting (Lartey & Li, 2018; Muthoni, Onyango, & Ongati, 2015). Linear interpolation also has the tendency of producing kinked yield curves (Choudhry, 2004).
Sholarin (2014), therefore, does a good work by seeking to use bootstrapping and piecewise cubic spline method to model the Nigerian zero-coupon yield curve for the CBN. However, our current work differs from Sholarin’s in many regards. The yields used for Sholarin’s work are, for instance, the primary market auction yields (Sholarin, 2014). Even though many bond markets use the primary market yields for fitting their yield curves (e.g., the Ghanaian bond market), the focus of our study is on secondary market yield curve. Lartey and Li (2019) suggest that the primary market yield curve has low frequency (compared with the secondary market yield curve), and the movements in the primary market yield curve are often localized at the short ends, while the long ends could remain unchanged for longer period of time (as long as new long-term bonds are not auctioned in the primary market). Also, the primary market yields are more often influenced by the central bank’s direct involvement in the issuing and pricing process (Mohanty, 2002).
Furthermore, the curve fitting method used by Sholarin is the piecewise cubic spline method. Again, even though the piecewise cubic spline is a popular method for yield curve modeling, it might not be suitable for all bond markets, especially the illiquid and underdeveloped ones (Lartey & Li, 2018). Because Sholarin uses the piecewise cubic spline method on Nigerian primary market yields, we are yet to establish whether or not the method would also be suitable for the Nigerian secondary market yields. Thus, as to whether or not the piecewise cubic spline method is suitable for the Nigerian secondary market bond yields, that is a question we need an answer to.
Besides the work by Sholarin (2014), to the best of our knowledge, no other work has been done to model or fit the zero-coupon yield curve for the Nigerian bond market. Anyanwu and Oruh (2011) seek to model the term structure of Nigerian Treasury Bills interest rate with the Cox, Ingersoll, and Ross (1985) model. However, this form of modeling is a dynamic modeling of interest rates through time, but not static yield curve modeling (Bolder, 2015). The focus of our work is on static kind of yield curve modeling. The other yield curve–related works done for the Nigerian bond market include Teriba (2006) who investigates the ability of the yield curve and the yield spread to predict growth in real outputs in the Nigerian economy. Oyedele (2014) also does similar work by studying the relationship between the term structure of interest rates, on one side, and economic activities and inflation rates, on the other side. Nkemka (2010) studies the use of term structure of interest rates in valuing bonds during periods of economic distortion. Ojong, Akpan, and Nneji (2015) study the applicability of the term structure of interest rate theories in Nigeria. Isiaq and Bolaji (2016) study the effects of fiscal policy on the term structure of interest rates in Nigeria. None of the above-mentioned works models the Nigerian zero-coupon yield curve for the secondary market. There is therefore a gap to be filled in literature as far as the modeling of zero-coupon yield curve for Nigerian secondary bond market is concerned.
In the work by Lartey and Li (2019), it is suggested that even though the Ghanaian secondary bond market is illiquid, underdeveloped and the yield quotation might be sporadic (AFMI, 2016), and that there is not enough bond data in the Ghanaian secondary bond market, a practically useable secondary market yield curve could be modeled for the market. The work uses the piecewise cubic Hermite method (Hermite method) to model the daily frequency secondary market zero-coupon yield curve for the government bonds traded on the e-bond trading platform of the Ghana Fixed Income Market. The study states the reason for using the Hermite method as the fact that the method is continuously differentiable once and is shape-preserving, and therefore is suitable for the Ghanaian bond market which is underdeveloped, illiquid, and has wide gaps in between data points along the yield spectrum. The study shows daily frequency yield curve which has many superiorities over the primary market yield curve.
In the work by Lartey and Li (2018), the Hermite method is compared with piecewise cubic spline method (with not-a-knot end condition), the penalized smoothing method (variable roughness penalty method or VRP method), and the Nelson–Siegel–Svensson (NSS) method, in terms of both the zero-coupon and forward yield curves. In the case of the zero-coupon (and par) yield curves, the Hermite method proves to produce very good curves which fit very well (better than the other methods). Now, the questions we want to find answers to are as follows: would the Hermite method be equally more suitable (than other methods) for the Nigerian bond market? Or would the results or performance be quite different from the Ghanaian case, considering the fact that the Nigerian bond market is more developed and more liquid than the Ghanaian bond market (even though both are more or less African frontier markets)? Would the piecewise cubic spline method be suitable for the Nigerian secondary bond market (as the Nigerian bond market is more developed than the Ghanaian bond market)? In view of the fact that the Nigerian bond market is more developed and more liquid than the Ghanaian bond market, this work seeks to test the suitability of the Hermite method for producing zero-coupon, par, and forward yield curves, relative to other methods such as the piecewise cubic spline, NSS, and VRP methods. The study also compares the modeled yield curves with the presently used YTM yield curve in the Nigerian secondary bond market.
Furthermore, Lartey and Li (2018) also identify that the Ghanaian yield curves are largely humped; and this is theoretically attributed to the fact that there is probably more demand for the short-term maturity instruments (treasury bills) and long-term maturity instruments by the money market mutual funds and life insurance companies, respectively, than there is for medium-term instruments. This article also seeks to examine the general shape of the Nigerian zero-coupon yield curve from theoretical perspective.
The rest of the article is organized as follows. Section “Method and Data” discusses the methodology and data. Section “Results and Discussion” discusses the results. Section “Conclusion” discusses conclusion and recommendation.
Method and Data
Description of Data and Data Source
As stated earlier, the Nigerian bond market is currently one of the most liquid in sub-Saharan Africa, just second to South Africa (Ajayi, 2013). However, like many other African countries, the market is mostly dominated by the central government’s securities. Figures 1 and 2 show the significant proportion of the market share taken by the Federal Government’s marketable securities (FGN bonds and treasury bills). About 66% and 28% of the total bond market shares are constituted by the FGN bonds and treasury bills, respectively. This means a total of about 94% of the active bond market is made up of the central government’s debt securities. Meanwhile, the central government’s marketable securities have been increasing in market capitalization from year to year. Figure 2 also shows that there is an increase in market capitalization of the central government’s marketable securities in 2016 (while the other debt securities do not show significant increase within same period). Figure 3 shows the increasing trend in the value of central government’s marketable debt securities capitalization.

Proportions of bond market share in 2016.
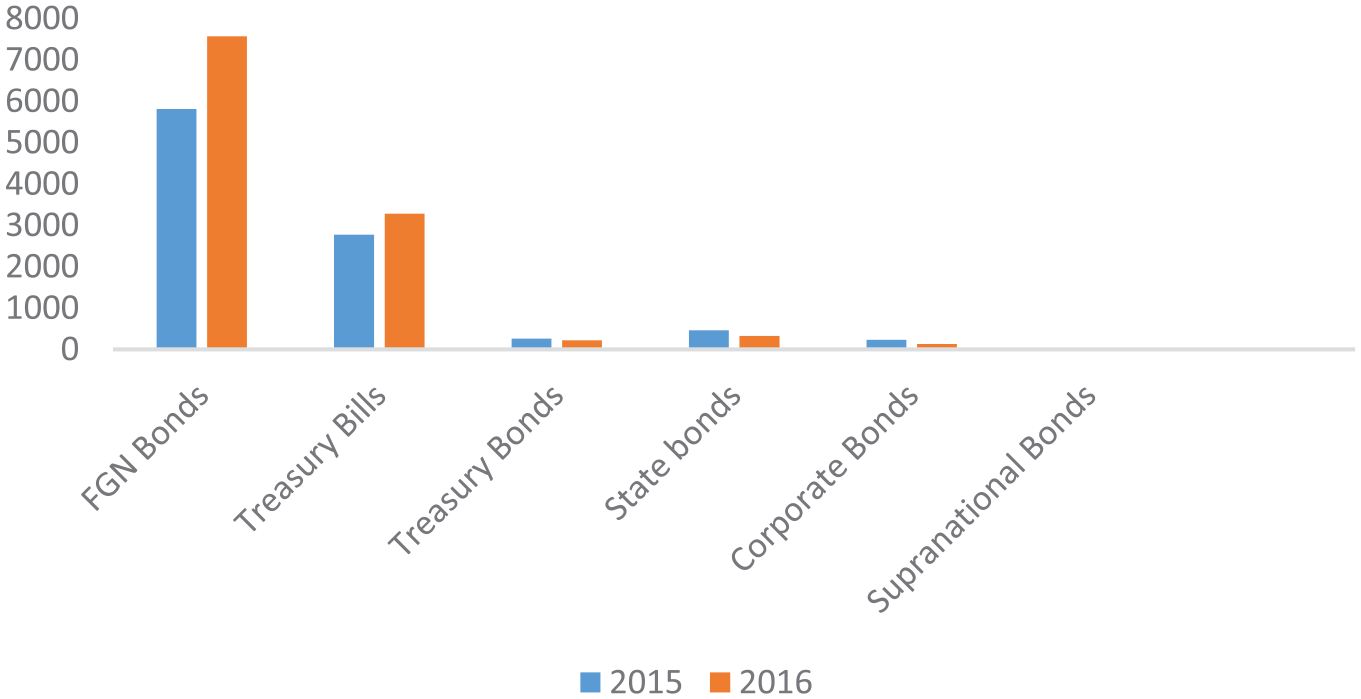
Bond market capitalizations in 2015 and 2016 (billions of naira).
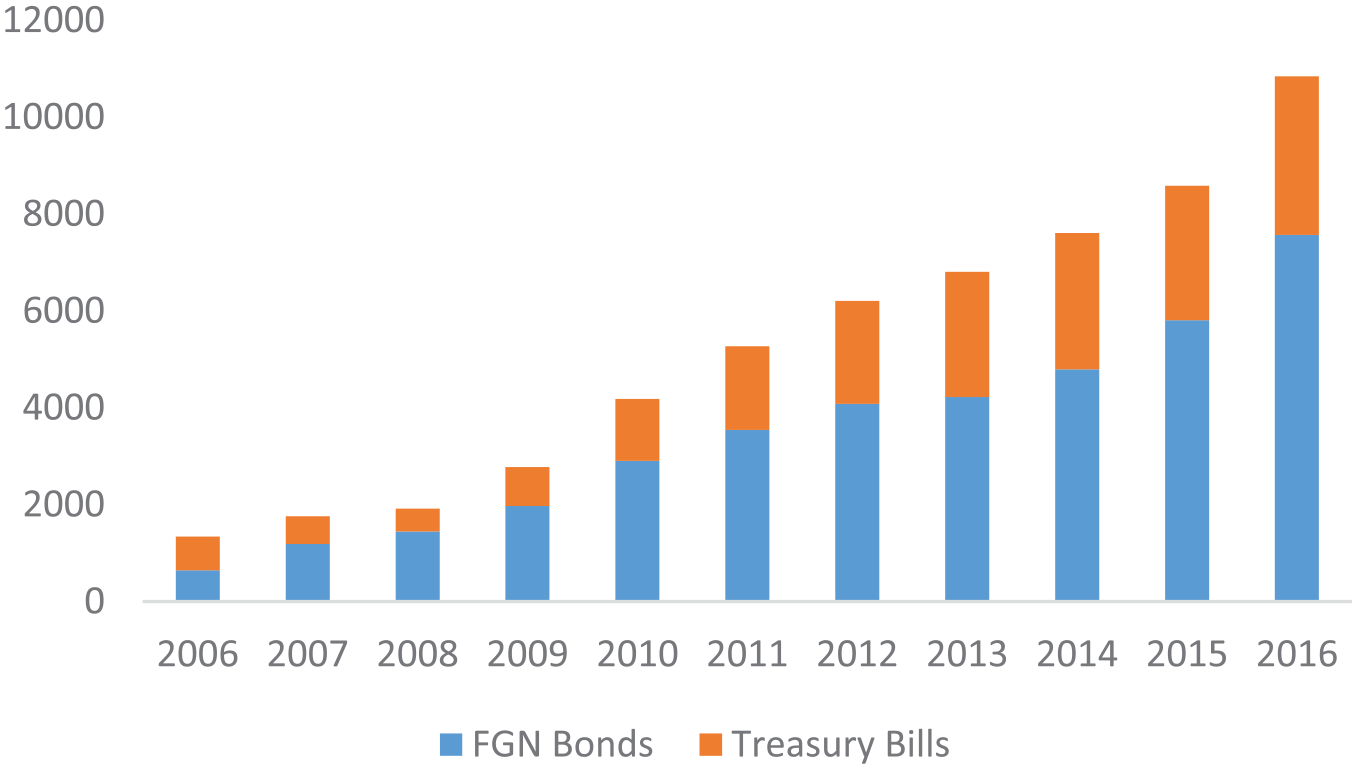
Market capitalization of FGN bonds and treasury bills (billions of naira).
Even though all Federal Government debt securities are listed on the NSE, almost all active bond trading activities in Nigeria take place on over-the-counter (OTC) platforms (African Development Bank, 2010). In 2016, for instance, the total value of secondary market trades in Nigeria amounted to 13,812.65 billion naira (about US$59,989.79 million). Out of this, the value of trade that occurred in the OTC market amounted to 13,811.85 billion naira (about US$59,986.32 million). That constituted more than 99.994% of the total or combined (exchange plus OTC) secondary market trade. The rest (less than 0.006%) occurred on the NSE. Figure 4 shows the situation for other years. The secondary market is therefore virtually made up of the OTC, as trading on the NSE is almost insignificant.

Value of secondary market trades (billions of naira).
Particularly known for providing the most active OTC platform for bond trading in Nigeria is the FMDQ OTC. Because most of the secondary market trades presently occur on the FMDQ OTC, we believe that bond data available on the FMDQ OTC market would fairly represent the overall secondary market bond data as far as the Nigerian bond market is concerned. At the end of trading on each business day, the prices and yields-to-maturity of the Federal Government bonds are made available on the website of FMDQ OTC (http://www.fmdqotc.com). We believe that the data published on the website are for the consumption of the public and can therefore be used for academic work. We, therefore, for the purpose of this work, use the Federal Government bond data made available daily on the website of FMDQ OTC. The Federal Government marketable bonds are the treasury bills (91-, 182-, and 364-day bills) and FGN bonds (3-, 5-, 7-, 10-, 15-, and 20-year bonds).
Filtration of Bond Data and Yield Extraction
We extract the YTM, zero-coupon, par, and forward yields from the bond data. Even though the FMDQ OTC provides YTM alongside the bond prices, we compute our own YTM from the bond prices and bill discount rates, using the procedure in the work by Lartey and Li (2018). We apply T + 2 to compute the YTM, in accordance with the guidelines provided by the Securities and Exchange Commission (SEC) and the CBN on securities settlement in Nigeria, which states that the settlement period in the secondary bond market is T + 2 (SEC & CBN, 2016).
Piecewise Cubic Hermite Interpolation (Hermite)
Piecewise cubic Hermite interpolation can be used for fitting a continuously differentiable curve through a discrete set of solution and derivative data (Higham, 1992). The cubic Hermite method is used for the construction of a C1 shape-preserving interpolant (Han, 2015), and the method derives sufficient conditions to ensure the resulting interpolant preserves monotonicity (Cripps & Hussain, 2012). By using this method to construct the yield curve, adjacent piecewise cubic polynomials satisfying certain constraints are smoothly joined.
Assuming we have data points
Such that
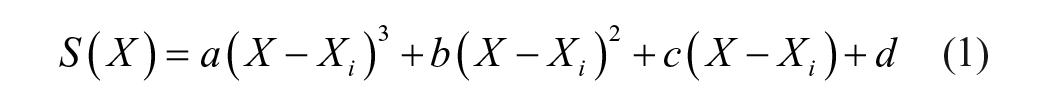
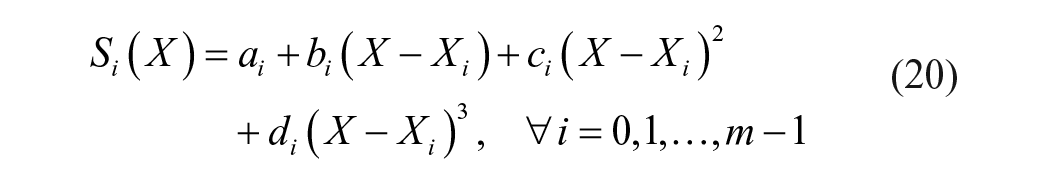
We determine a function S, such that on each subinterval (Xi, Xi + 1), S is a cubic polynomial:
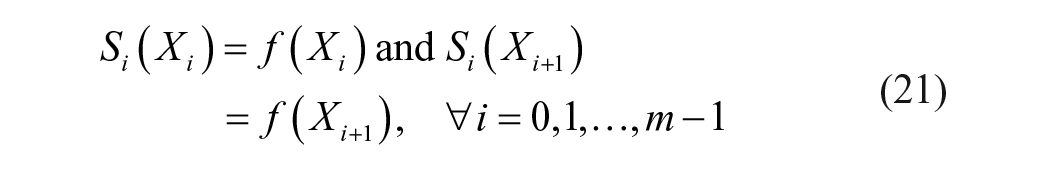
The given function f is interpolated by S, subject to the following conditions:


where N equals number of interpolating polynomials and each requires N + 1 data points. We need to satisfy total of (P + 1) (N + 1) constraints, where P is the order of derivative. In our case, we use first-order derivative (i.e., p = 1).
For each (Xi, Xi + 1), let h = Xi + 1 – Xi.
While satisfying the above constraints, we solve for the unknown coefficients of each piecewise polynomial:


Substituting Equation (4) through (7) into Equation (1), the value of each interpolating cubic polynomial S is determined. Each cubic polynomial produces a curve, and these curves join smoothly to form the entire yield curve. The interpolating function S can also be solved by expressing it in terms of the basis functions and the derivatives of the original functions:

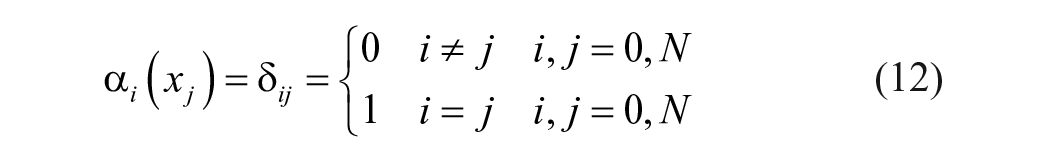
While satisfying the constraints


To satisfy

We require the following conditions:

To satisfy

We require the following conditions:


To determine the first-order derivatives of the functions, Catmull–Rom (1974) method is used for the estimation of f(1) (Xi):

At the endpoints,


Piecewise Cubic Spline Interpolation (Cubic Spline)
For the purpose of comparison, we also present the underlying computations of the cubic spline method. Piecewise cubic splines are widely used to fit a smooth continuous function through discrete data. They play an important role in such fields as computer graphics and image processing, where smooth interpolation is essential in modeling, animation, and image scaling. Interpolating cubic splines are popular for fitting data because they use low-order polynomials and have C2 continuity, a property that permits them to satisfy a desirable smoothness constraint (Wolberg & Alfy, 1999). However, that same constraint often violates another desirable property: monotonicity. On the contrary, the cubic Hermite method ensures monotonicity. While the cubic Hermite has one continuous derivative (C1), the cubic spline has two continuous derivatives (C2). Another distinguishing factor is that for cubic Hermite, the derivative needs to be specified, whereas for the cubic splines, the derivative is not specified, but enforced.
Assuming we have yield data points
Such that
The parameters


The last constraint (Equation 25) is added to impose not-a-knot conditions at both ends of the cubic spline curve. Similar to the Hermite curve, each cubic polynomial produces a curve and these curves join smoothly to form the entire yield curve. With the cubic spline, interpolated values are determined by global behavior of the curve, whereas with the cubic Hermite, interpolated values are determined by local behavior.
NSS
With the NSS method, the instantaneous forward yield curve is specified at time t, as
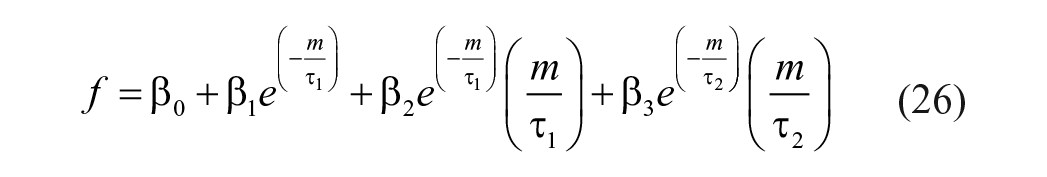
where m denotes time to maturity, and β0, β1, β2, β3, τ1 and τ2 are parameters to be estimated (BIS, 2005; Bolder & Streliski, 1999; Nelson & Siegel, 1987; Svensson, 1994). The forward yield curve is integrated to obtain the zero-coupon yield curve specified as

VRP Method
Using the penalized smoothing spline (VRP model), forward curve can be specified as

The first term is the difference between the observed price P and the predicted price P_hat (weighted by the bond’s duration, D) summed over all bonds in the data set. The second term is the penalty term; λ is a penalty function and f is the spline (Fisher, Nychka, & Zervos, 1995; The MathWorks, 2015; Waggoner, 1997).
Results and Discussion
Figures 5 to 8 show the observed (or actual) YTM curves (based on the YTM accessed on the FMDQ OTC’s website) and the modeled Hermite par and zero-coupon curves. The modeled par curves fit almost exactly into the observed YTM curve. As the par yield is nothing but the YTM of a bond which is equal to the coupon rate of the bond, the fact that the Hermite par curve fits very well into the observed YTM proves that the Hermite method produces yield curve which closely represents the reality in the market.

Hermite and observed yield curves for September 15, 2017.

Hermite and observed yield curves for October 11, 2017.

Hermite and observed yield curves for October 25, 2017.

Hermite and observed yield curves for November 6, 2017.
It is also observed that even though the Hermite zero-coupon curve also fits closely into the YTM curve, it is not as closely as the Hermite par curve does. The Hermite zero-coupon curve falls marginally below the YTM and the Hermite par curves. This could be understandable as zero-coupon yields are not exactly the same as YTM (except in the case of very short-term zero-coupon yields). Therefore, if YTM curve is relied upon as a representation of zero-coupon yield curve, mispricing of bonds (and other financial securities) could occur. In the context of our results, underpricing could occur as bonds would be priced with yields higher than the actual zero-coupon yields.
Figures 9 to 12 show the Hermite par and zero-coupon curves, the NSS zero-coupon curve, and the VRP zero-coupon curve. We have already established that the Hermite par curve is a good fit into the observed YTM curve. It is interesting to note that even though the NSS zero-coupon curve fits into both the Hermite par and zero-coupon curves (as the difference between the Hermite par and zero-coupon curves is sometimes insignificant), the NSS rather appears more closely clinched into the Hermite par than into the Hermite zero-coupon curve. The reason why the NSS appears to fit into the Hermite par very well is attributed to the fact that the NSS tends to rise above the Hermite zero-coupon curve (Lartey & Li, 2018), just as the Hermite par curve also rises above the Hermite zero-coupon curve in this study. So the two curves—NSS and Hermite par—rising above the Hermite zero-coupon curve by almost the same margin become identical. Meanwhile, the VRP tends to rise above all the other curves just as observed in the work by Lartey and Li (2018). However, the differences (or gaps) among all the curves are not very significant in this study, compared with the study by Lartey and Li (2018).

Hermite, NSS, and VRP yield curves for September 15, 2017.

Hermite, NSS, and VRP yield curves for October 11, 2017.

Hermite, NSS, and VRP yield curves for October 25, 2017.

Hermite, NSS, and VRP yield curves for November 6, 2017.
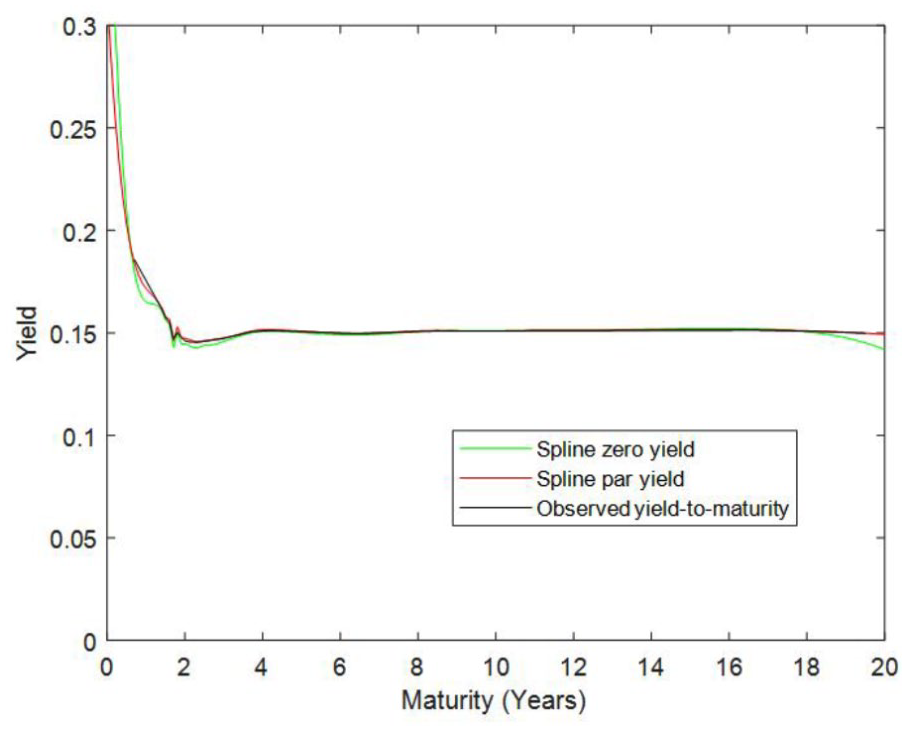
Figures 13 to 16 show the cubic spline par, cubic spline zero-coupon, and the observed YTM curves. Besides Figure 14 in which the cubic spline par and zero-coupon curves are somehow closer to the observed YTM (at the short ends), the other graphs show that the spline curves do not fit well (compared with the Hermite curves) into the YTM curves at the short ends. This is confirmed by Figures 17 to 20.
Spline and observed yield curves for September 15, 2017.
Spline and observed yield curves for October 11, 2017.

Spline and observed yield curves for October 25, 2017.

Spline and observed yield curves for November 6, 2017.

Hermite, spline, and observed yield curves for September 15, 2017.
Hermite, spline, and observed yield curves for October 11, 2017.

Hermite, spline, and observed yield curves for October 25, 2017.

Hermite, spline, and observed yield curves for November 6, 2017.
So, consistent with the work by Lartey and Li (2018), the cubic spline method is not as good as the Hermite method for fitting the yield curve (at least, for many African bond markets, including Nigeria which is believed to be the second most developed sub-Saharan African bond market). However, it is worthy to add that the cubic spline (spline) curves as produced for the Nigerian bond market are better than as produced for the Ghanaian bond market (Lartey & Li, 2018), as the Nigerian bond market is more developed and has more data than the Ghanaian bond market. This also is consistent with the assertion that the Hermite method is more suitable and highly recommendable (relative to the cubic spline), the more underdeveloped and illiquid the bond market is (Lartey & Li, 2018).
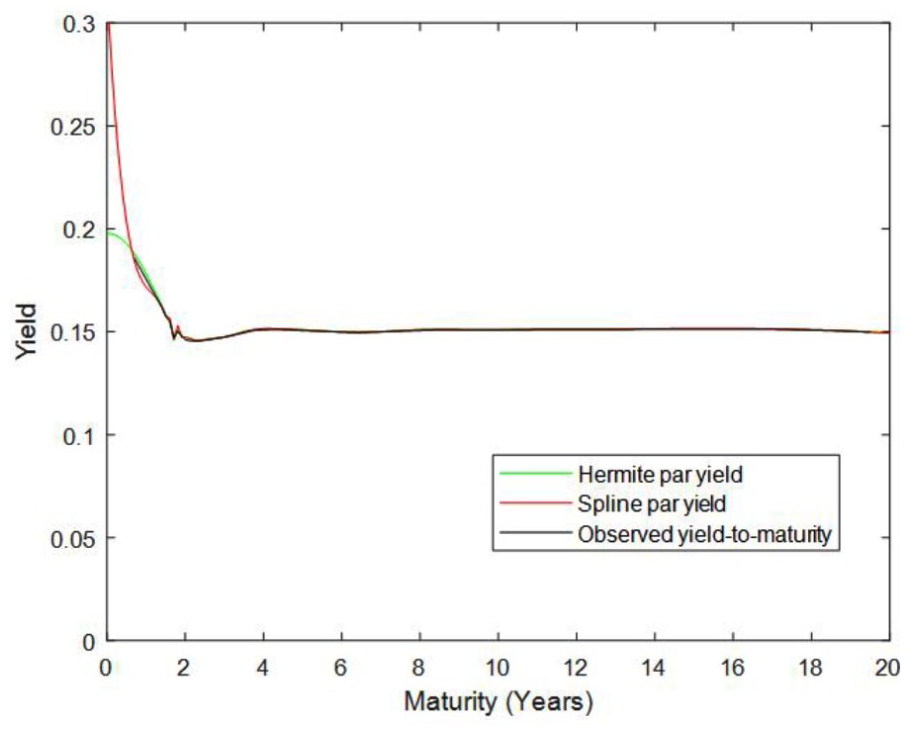
Figures 17 to 20 show the Hermite par, the spline (cubic spline) par, and the observed YTM curves. The curves show that the Hermite par fits into the YTM much better than the spline zero-coupon does.
Figure 21 shows the forward yield curves produced with various methods. Even though Hermite forward curve is not as bad as the spline forward curve (Figure 22), we think that the NSS and VRP forward curves are better than the Hermite forward curve. The NSS performs better than the Hermite method because the NSS is a parametric model and uses approximated (or optimized) yields, while minimizing the errors between the observed and estimated bond prices. On the contrary, the Hermite forces to fit into the yields extracted from the actual bond prices, hence suffering a bit of overfitting. Even though the VRP is also a spline-based method, it has produced better forward curve than the Hermite method because the VRP is penalized to prevent oscillation (Fisher et al., 1995; Waggoner, 1997).
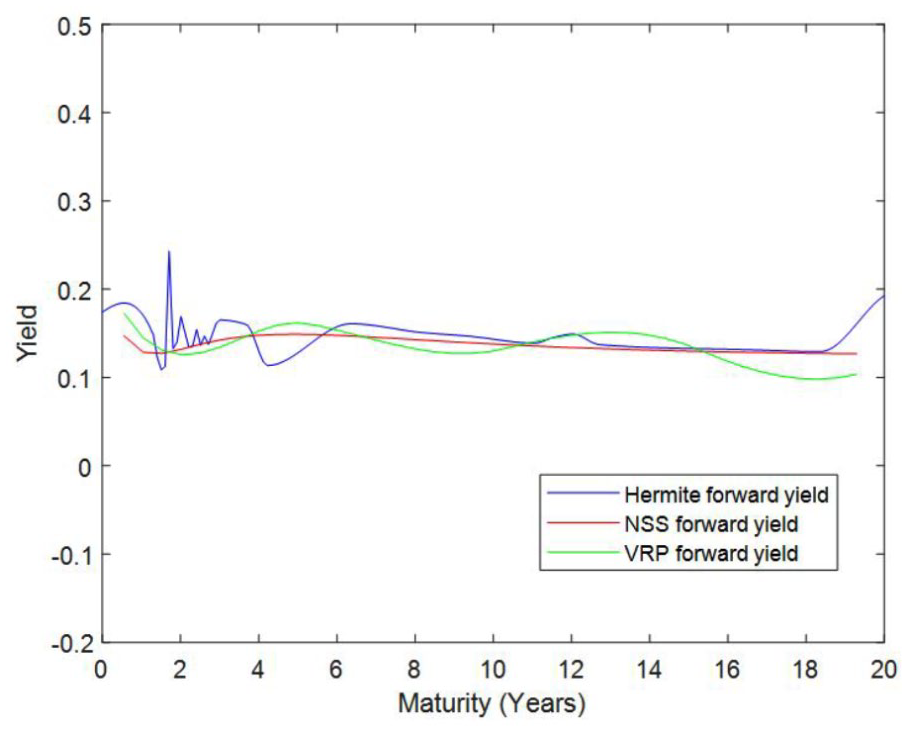
Hermite, NSS, and VRP forward curves for November 6, 2017.
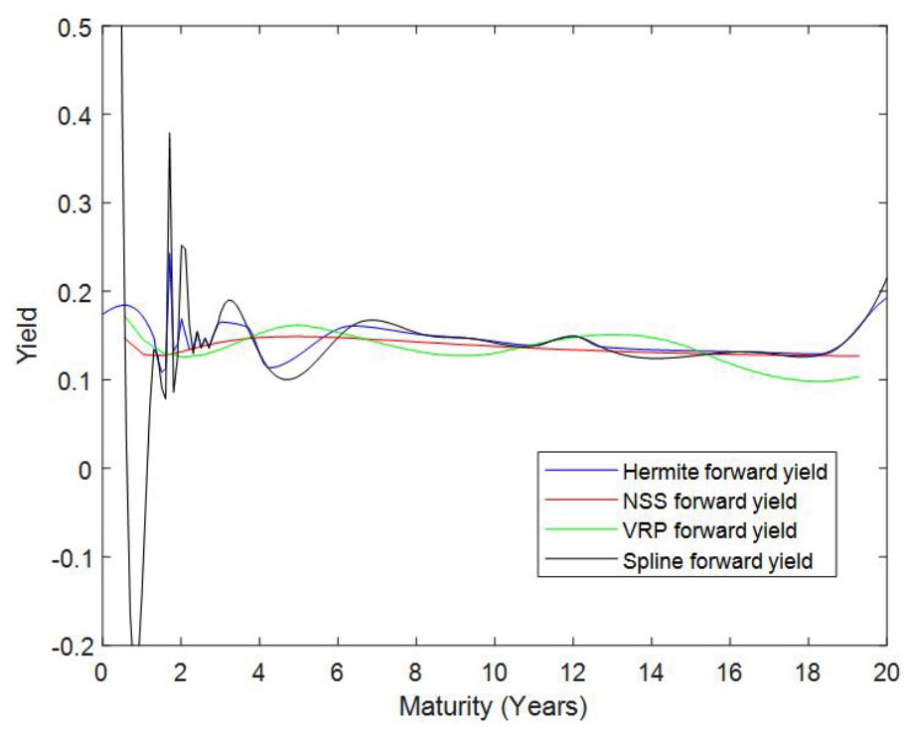
Hermite, NSS, VRP, and spline forward curves for November 6, 2017.
Therefore, although we rank the Hermite method above other methods for fitting the par and zero-coupon curves, we rank the NSS and VRP above the Hermite method for fitting the forward yield curve. This is consistent with the caution sounded by Lartey and Li (2018) on using the Hermite method for constructing the forward curve. It is advised that even though the Hermite method could be used for constructing the forward curve, it must be used carefully, and if necessary complemented or substituted with NSS. This study further suggests that even the VRP forward curve could be better than the Hermite forward curve. In any case, the Hermite method still ranks above and better than the spline method for all kinds of curves, as far as our study is concerned.
Figure 23 shows the Hermite zero-coupon curves for various dates. The changes or movements in the zero-coupon yield curves show that the curves are largely linear in nature. However, the very short ends are higher (and downward sloping) than the other segments of the curve. Theoretically, this yield curve situation could be explained as possibly due to the fact that market participants prefer investing in medium-term and long-term bonds, to investing in short-term bonds. Hence, the relatively lower demand for short-dated bonds or treasury bills (compared with longer dated bonds) has caused their (treasury bills) prices to decrease (and yields to increase). This is only a theoretical assumption as posited by the market segmentation and preferred habitat theories of the yield curve. The actual cause(s) of the Nigerian yield curve shape may require further investigation to establish the market and economic factors explaining the shape.

Hermite zero-coupon yield curves for various dates.
Conclusion
The purpose of this study was to model the Nigerian zero-coupon, par, and forward yield curves and to compare the modeled curves with the observed YTM curve. The results show that the modeled Hermite par curve fits into the observed YTM curve very well. On the contrary, the spline par curve does not fit very well into the observed YTM (compared with the way the Hermite curve does), at the short ends of the curve. This is consistent with the assertion that the Hermite method is a better choice for fitting the yield curve, compared with the spline method. The results also show that the Hermite zero-coupon curve lies marginally below the observed YTM (and the Hermite par) curves. This proves that the YTM may be used in the market to play the role of the par yield curve (because par yield is virtually YTM that is equal to coupon rate or YTM of on-the-run bonds), but cannot be used to play the role of zero-coupon yield curve. Therefore, besides the YTM (whether for on-the-run or off-the-run bonds), the market also needs a zero-coupon yield curve.
Interestingly, the NSS zero-coupon curve fits into the observed YTM (and the Hermite par) curves very well. This can be explained by the fact that the NSS zero-coupon curve usually rises above the Hermite zero-coupon curve by almost the same margin that the YTM and the Hermite par curves rise above the Hermite zero-coupon curve. So the NSS zero-coupon, Hermite par, and the YTM curves appear very similar in terms of level and shape. It is tempting to conclude that as NSS zero-coupon curve could be used as alternative to Hermite zero-coupon curve (because both are zero-coupon curves), it presupposes that the YTM could also be used as alternative to Hermite zero-coupon curve (as the NSS zero-coupon and YTM curves fit similarly). However, this cannot always be appropriate. Because, according to the results, the YTM (and Hermite par) curves are not always the same as the Hermite zero-coupon curve. Hence, we recommend that as far as zero-coupon yield curve is concerned, the Hermite method is used as it has the tendency of producing curves which can be identified as a bit distinct from par and YTM curves (compared with the NSS method).
For the forward yield curve, we do not recommend the use of the Hermite method nor the cubic spline method, as both have the tendency of producing negative yields (even though the Hermite forward curve is much better than the spline forward). We recommend the NSS method as first choice and the VRP method as second choice for producing the forward curves. This recommendation is also relevant and applicable to less developed bond markets, as spline-based methods generally have the tendency of producing diverging and less realistic forward curves (Choudhry, 2004; Lartey & Li, 2018). As indicated, even though the VRP is also a spline-based method, the roughness penalty imposed on it restricts it from producing negative forward yields.
Generally, the performance of the cubic spline method, with regard to the Nigerian secondary bond market, is the worst (compared with the other methods), just as in the case of the Ghanaian bond market (Lartey & Li, 2018). However, the performance of the spline method with regard to the Nigerian bond market is much better than with regard to the Ghanaian bond market (Lartey & Li, 2018), as the Nigerian bond market is much more developed and liquid and has more secondary market bond data than the Ghanaian bond market.
The Nigerian zero-coupon yield curves are mostly linear at the medium- and long-term segments, with the short-term segments having decreasing slope (but higher than the short- and long-term segments). According to the segmented market and preferred habitat theories, more market participants prefer to invest in medium and long-term bonds (relative to investing in short-term bonds).
Limitation of the Study and Recommendation for Future Research
This work considers only the not-a-knot type of piecewise cubic spline method, even though there are other types such as the natural cubic spline and the clamp cubic spline. The dissimilarity among these types lies in the boundary conditions only. All other conditions are the same, so the difference would not have significant effect on the conclusion of the study. We recommend that similar study is done for other African bond markets.
Footnotes
Data Availability
The authors are willing to share their data in Excel format with those who wish to replicate the results of this study.
Declaration of Conflicting Interests
The author(s) declared no potential conflicts of interest with respect to the research, authorship, and/or publication of this article.
Funding
The author(s) disclosed receipt of the following financial support for the research, authorship, and/or publication of this article: The research and publication of this article was financed by Center for West African Studies, University of Electronic Science and Technonogy of China.