
Abstract
The study is on performance measurement in academia. It aims at developing and validating the measurement scale for the performance of higher institutions. The items were developed based on the extant literature. Data were collected via an online survey in which a questionnaire link was sent to 269 vice chancellors/presidents of the sampled universities. A total of 133 responses were retrieved at the end of the data collection period. This study used proportionate random sampling for sample selection. The goodness of measures was checked via field experts, academicians, and data analysis with SPSS. Overall, the alpha coefficient was .974. The outcome of exploratory factor analysis (EFA) exposed all factors loaded more than 0.50. The results revealed that the instrument was reliable and valid. Hence, the instrument developed was suitable to be used in examining the performance of higher institutions.
Introduction
Performance measurement is fundamental to all organizations, academia inclusive, where government and other stakeholders are given more concern to the performance of higher institutions across different countries. Some of them have been experimenting with market-type mechanisms to force their institutions to compete via outstanding performance for both students and funding through fees and a research grant (Dill & Soo, 2004). Furthermore, government flow grant to institutions where performance manifested, with good research output and high placement in ranking (Altbach & Balan, 2007). Institutions with high performance get more income than lesser performing institutions, which would provide performers with a competitive edge that would stimulate less performing institutions (Herbst, 2007).
However, the point of contention is a general-accepted performance measures scale in universities and other higher institutions of learning. Stakeholders are left with university ranking in accessing performance in the academic cycle as accreditation agencies are becoming out of passion. It is beyond doubt that university rankings have become a significant part of the tertiary education landscape around the globe (Marmolejo, 2015). Indeed, a scientific and general performance measures are required in academia to serve as indicators for justification to the stakeholders that will guide decision-making process.
Research has been conducted on organizational performance and a number of performance measures have been developed (e.g., Kaplan & Norton, 2005; Lebas & Euske, 2006). Some are based on financial measures (e.g., Kamyabi & Devi, 2012; Liao & Wu, 2009) and nonfinancial indicators (e.g., Gronum, Verreynne, & Kastelle, 2012; Hilman & Mohamed, 2011; Kaplan & Norton, 2005; Kirby, 2005) and others are based on the combination of both financial and nonfinancial measures (e.g., Bititci, Carrie, & McDevitt, 1997; Kaplan & Norton, 2005; MacDougall & Pike, 2003). These indicators are developed to serve profit-oriented organization, which could not be appropriate to be applied to organizations in the academia where teaching, community service, research, and publications are the main business.
Few studies were also done in the area of higher institution performance measurement, with quite a number focusing on research and teaching indicators (e.g., Asif & Searcy, 2014; Badri & Abdulla, 2004; Cave, Hanney, Kogan, & Trevett, 1988; Lukman, Krajnc, & Glavič, 2010). Other studies made emphasis on income generated from research projects and consultancies (e.g., Asif, Raouf, & Searcy, 2013; Asif & Searcy, 2014; Kells, 1992; Nedwek & Neal, 1994), and some studied focused on students and other stakeholder satisfaction (e.g., Asif & Raouf, 2013; Asif & Searcy, 2014; Education Criteria for Performance Excellence [ECPE], 2011; Houston, 2007; Kells, 1992; Nedwek & Neal, 1994), little attention has been given to academic indicators such as academic reputations, employability of graduate, faculty ratio, Nobel prize and fields medals.
These form part of the most important measurement indicators of universities and higher institutions of learning. For example, Quacquarelli Symonds (QS) World University Rankings did focus on academic reputations; employability of graduate; faculty ratio; and internationalizations in measuring the performance of universities across the globe. In addition, Academic Ranking of World Universities (ARWU) have quality of faculty informs of research that attract Nobel prize and fields medals as indicators for measuring performance of universities in their world ranking.
Therefore, there is a need to develop a more comprehensive measurement scale that will fit the general unique context of higher institutions. Based on the above discussions, the main purpose of this study was to develop and validate a more generous performance measurement scale for universities and other higher institutions of learning.
Literature Review
Organizational Performance
Performance is considered as an important construct in achieving the goals of any organizational activities. Some see performance as synonymous with success (Olusola, 2011) and another see it as goal-directed activities (Godlovitch, 1993). Although some people see it as accomplishment of a given task measured against preset-known standards of accuracy, completeness, cost, and speed (Bierbusse & Siesfeld, 1997), a number of persons relate performance to effectiveness, efficiency, and productivity in ideal exploitation of resources (Berry, Sweeting, & Goto, 2006; Gleason, Mathur, & Mathur, 2000; Hilman & Abubakar, 2017; Tukamuhabwa, Eyaa, & Friday, 2011). Furthermore, Martinelli (2001) defined performance as a measure of the state of an organization or the outcomes that result from management decisions and the execution of those decisions by employees of the organization.
Looking at it from the result of the management process, Mandy (2009) viewed performance as the outcome of adopting effective management process. The study posited that performance can be measured using some criteria; which includes effectiveness, efficiency, growth, and productivity.
Greenberg (2011) has the view that performance is a set of financial and nonfinancial indicators, which offer data on the level of accomplishment of objectives and results. Similarly, Hilman and Abubakar (2017) and Kamyabi and Devi (2012) emphasized on the financial indicators and defined performance as the firm’s financial capability such as increase in sales, investment, and profit.
The universal agreement among scholars on how organizational performance should be defined is yet to be a reality (Ford & Schellenberg, 1982; Johannessen, Olaisen, & Olsen, 1999). However, Antony and Bhattacharyya (2010) defined the organizational performance as the measure that is used to evaluate and assess the success of an organization to create and deliver the value to its external as well as internal customers. Armstrong and Baron (2002) viewed organizational performance as a strategic and an all-embracing technique to deliver consistent performance to organizations by improving upon the performance of staffs through team spirit and individual contributions.
Equally important, some scholars defined organizational performance as organizations’ ability to achieve organizational goals and objectives (Daft, 2001; Georgopoulos & Tannenbaum, 1957; Wade & Recardo, 2001). In the same way, Yuchtman and Seashore (1967) characterized organizations’ performance as its capacity to exploit its environment for accessing and utilizing the limited resources.
In a broader form as chief executives and business, managers started to comprehend that the success of organizations depends on their ability to attain their main objectives with the minimum of resources within a short period of time. Along these lines, organizational theories supported the idea of accomplishing the desired goals with efficiency and effectiveness on the constraints imposed by the limited resources (Lusthaus & Adrien, 1998). Still, the most standard contention is the definition that incorporates information on the measures of performance as the set of financial and nonfinancial indicators that give information on the level of accomplishment of goals and results (Kaplan & Norton, 2005; Lebas & Euske, 2006).
Financial measures consider organizational assets, budgets, sales volume, revenue growths, or profitability results as variables for measuring performance in organizations (Liao & Wu, 2009), whereas nonfinancial measures consider variables as a competitive advantage, innovation, quality result, improvement trends, among others (Kirby, 2005; Murphy & Cleveland, 1995).
However, it is virtually impossible to provide a generic list of measures, which can be applied to all type of organization (Small & Chen, 1995). Therefore, financial indicators are applied in some situations (Bhimani, 1994) whereas nonfinancial indicators are incorporated in other situations (Abernethy & Lillis, 1995; Westra, Srikanth, & Kane, 1996). Nonfinancial indicators are superior measures in evaluating the firms’ performances on competitive advantages (Gronum et al., 2012; Hilman, 2009; Hilman & Abubakar, 2017; Hilman & Mohamed, 2011; Kaplan & Norton, 2005) and the third category is a situation where both financial and nonfinancial measures are put to use (Bititci et al., 1997; Kaplan & Norton, 2005; MacDougall & Pike, 2003). The management strategic goal of each organization should reflect the choice of a measurement criterion (Ward, Duray, Leong, & Sum, 1995).
In this study, performance is viewed at the level of institution, university performance in particular, which is been described to be measured in terms of improvement trends and academic achievement results (Kirby, 2005; Liao & Wu, 2009; Murphy & Cleveland, 1995; Richard, Devinney, Yip, & Johnson, 2009). In line with this, the following subsection discusses performance measures in universities.
Performance Measures in Universities
Universities nowadays are subject to similar pressures of the marketplace. Significant modifications in the competition have made colleges and universities adopt the thought process of a corporate business to the extent that students are currently being treated as customers (Hilman & Abubakar, 2017; Zwain, Teong, & Othman, 2012). Moreover, the stakeholder demands are getting more and more complex, which must be attended to whether the educational organization must keep up its competitive advantage (Zwain et al., 2012).
The universities must ensure and provide the students with high-quality service. They have an obligation of producing graduates who can suit the developing societal difficulties, for example, graduates producing high-quality profile and competence in their respective profession (Suryadi, 2007).
Hazelkorn (2015) stated most of higher education institutions used peer review and accreditation as their performance assessment. However, the outcomes of these instruments were really difficult to understand by layperson and this leads to break down in trust among stakeholders (Hilman & Abubakar, 2017).
Previously, quality improvement practices were used by several higher education institutions as a yardstick (Widrick, Mergen, & Grant, 2002). There were some mixed opinions about performance measurement where some scholars said performance evaluation must consider student’s related academic achievement only, meanwhile some scholars said it is important to measure student’s-related academic achievement and nonstudents-related academic achievement (Ball & Wilkinson, 1994; Higgins, 1989; Hilman & Abubakar, 2017; Johnes & Taylor, 1990).
Student’s-related academic attainment contains student academic status, classes of degree, and graduation rates as indicators for assessing university performance (Ball & Wilkinson, 1994; Higgins, 1989; Hilman & Abubakar, 2017). Johnes and Taylor (1990) said undergraduate’s wastage rate should be considered for assessing university performance.
In addition, Agha (2007), Lee and Buckthorpe (2008), Sall (2003), and Asif et al. (2013) emphasized on undergraduate’s wastage rate and dropout whereas Asif and Raouf (2013), Kells and Mundial (1992), and Pinilla and Munoz (2005) extended that graduation rate as a variable for assessing university performance.
Hilman and Abubakar (2017) stated that nonstudent’s-related academic achievement consists of having competitive positions, innovation, organizational agility, sustainability, and market share (Deem, 2008; Suryadi, 2007; Wei, Choy, & Yew, 2009).
In another development, other research has made emphases in teaching and research as indicators for measuring performance in academia (Asif et al., 2013; Asif & Searcy, 2014; Badri & Abdulla, 2004; Cave et al., 1988; ECPE, 2011; Lukman et al., 2010; Manjarrés-Henríquez, Gutiérrez-Gracia, Carrión-García, & Vega-Jurado, 2009; Nedwek & Neal, 1994). Other research provides community service as performance indicator in academia (Badri & Abdulla, 2004; ECPE, 2011; Nedwek & Neal, 1994). Patel et al. (2011) identified number of publications, number of citations, impact factor, research funding, degree of co-authorship, and h index as common research performance indicators. Some made emphasis on financial performance with respect to the income generated from research projects and consultancies (Asif et al., 2013; Asif & Searcy, 2014; Kells, 1992; Nedwek & Neal, 1994).
New league tables and national university rankings are some of the famous tools established to determine university performance that pushes competitions in the global higher education (Hilman & Abubakar, 2017).
QS World University Rankings (2016), Times Higher Education World University Ranking (2016), ARWU (2016), and Ranking Web of Universities (Webometrics; 2016) are the famous ranking bodies that assess global university performance and ranks university accordingly (Altbach, 2013; Hilman & Abubakar, 2017).
In line with the prior discussion, the measurement indicators provided by the femurs university ranking bodies with few others seems appropriate to the peculiar context of higher institutions. Even so, similarities exist in the said measures of these ranking bodies (Aguillo, Bar-Ilan, Levene, & Ortega, 2010) but another shortcoming of the individual ranking methodology also does (Altbach, 2012). Therefore, these measurements are foundation for further improvement, which this study adapted, analyzed, synthesized, and made some improvement with empirical validation.
Data and Methodology
Procedure and Participant
First of all, 14 items of measurement were developed based on the extant literature, which was subjected to the process of face validity through expert assessment (Green, Tull, & Albaum, 1988) to ascertain the extent to which the items are measuring the construct it supposed to measure.
To achieve the objective of this research, a quantitative approach was adopted with the population of 891 top universities that make the list of QS Ranking 2015. Out of which 269 were selected as sample using sample table of Krejcie and Morgan (1970). Proportionate random sampling techniques was utilized for better representation of the population and the institutions serve as a unit of analysis.
The selected universities are chosen for this study because they are the most performing universities in the world. By extension, the chief executives have the experience, capabilities, and strategies for achieving higher performance. Therefore, their sights on the performance evaluation will aid in coming up with a standard measurement instrument for academia. Table 1 illustrated the sampling of this study.
Sampling.

Note. QS = Quacquarelli Symonds.
Instrumentation and Measurement
The developed measurement items were used in designing a structured questionnaire for this study that consists of close-ended multiple-choice questions with 5-point Likert-type scale. The survey contains two sections, the first one consists of statements about the respondents of the study and the second section consists of statement on the items of performance measures.
The design questionnaire was send via an online survey as the main option for the researcher due to the peculiar nature of the research and is best suited when data are to be obtained from widely dispersed geographical locations on a large scale as in this case using structured questions, at a reasonable cost (Sekaran, 2006). With the aid of a Goggle Form online survey, the online questionnaire was sent to the email address of the chief executive of the universities that make the sample of this study.
Two months was set and used for the data collection, and a reasonable number of the respondents responded within the stipulated time. However, the researchers made a double follow-up with the respondents online within the stipulated time frame at a different interval, emphasizing the need and important of their responses to the realization of the objective of this study. The researchers equally notify the respondents in the follow-up mails the reason for their selection in the survey resulting from their outstanding performance and competence that merit them to be on top list of World University ranking as a motivation.
For the analysis, in addition to the face validity mention above, normality assumptions were also diagnosed as well as construct validity through exploratory factor analysis (EFA) with Varimax rotation and reliability analysis to empirically validate the measurement items.
Results and Discussion
Response Rate and Respondents’ Profile
Out of the 269 questionnaires sent, 133 responses were retrieved from the Google Form response sheet of the questionnaire at the end of the data collection period. This forms a response rate of 49.44% and is above the expected rate of response as it falls slightly above the common response rate for the online survey. For instance, Ballantyne (2003) recorded 47%, Dommeyer, Baum, Chapman, and Hanna (2002) got 43%, and Baruch (1999) has 39.6% among others in their online survey. Moreover, a response rate of 30% is considered acceptable for a survey (Abubakar & Ahmed, 2017; Hair, Black, Babin, Andersen, & Tatham, 2010; Sekaran, 2003).
The descriptive analysis tells that majority of the chief executive/management staff of the top universities are male 67.7% and followed by 32.3% of female. 87.2% of the respondents are above 50 years and 12.8% have their age range between 41 and 50 years. This provides assurance that grown-up, knowledgeable, and experienced qualities form the majority of the respondents.
In addition, 12.8% of the respondents are the vice chancellors/presidents, 55.6% are deputy vice chancellors/deputy presidents, and 31.6% are other management staff. It can be evidently seen that the responses are from the right people who have sufficient understanding and valid information regarding the research topic.
In addition, in terms of location, 2.3% of the respondents are from African universities, 10.5% from Asia, 48.1% from Europe, 27.8% from North America, 1.5% Oceania, and 9.8% from South America. This shows a fear representation of the universities from different region/continent in more or less their proportion in the QS ranking 2015 as design from the sampling techniques.
For the universities’ years of existence, the majority of the universities with 66.2% are in existence for more than 80 years, 27.1% have their years of existence range between 61 and 80 years, only 6.8% falls in the range of 41 and 60 years, and none of the universities are below 40 years. This implies that the sampled universities are full of experience and are in the best position to get useful and desired information on the issues and challenges of university performance.
Similarly, for the university ranking, 13.5% are from the top first 100 universities, 21.1% have their placement range between 101 and 300, 20.3% range between 301 and 500, 24.1% range between 501 and 700, and again 21.1% of the sampled universities ranked 700+. This has shown a fair representation of the universities from the top up, top middle, and top down of the ranking. This implies that their responses may help in coming up with good performance measures in the academia.
Considering the above information, it could be summarized that the respondents who participated in the survey have the capacity and are in better position to provide adequate and relevant information that will assist in addressing the set objectives of the study. Table 2 provides profile summary of the respondents.
Summary of Respondents Profile.

Note. VC = vice chancellors; DVC = deputy vice chancellors.
Goodness of Measures
Face and content validity
All the items of the survey were given to five experts from the academic who are familiar with the construct—university performance—to valid the face validity. The experts were two professors, two associate professors, and a senior lecturer. The same instruments were distributed to another five professionals who are on universality leadership positions in very high-ranked universities. They include two vice chancellors, two deputy vice chancellors, and a director academic planning and quality assurances. This process makes some questions/items were reworded/rephrased and two dropped to measure the appropriate construct—performance and also to be reasonable to the potential respondents. The final statement design to measure performance in academia is delineated in Table 3 based on academic reputations, employability of graduate, faculty/student ratio, research output, internationalization, Nobel prizes and field medals, research grant, abundant resources, infrastructures and facilities, and community service (Figure 1).
Measurement Scale.
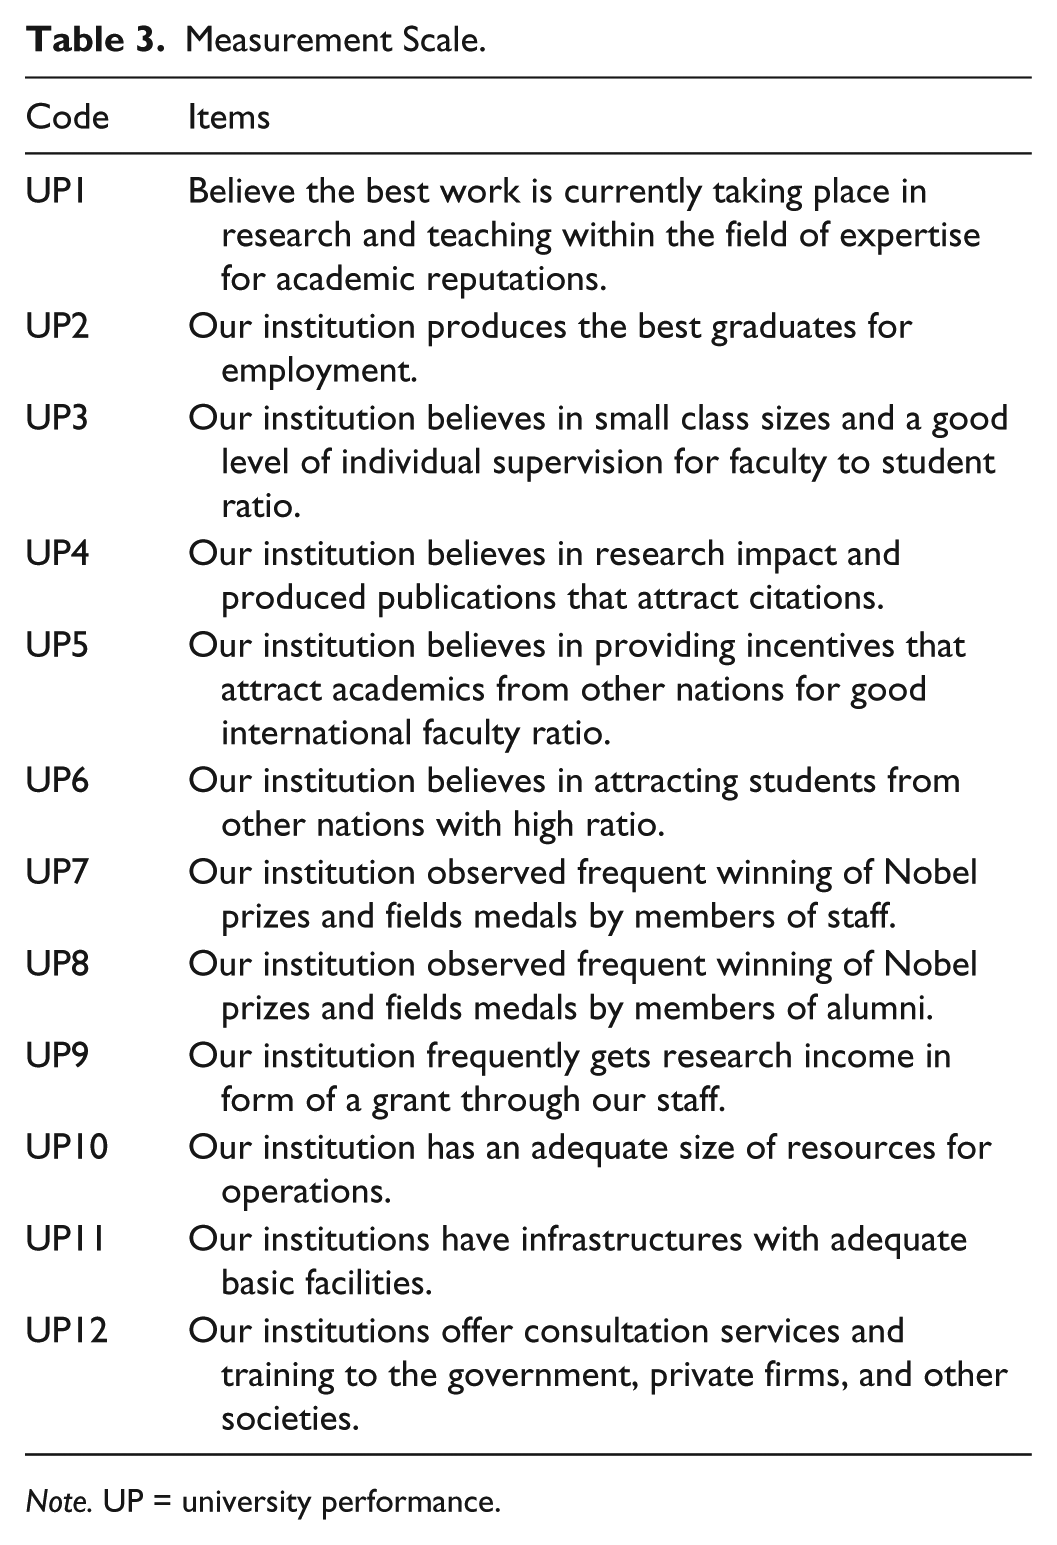
Note. UP = university performance.

Performance Indicators and Measurement Scale.
Construct Validity
The construct validity of the performance measures is determined through EFA with varimax rotation (Kaliappen & Hilman, 2013). Therefore, Kaiser–Meyer–Olkin (KMO) test and Bartlett’s test of sphericity determined the sampling adequacy. The sample was sufficient due to the KMO value above 0.7 (Table 4) with a significant Bartlett’s test.
Result of Factor Analysis and Reliability.
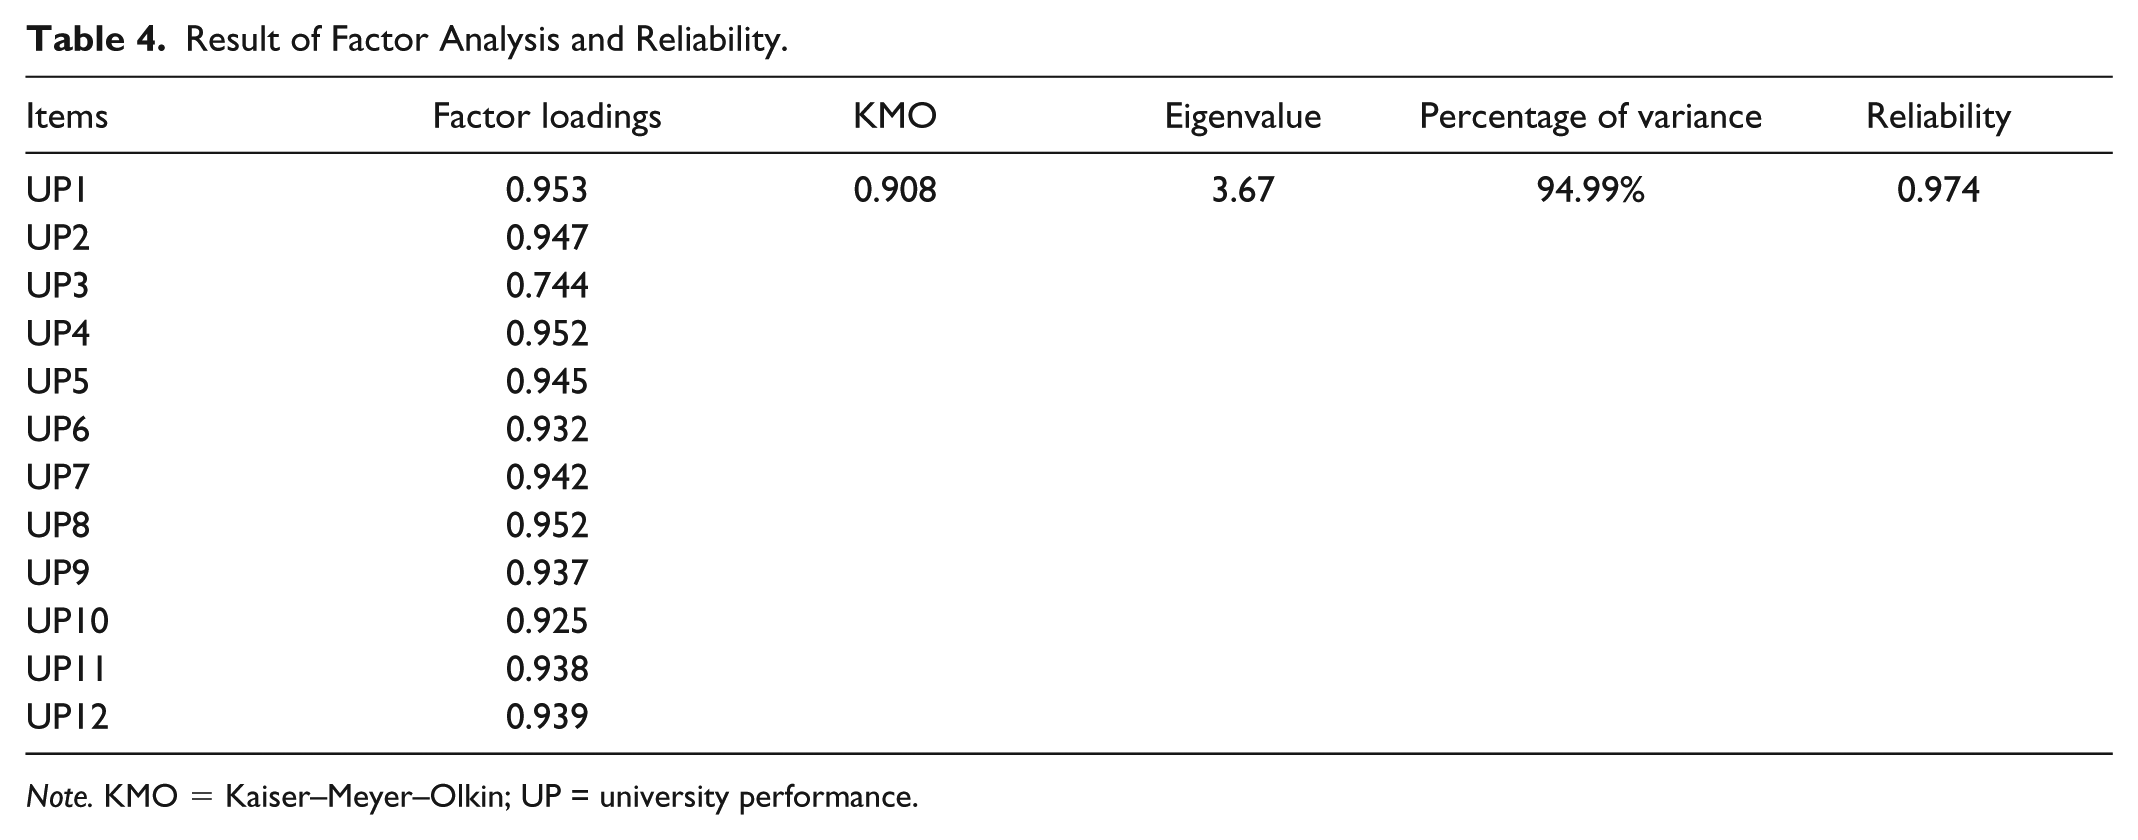
Note. KMO = Kaiser–Meyer–Olkin; UP = university performance.
In addition, the principal component analysis (PCA) method was applied to the 12 items and resulted the extraction of components were greater than 0.5. The eigenvalues were over 3, so all retained (Kaliappen & Hilman, 2013).
All the items were loaded more than the acceptable loading factor with Hair, Black, Babin, Anderson, and Tatham (2006) minimum recommended a level of 0.5. Therefore, no items were deleted. The outcome displayed sampling adequacy and the suitability of the factor model (Abubakar & Hilman, 2017).
Reliability Analysis
The measurement scale reliability of the constructs was investigated through the Cronbach’s alpha coefficient and factor loadings. Even though, there is a lot deliberation regarding the best technique to calculate reliability, the Cronbach’s alpha coefficient is the universal technique used (Hair et al., 2010; Sekaran & Bougie, 2010).
For this study, the construct has excellent reliability with Cronbach’s alpha above .90 (Hair et al., 2010). Consequently, all items are retained and the result of factor analysis and reliability shown in Table 4.
Discussions and Conclusion
Evidence reported in this study has shown that the measurement scale has high reliability and assesses a single construct of performance measures in academia. The empirical validation was done with the views of the chief executives of the top university in the QS ranking 2015 on the measurement scale due to their wealth of knowledge and experience in academia.
The good validity and reliability of the measurement scale imply that the instruments are fit in measuring performance in higher institutions of learning taking their peculiarities into cognizance. In a nutshell, this study has empirically validated the instrument for measuring performance in academia. Consequently, this article recognized an empirically valid and reliable instrument to measure performance in academia, which will facilitate more future studies in the context of performance in higher institutions.
The results of factor analysis showed the KMO value of 0.908 and Bartlett’s test of sphericity was significant. The eigenvalue was greater than 1 and factor loadings were exceeding of 0.5 for all the items (Kaliappen & Hilman, 2013). In addition, reliability test revealed that the items possess an alpha value of .974. Therefore, the new tools have proved to be good indicators for measuring performance of universities.
University stakeholders need to adopt the new measurement scale for determining the performance of a university or higher institutions for learning. The application will provide an insight on the present level of universities’ academic reputations, employability of graduate, faculty/student ratio, research output, internationalization, Nobel prizes and field medals, research grant, abundant resources, infrastructures and facilities, and community service, thereby, creating bases for comparison and condition for better improvement.
The limitation to this article is that the data used in the analysis were limited to the chief executive’s (vice chancellors/presidents) perception of the top universities in the QS ranking. Hence, future research should consider using same measurement scale with the addition of the view of some key people from supervising ministries.
Footnotes
Authors’ Note
Narentheren Kaliappen is now affiliated with School of International Studies, Universiti Utara Malaysia, 06010 Sintok, Kedah, Malaysia.
Declaration of Conflicting Interests
The author(s) declared no potential conflicts of interest with respect to the research, authorship, and/or publication of this article.
Funding
The author(s) received no financial support for the research, authorship, and/or publication of this article.