
Abstract
The global Mastering of a Music City report in 2015 notes that the concept of music cities has penetrated the global political vernacular because it delivers “significant economic, employment, cultural and social benefits.” This article highlights that no empirical study has combined all these values and offers a relevant and comprehensive definition of a music city. Drawing on industry research,1 the article assesses how mathematical flowcharts, such as Algorithm A (Economics), Algorithm B (Four T’s creative index), and Algorithm C (Heritage), have contributed to the definition of a music city. Taking Melbourne as a case study, it illustrates how Algorithms A and B are used as disputed evidence about whether the city is touted as Australia’s music capital. The article connects the three algorithms to an academic framework from musicology, urban studies, cultural economics, and sociology, and proposes a benchmark Algorithm D (Music Cities definition), which offers a more holistic assessment of music activity in any urban context. The article concludes by arguing that Algorithm D offers a much-needed definition of what comprises a music city because it builds on the popular political economy focus and includes the social importance of space and cultural practices.
Keywords
Introduction
As more people move into urban areas, by 2050 more than 70% of the world’s population will live in cities (Footer, 2015). Cities are important drivers of economic and cultural growth based on knowledge-driven ecosystems. As incubators of creativity and the burgeoning cultural industries, cities attract the human capital of the music industry (Florida, 2002, 2012). An illustrative case of this is Melbourne, which is not only the capital of Victoria but also branded as the music capital of Australia (Melbourne confirmed as live music capital, 2013, Baker, 2014). With a population of more than 4.5 million, Melbourne is currently the second largest city in Australia after Sydney. By 2051, Melbourne is predicted to be Australia’s most populated city (Savage, 2014). This article highlights that Melbourne’s music branding is primarily examined by applying a mathematical flowchart of economic algorithms, which is “a step-by-step procedure of calculations” (Solórzano, 2014, p. 1) used to define the value of music activity in an urban context. Algorithm A (Economics) is associated with uncovering the financial impact of the music industry across revenue profits, employment figures, audience participation, and the number of music venues. However, as this article highlights, Algorithm A, other algorithms such as Algorithm B (Four T’s creative index) and Algorithm C (Heritage), used to assess music activity in urban areas, are associated with limitations, and therefore paint a half picture about the “music cities paradigm” (Baker, 2016, p. 334). To complete this analysis, the article is divided into three sections. The first section examines the three existing algorithms (A-C) and assesses their contributions to the definition of a music city. The second section is a case study of how using Algorithms A and B as an assessment tool to assess Melbourne’s music capital status generates disputed claims. The final section proposes a benchmark Algorithm D to assess music activity in the urban context and offers a comprehensive definition of a music city.
Algorithms to Assess Music Cities
Algorithm A (Economics)
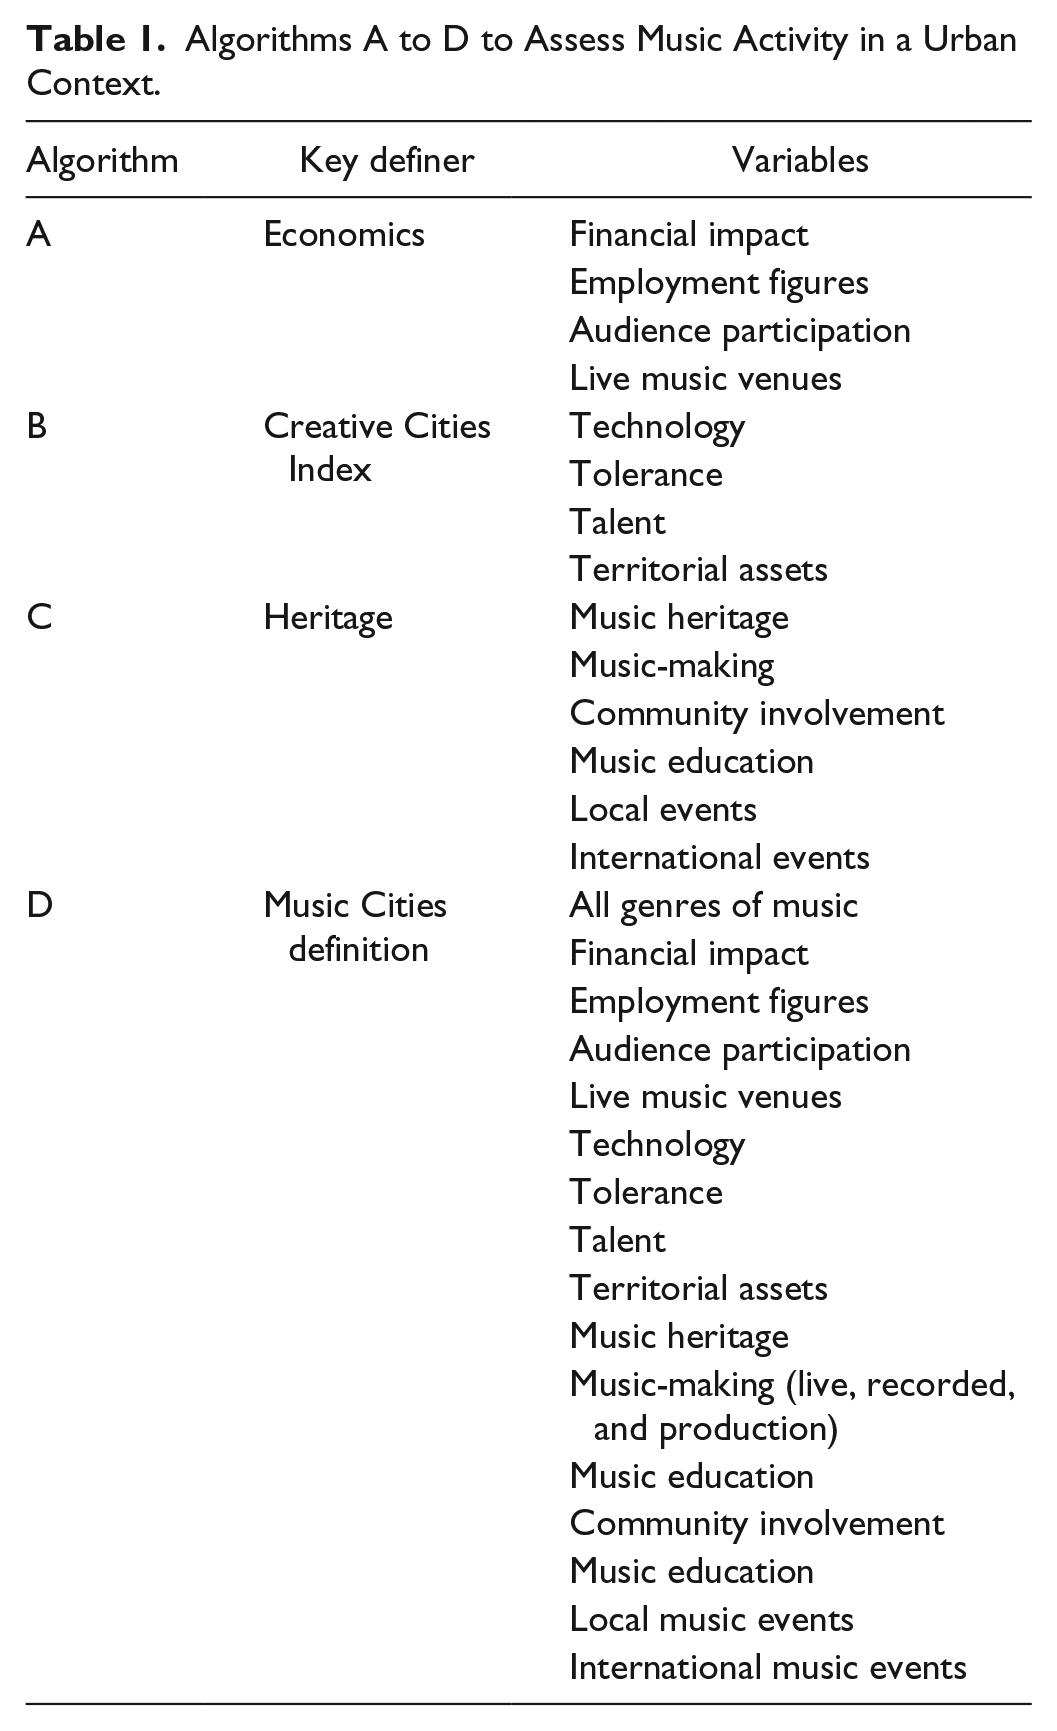
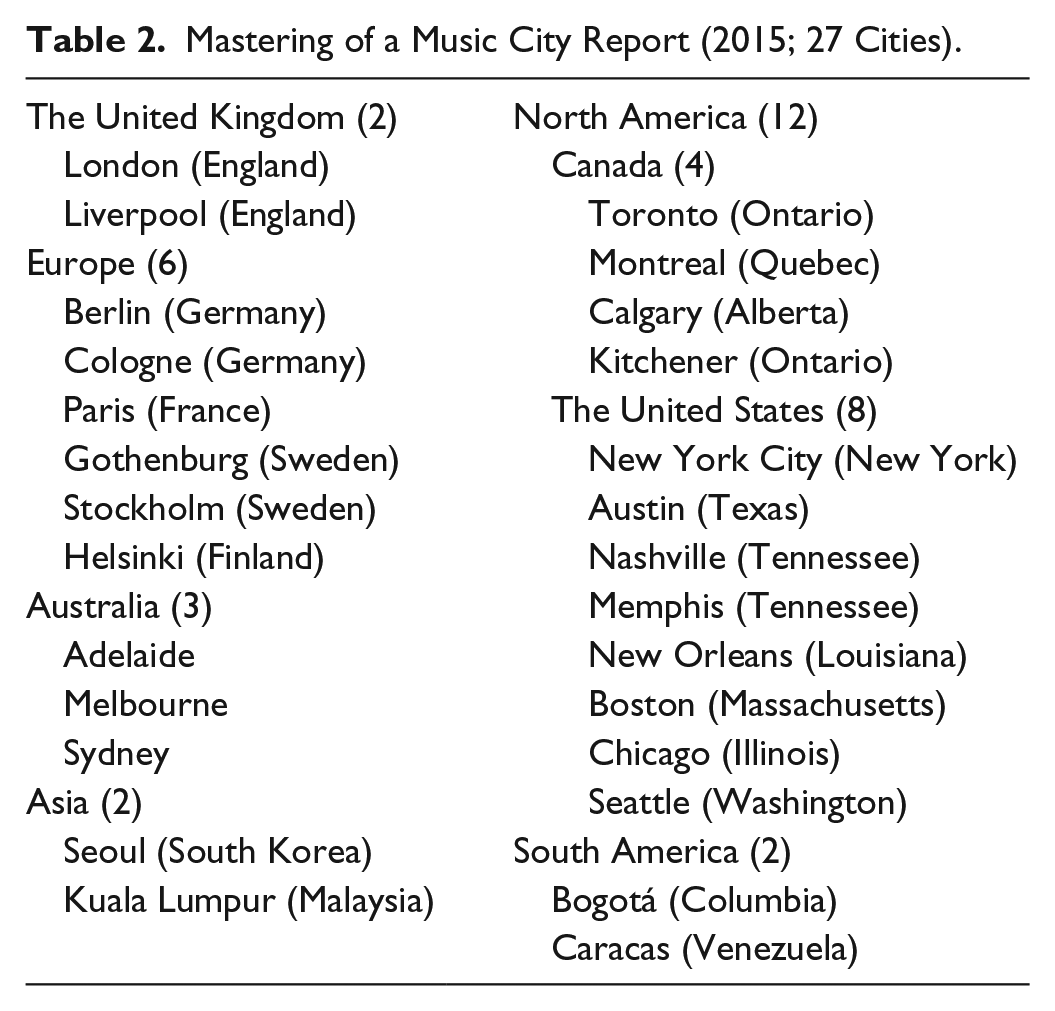
Algorithm A (Economics) is the current definer of music cities (Table 1). As the 2015 Mastering of a Music City report (Table 2), which examines twenty-seven “recognized music cities,” suggests, “a music city” is defined as an urban area with a “vibrant music economy” (Terrill, Hogarth, Clement, & Francis, 2015, p. 5). There has been a significant amount of published academic work by economists about the cost associated with the music industry such as concert tickets, production costs, and digital downloads and streaming (Cameron, 2016). However, Algorithm A, based on four key variables (financial revenue, employment, audience participation, and the number of music venues), remains the denominator to define music cities. In the case of Melbourne, industry reports such as the 2011 Economic, Social and Cultural Contribution of Venue-Based Live Music in Victoria (also known as the Deloitte Report 2 ) and the 2012 Victorian Music Census (Newton, 2012) argue that Melbourne is the live music capital of Australia for two main reasons: first, because Melbourne has more live music venues (465) than any other city in Australia, and second, because Victoria generates more than Aus$1.04 billion in revenue annually. This is similar to the music revenue (US$1.06 billion) of Austin, the capital of Texas, in the United States which is the self-proclaimed “Live Music Capital of the World” (Rowling, 2015, p. 5). In 1991, Austin adopted this music branding because the city had more live venues per capita (approximately 250) than any other city in the United States (Terrill et al., 2015; Baker, 2014).
Algorithms A to D to Assess Music Activity in a Urban Context.
Mastering of a Music City Report (2015; 27 Cities).
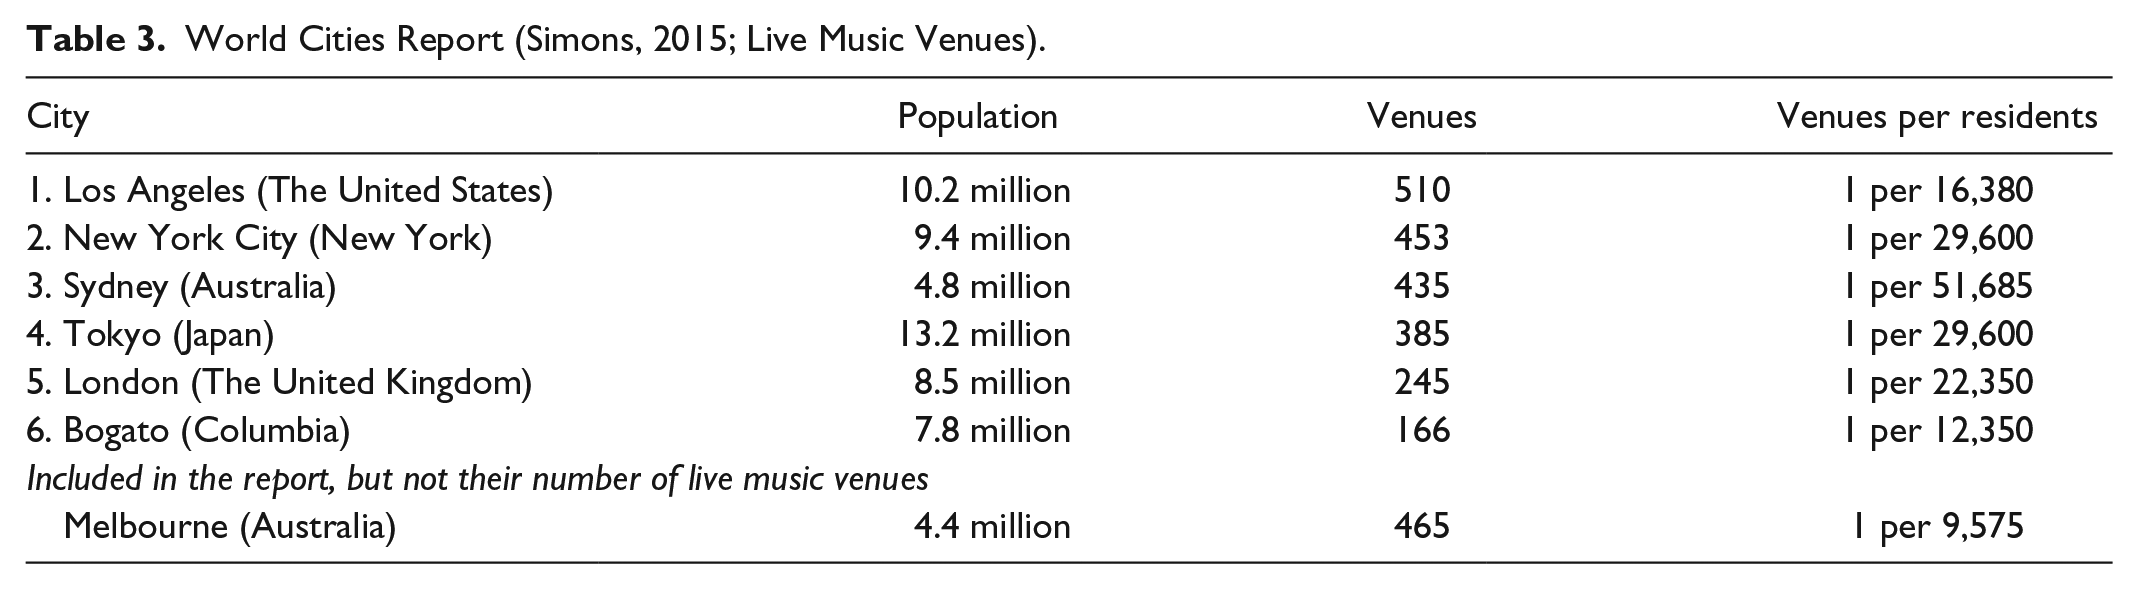
The live music venue variable associated with Algorithm A is also noted in the 2015 World Cities Cultural Report (Table 3), which was first commissioned by the then Major of London, Johnson, in 2012 and conducted again in 2013 (Johnston, 2012, 2013). The world report examines thirty-one global cities, 3 and Melbourne and Austin were included for the first time (Table 3; Simons, 2015). This report contends that Los Angeles (510) had the most live music venues, followed by New York City (453), Sydney (435), Tokyo (385), London (245), then Bogato (166) (Simons, 2015). These statistics support music scholars Connell and Gibson’s (2003, p. 29) contention that the “authenticity” and “credibility” of music scenes are heavily linked to a “live music” culture. As these scholars argue, if a city has a vibrant live music culture, then local musicians will base themselves there and have a “home field advantage” in the “glocalisation” of music (Connell & Gibson, 2003, p. 14).
World Cities Report (Simons, 2015; Live Music Venues).
The 2015 World Cities Cultural Report also highlights two points in relation to music cities. First, the report’s statistics support U.S. musicologist Lewis’s (cited in Garrett & Oja, 2011) view that the traditional location of the global music industry is “a Euro-American construct” (p.692) and largely based in the “superstar music cities” (Florida, 2015, p. 1) of New York City, Los Angeles, and London. Urban economist Florida concurs with Lewis by contending that these three cities can claim superstar status not only because of their abundant facilities and financial impact but because of their musical histories, nonstop music events, and cultural, economic, and business power and influence in the global industry.
Second, while the 2015 World Cities Cultural Report offers much-needed comparable figures about music activity across different cities, its findings contradict other industry studies. For example, in regard to the Australian music scene, the world report contends that Sydney has more live music venues than Melbourne. This differs from local reports, such as the Deloitte Report (Economic, Social and Cultural Contribution of Venue-Based Live Music in Victoria, 2011) and Victorian Live Music Census (Newton, 2012), which say that Melbourne has more live music venues (465) than Sydney (431). The world report also did not include Austin, the Live Music Capital of the World, in its live music venues table. However, as noted, Austin has more than 250 live music venues, which is higher than London (245) and Bogato (166), cited in the world report (Simons, 2015). Contradictory findings like this about music cities research are an issue that United Kingdom (UK). music entrepreneur Elbourne expanded on during his biannual Global Music Cities conventions (Table 4), 4 which began in May 2015. As Elbourne (2013) previously noted, it is “difficult to gain a clear picture of the music industry both here and around the world due to a lack of comparable facts and figures” (p. 15).
Music Cities Convention, 2015 (26 Cities).

Limitations
Limitations associated with using Algorithm A to assess music in an urban context are associated with two factors: (a) music definitions and (b) narrow focus on economics. First, the term music has definitions irregularities and diverse cultural practices (Cook & Eversit, 1999; Hesmondhalgh & Negus, 2002). For example, the local reports about music cities such as Melbourne (Economic, Social and Cultural Contribution of Venue-Based Live Music in Victoria, 2011; Newton, 2012) or the global circuit (Terrill et al., 2015) focus on commercial, popular live music and the nighttime economy. Admittedly, the early years of music studies were dominated by easily defined genres such as classical, followed by jazz and then rock. However, with newer urban music genres, such as hip hop, techno, electronic, dance, and world music, music definitions began to blur within the daytime and nighttime economies (Hesmondhalgh & Negus, 2002). As a result, today there are “many conflicting meanings clustered” around the terms “music” and “culture.”
The academy and the industry have long challenged the cultural distinction between music and nonmusic, live music and recorded music (Hesmondhalgh & Negus, 2002). These incomplete definitions reduce music to “reductive and stereotypical representation” and narratives (Cohen, 2007, p. 53) associated with cities’ musical sounds. It also feeds into the “commercially constructed strategic essentialism of place” (Connell & Gibson, 2003, p. 112, cited in Cohen, 2007, p. 54). These incomplete definitions also reflect the need for empirical research which encapsulates all genres of music, from live and recorded, from classical to pop within the urban context. For example, the City of Melbourne’s Music Strategy (2014-2017) offers a broad and inclusive definition of music because it includes
any live or recorded musical performance by a singer, instrumentalist, group, Disc Jockey (D.J), busker or street performer, which takes place in a traditional venue such as a bar, pub, theater, restaurant or club or in a non-traditional venue such as a warehouse, shop, car park or other outdoor public space. (Leppert & Doyle, 2014, p. 10)
This article acknowledges that it is often impossible for any report examining a music landscape to identify all genres of music, but studies that do offer a more holistic picture of the “music city paradigm” (Baker, 2016, p. 334). As Cohen (2007) notes, the relationship between a city and music is “not deterministic,” “organic,” or “homological” (p. 68). DeNora (2000) expands on Cohen’s point by noting that music is “a way of happening . . . over time and in particular ways” (p. 158).
Second, studies about the economic impact of music cities have overshadowed its social–cultural impact, which, academics (Homan, 2014; Shaw & Porter, 2009) argue, requires critical attention because it offers a wider perspective on the dynamics of consumption and production. As urban sociologist Pratt (2009) contends, the “culturalisation” linkage to “economization,” while “endemic in late capitalism,” is limiting because it is linked to a narrow approach (p. 4). Cultural economists Hutter and Throsby (2008) concur with Pratt, by arguing that the cultural turn in the economization of the arts has reflected that there is a cultural value beyond a price tag. Another cultural economist Jackson (2009) builds on these claims by noting that an economic focus on cultural activity offers a narrow concept of cultural power and authority and fails to offer an evolutionary or historical view of the world.
In the case of Melbourne, branding the city as a music capital of Australia has mainly been based on purely economic values. However, this approach has failed to account for the social and cultural impact of urbanization such as high-density living, residential development, local planning, and regulation and licensing laws (Homan, 2014; Shaw & Porter, 2009, Lucas, 2015a). As scholars (Hutter & Throsby, 2008, Throsby & Zednik, 2010, Jackson, 2009; Pratt, 2009) contend, the focus on the economization of culture has resulted in the failure to draw on more holistic, social and cultural interpretative fields of qualitative investigation. Throsby (2010, cited in Petrova, 2011, p. 237) who is known for navigating “between neoclassical economics and the perspective of political economy” expands on this point by noting that cultural economics needs to be “flexible, open minded and receptive to the intellectual influence of other disciplines in the social sciences and humanities.” Throsby (2010, cited in Petrova, 2011, p. 238) highlights that in recent years, “cultural policy has broadened its scope” to include concepts such as the creative city, which the next section details.
Algorithm B (Four T’s Creative Index)
Algorithm B is associated with what urban economist Florida calls the four T’s index of a creative city, which includes variables such as technology, talent, tolerance, and territorial assets. Florida (2002) argues that the four T’s are indicators of a city that are welcoming to the creative class such as those from the music industry. In his 2002 groundbreaking book, The Rise of the Creative Class, Florida argues that branding your city a creative music hub generates income from tourism dollars, which stimulates the local economy and urban development. With concerns to the first T in the index, technology, Florida argues that it fuels an entrepreneurial culture, which sustains the information society. Today, the music link to Internet technology is critical. The second T in the index, Talent, is an ingredient based on educated, skilled, and creative occupations, which can reflect a music population. The third T in the index, tolerance, is less tangible to measure and is linked to lifestyle choices and based on a live and let live motto. To address criticism that Florida’s work fails to address issues of class, race, and geography (Timberg, 2015) ), in the 2012 edition of Rise of the Creative Class–Revisited Florida added a fourth T, territorial assets, which examines the quality and attractiveness of a city.
Data mining government statistical reports and occupation indexes in relation to the first, three T’s (technology, tolerance, and talent) in 2002 Florida claimed that over one third of the U.S. population were members of the creative class. Derived from this research, Florida argues that Austin, the self-proclaimed, Live Music Capital of the World, is also the U.S. poster child of his three T’s Creative Cities Index. However, Austin was barely a blip on the global music radar until the South by South West (SXSW, Inc.) music conference began in 1987, which has now evolved into the prestigious, influential, and largest global music event. In 2012, Austin still ranked highly in Florida’s revised Creative Cities Index. As the first ever Austin Music Census, a Data Driven Assessment of Austin’s Commercial Music Economy, published on June 1, 2015, noted, “Austin has [long been] been a leader among cities in presenting itself as a music city” (Rowling, 2015, p.5). After visiting Austin and attending the SXSW, Inc., music festival in 2011, Music Victoria’s chief executive officer, Patrick Donovan (2011), a former music journalist with the Melbourne-based masthead, The Age newspaper, proclaimed that “Melbourne is the Austin of the Southern Hemisphere” (p. 2). However, Melbourne is not mentioned in Florida’s four T’s creative index, but his final T (territorial assets) aligns with The Economist’s Intelligence Unit’s (EIU) Liveability Survey of 140 cities, 5 where Melbourne has earned the EIU title as the most livable city in the world since 2010 (Lucas, 2015b; Nikakis, 2013). Culture within the EIU ranking criteria is broadly defined and also includes a city’s “arts [educational] and cultural infrastructure,” which is “often regarded as a significant reason for its status” (Homan, 2014, p. 151).
Limitations
Limitations of Algorithm B are associated with the failure to acknowledge the wider social–cultural context. As Pratt (2009) contends, Florida’s creative class analysis of partly focusing on occupation fails to capture the social reproduction of labor and knowledge in the cultural industries. He argues that Florida’s conceptualization and definition of creative occupation are narrow and unclear. In response to Florida’s work, Pratt (2009) develops a statistical framework that defines the breadth and depth of cultural practices known as “cultural mapping” (p. 7). This mapping exercise focuses on the industry as a whole, rather than occupation, which is a focus of Florida’s work. Pratt’s cultural mapping is a similar approach to what is used by United Nations Educational, Scientific and Cultural Organization’s (UNESCO) Creative Cities Network 6 in their accreditation process of labeling Cities of Music, as the next section reflects.
Algorithm C (Heritage)
Algorithm C (Heritage) is tied UNESCO’s City of Music accreditation process, a process which first began in 2006. For a city to be awarded this UNESCO music title, it needs to illustrate six variables, the most obvious variable being music heritage, along with five other variables such as excellent background in music-making, education, community involvement, regular high-profile local music events, and international music events. In 2015, there were 12 UNESCO Cities of Music, and over half of them are in Europe and the UK such as Liverpool, which was awarded the status in 2014 (Table 5).
UNESCO Cities of Music (2006-2015; 12 Cities).
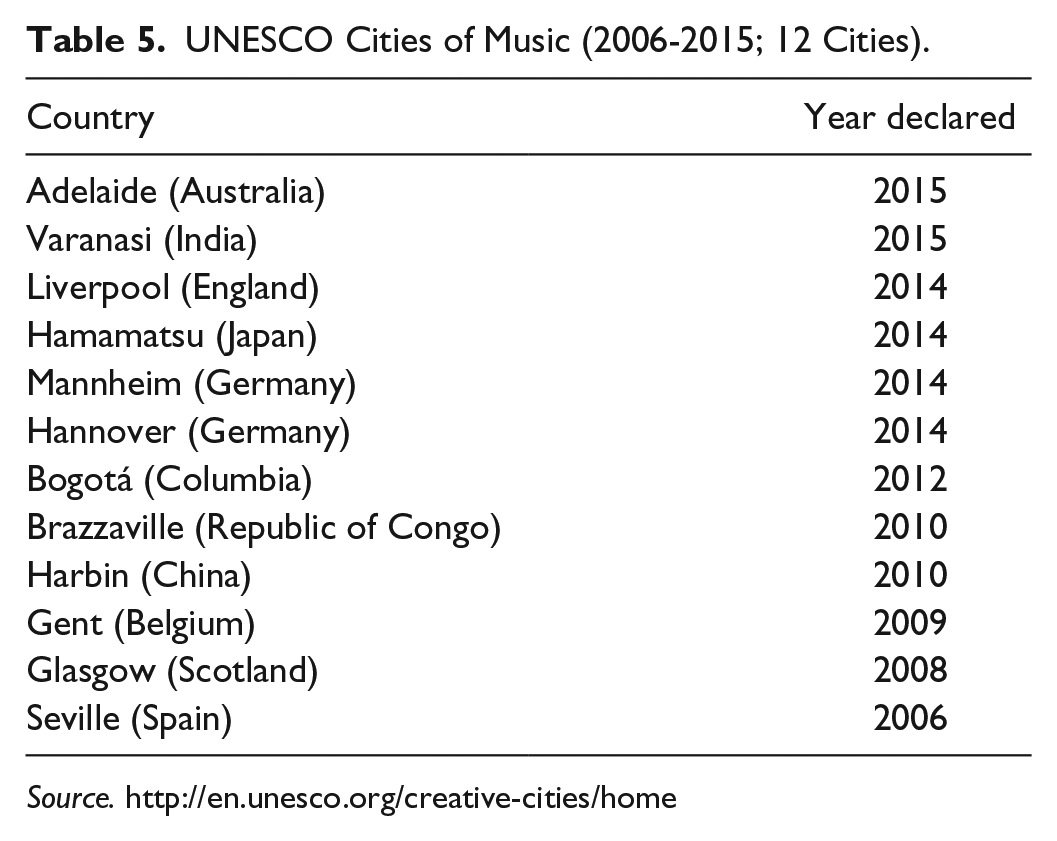
As the birthplace of the 1960s pop group, The Beatles’ musical heritage of Liverpool in the United Kingdom was used as the backbone to the city’s UNESCO City of Music successful accreditation. Liverpool promotes The Beatles’ music as their local culture harnessing and mobilizing it as a local resource (Cohen, 2007). In 2015, the Liverpool music tourism board reported that The Beatles’ legacy contributed about £82 million the local economy (“The Beatles Add £82 Million a Year to Liverpool Economy,” 2016). These figures reflect that The Beatles’ music is an expression of the city’s soul (Cohen, 2007) because their music played a role “in the production of individual, collective and local identify” of Liverpool (Cohen, 2007, p. 38). This local music identity is ironic, given the success of the band was first in Hamburg (Germany) and then in London in the U.K (Cohen, 2007). However, as U.K musicologist Cohen (2007) contends, Liverpool is seen as the “fifth Beatle” because the band’s “haunting presence” (p. 168) helped to “re-image the city”; “categorising” “claiming,” and “promoting” their music as the city’s “local culture” (p. 5).
Limitations
Limitations of algorithm C are associated with the fact that the UNESCO’s City of Music accreditation process does not allow dual rankings. For example, based on its music heritage alone, an argument could be made that Melbourne fulfills the UNESCO Music City status. However, in 2008, Melbourne was designated the second city after Edinburgh to secure a UNESCO City of Literature ranking. Therefore, Melbourne is unable to apply for the music cities title. This ruling signifies an artificial divide as there are “many conflicting meanings clustered” around the term “culture” and “music” (Hesmondhalgh & Negus, 2002, p. 2). As anthropologists and ethnomusicologists (Cook & Eversit, 1999; Carter 2002) note, music is not a distinct activity from other cultural practices. For example, music is also often intertwined with literature such as songwriting. One only has to look at how American singer–songwriter and 1960s folk legend Bob Dylan “won the 2016 Nobel Prize for Literature, marking the first time the prestigious award has been bestowed upon someone primarily seen as a musician” (Lane, 2016)). This UNESCO singular ruling has also meant that another city, Adelaide (South Australia), even though its music heritage is deemed less significant than Melbourne’s, was able to secure a UNESCO City of Music title in mid-December 2015 (Fedorowytsch, 2015).
Examining Melbourne, the Music Capital Using Algorithms A and B
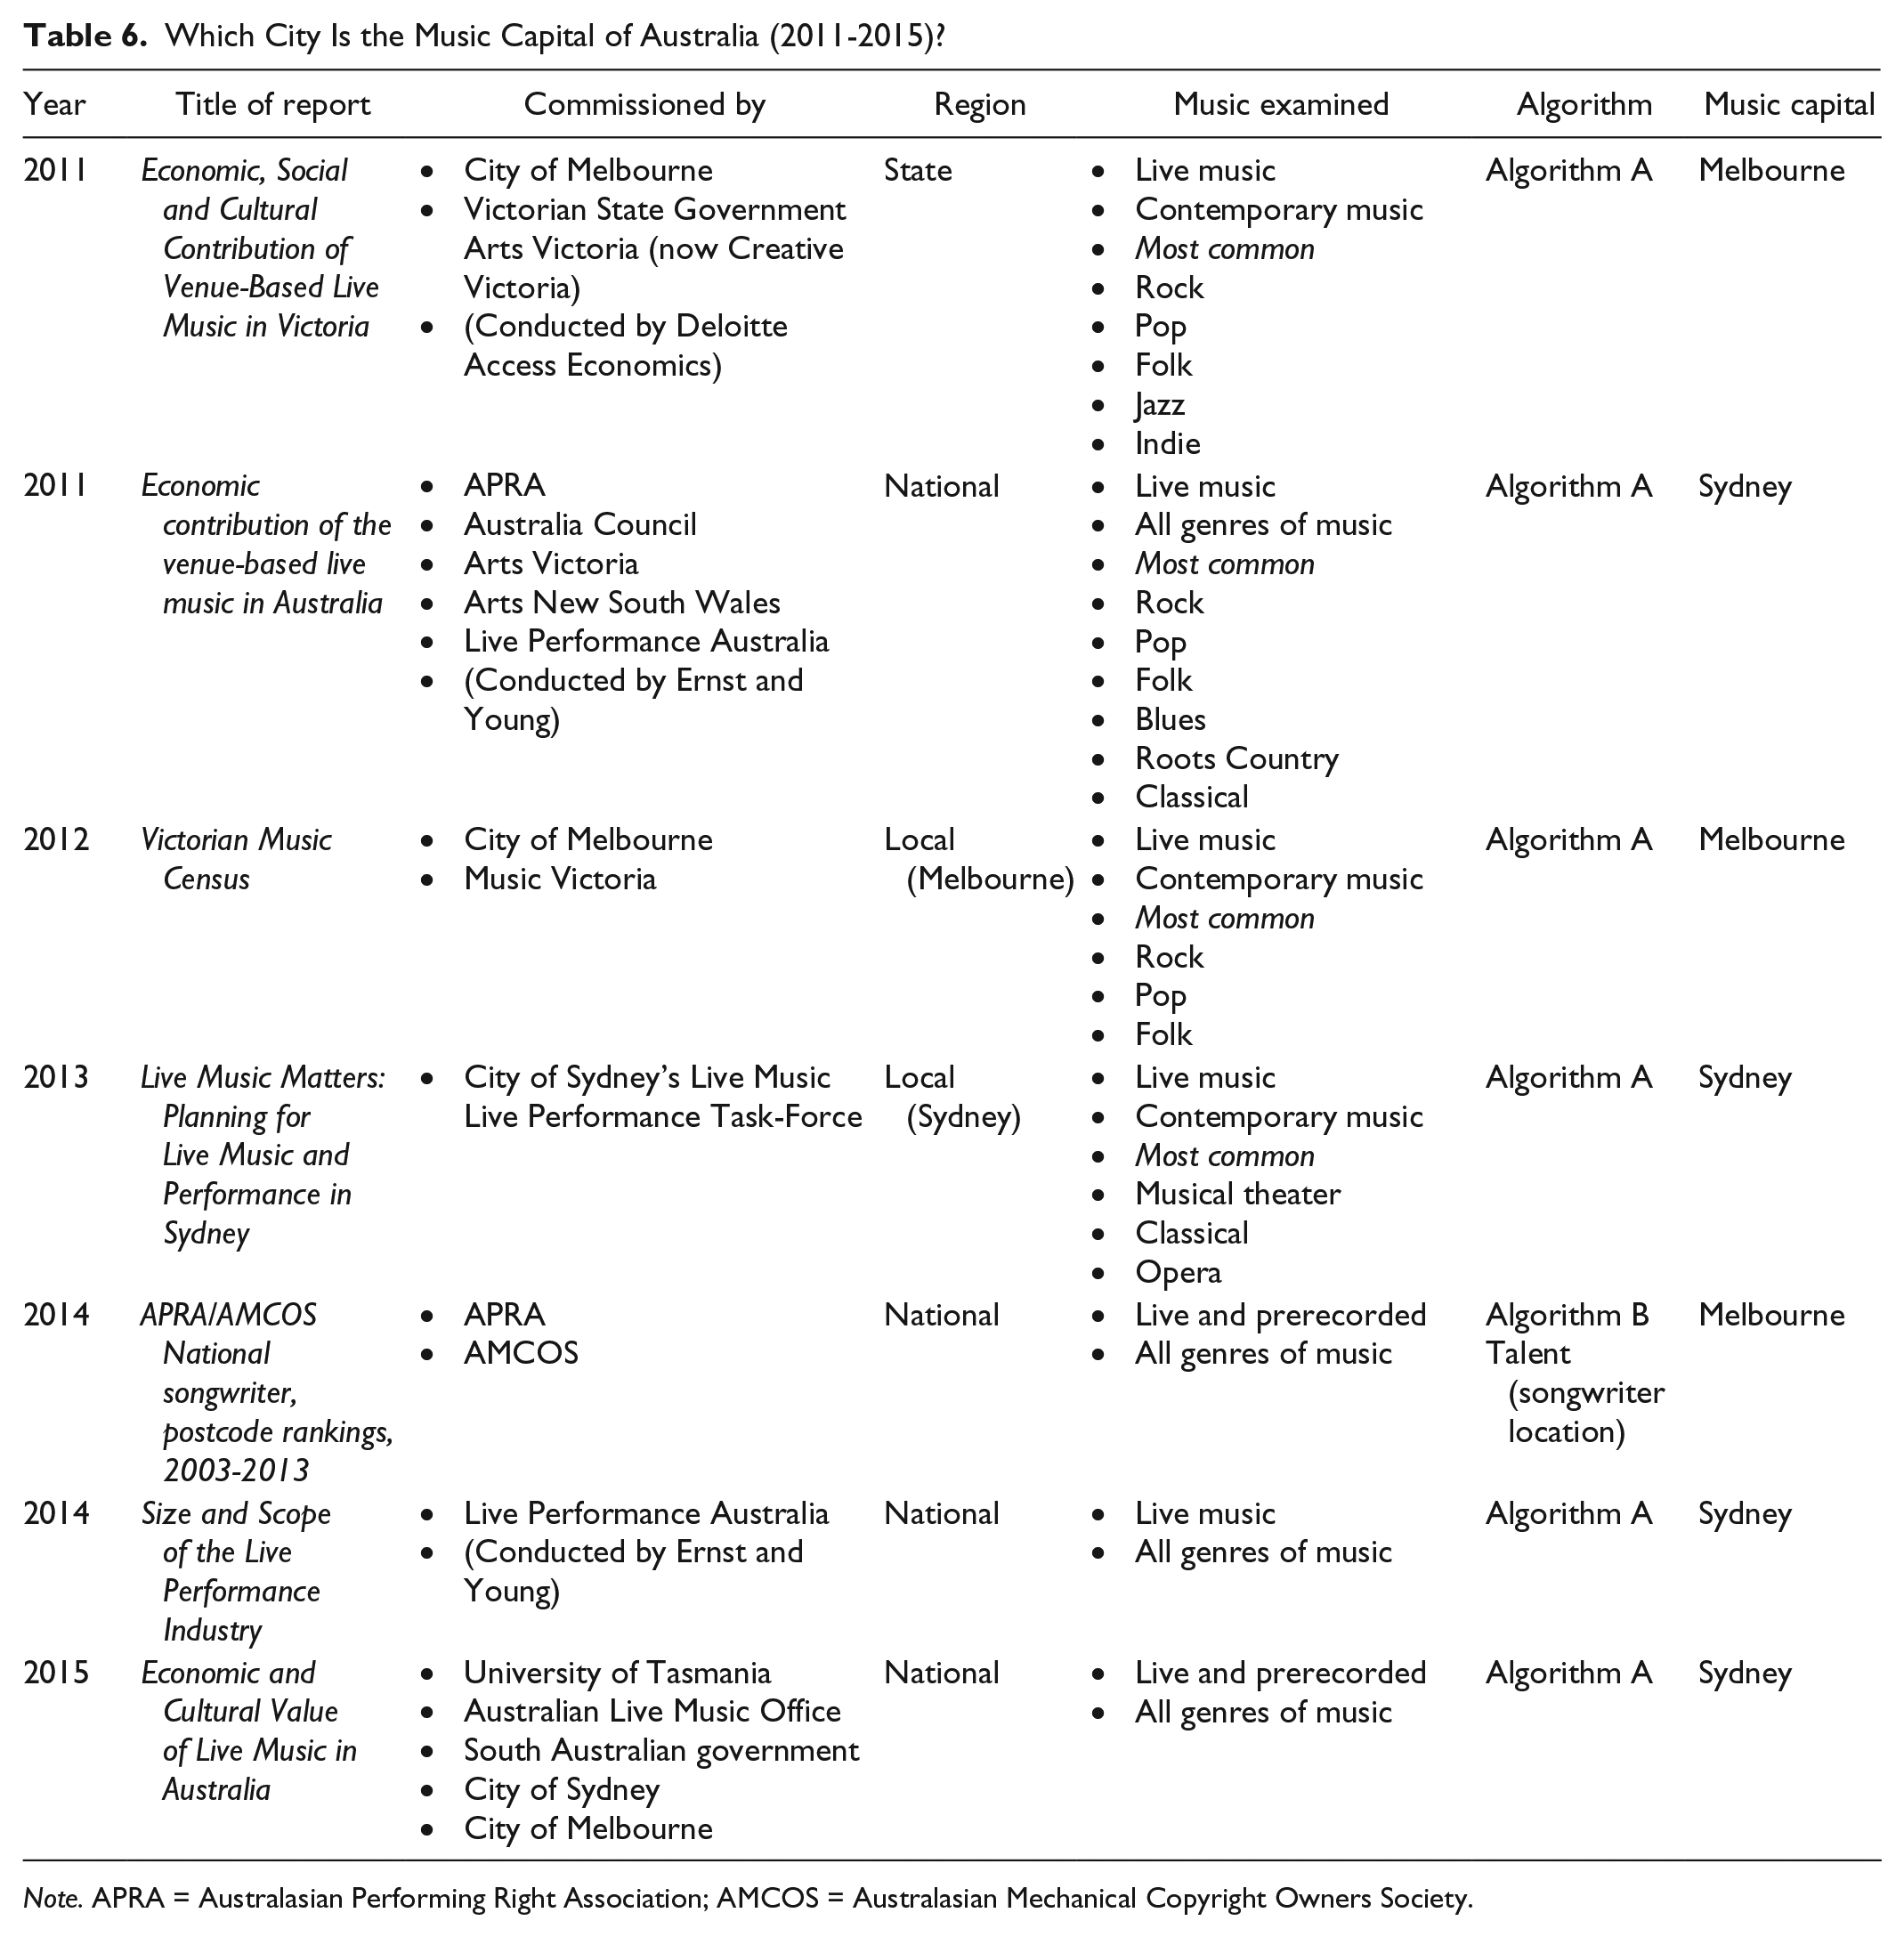
Between 2011 and 2015, seven investigations (Table 6) explore Melbourne’s music scene using Algorithm A (Economics) or Algorithm B (Four T’s creative index), but rarely Algorithm C (Heritage). Six reports (five from the industry 7 and one from the academic study 8 ) used the four variables associated with Algorithm A, that is, financial impact (revenue, employment, audience participation) and the number of venues. The remaining industry report (Harris, 2014) uses the Talent variable of Algorithm B and focused on the number of singer–songwriters in each Australian state. The first six investigations reflect the linkage between “culturalisation” and “economisation” (Pratt, 2009, p. 4), which several economic sociologists oppose (Hutter & Throsby, 2008; Jackson, 2009; Pratt, 2009, Throsby, 2010)) because of its reductionist view of cultural activity. The remaining industry report (Harris, 2014) adopted Florida’s (2012, p. 38) “creative class” occupational index, which, as Pratt (2009, p. 7) argues, fails to capture the wider social reality of the cultural industries.
Which City Is the Music Capital of Australia (2011-2015)?
Note. APRA = Australasian Performing Right Association; AMCOS = Australasian Mechanical Copyright Owners Society.
The seven investigations differed in scope, methodology, and exploration of music genres, and therefore yield different results. In regard to scope, six (2011-2014) were industry reports with local or state government backing, while one study was conducted by the academy (University of Tasmania). Of the six industry reports, three were municipal council reports, two reports focused on Melbourne, and one report centered on Sydney. The academic study explores the Australian music landscape. Concerning methodologies, two industry reports (Economic, Social and Cultural Contribution of Venue-Based Live Music in Victoria, 2011; Newton, 2012) use a “mixed methods approach,” which is defined as a combination of quantitative and qualitative data (Creswell, 2009, p. 2). This approach supports the critical “cultural turn” (Pratt, 2009, p. 3) in the assessment of the music industry by favoring interpretive, qualitative methodologies (Throsby, 2010). These two reports contend that Melbourne is the music capital of Australia. The other four investigations (industry reports and academy study) used an economically driven quantitative, “reductivist” or “productivist” (Pratt, 2009, p. 3) approach and suggested that Sydney is the music capital of Australia. Finally, in relation to music genres, Table 6 highlights that research about the “music cities paradigm” (Baker, 2016, p. 334) has not been consistent, in what musicologists (Cohen, 2007; DeNora, 2000; Hesmondhalgh & Negus, 2002) call the definition of music. Only two (Economic and Cultural Value of Live Music in Australia, 2015; Harris, 2014) out of the seven investigations offer a holistic view of the Melbourne music scene because they include live music and recorded music. These two studies and the 2014 Size and Scope of the Live Performance Industry include all music genres from contemporary, pop, classical, opera, ethnic and world music, and recorded music, and therefore offered a holistic view of the “music city paradigm” (Baker, 2016, p. 334).
Melbourne Is the Live Music Capital of Australia
Empirical evidence that Melbourne is the live music capital of Australia emerged from two reports (Economic, Social and Cultural Contribution of Venue-Based Live Music in Victoria, 2011; Newton, 2012) using Algorithm A (Economics) and Algorithm B (four T’s of creative index). The other report (Harris, 2014) used the talent variable of Algorithm B (Talent), based on Australasian Performing Right Association (APRA) and Australasian Mechanical Copyright Owners Society (AMCOS) of songwriter location (Table 7).
Melbourne, Music Capital of Australia (2011-2014).

Note. APRA = Australasian Performing Right Association; AMCOS = Australasian Mechanical Copyright Owners Society.
National Study (Algorithm B’s Talent Index, Songwriter Location)
Released on December 22, 2014, data from the APRA/AMCOS report, titled National Songwriter, Postcode Rankings, 2003-2013, rank Australian cities according to the residential location of songwriters. Applying the talent variable of Algorithm B, the report found that Melbourne had the most contemporary songwriters, in the categories of pop, rock, alternative music, jazz, and classical composers in Australia. After Melbourne, Sydney had the second largest number of songwriters (Harris, 2014). Following the release of the 2014 report, principal APRA/AMCOS analyst Andrew Harris said the data confirmed that Melbourne was the music capital of Australia. However, the APRA/AMCOS report was associated with three limitations. First, other musicians, who are not songwriters, were not included in this investigation to validate Harris’s claim. Second, individual APRA registered songwriters have access to various catalogs in terms of number of songs, commercial release, and income generation, but this report also did not explore the activity and success levels among songwriters. Finally, industry reports, like the APRA and AMCOS one, need to be conducted annually (not ad hoc) to assess the longitudinal trends and mobility of the Australian music population.
Victorian Study: Algorithm A (Venue Location, Economic Impact, Financial Profits, Employment, and Audience Participation) and Algorithm A (Four T’s Creative Index)
The 2012 Victorian Live Music Census 9 analyzed the local music scene according to Algorithm A (Economics) and Algorithm B (Four T’s creative index). In regard to Algorithm A, the census reports that Melbourne and the surrounding suburbs had 465 venues that offered live music at least two nights a week (Newton, 2012). Comparing these figures with the 2015 World Cities Report (previously noted) illustrates that Melbourne has the second most live music venues after the top ranked city, Los Angeles, which has 510 live music venues (Simons, 2015). These figures support Connell and Gibson’s (2003) argument that “authenticity” of music scenes is heavily lined to a “live music” culture (p. 18). Concerning economic impact, the 2012 Census also highlights that the live music scene (venues, concerts, festivals) generated Aus$1.04 billion annually (Newton, 2012). The census reports that the local live music industry generates more than 116,000 full-time jobs annually (Newton, 2012), which supports Florida’s (2002) argument that the creative class fuels creative employment. The 2012 Census of the Melbourne music industry also support Cohen’s (2007) claim that music is a vibrant local resource (Table 6).
Algorithm B’s Four T’s creative index is reflected in the census survey results in three ways. First, surveying 258 live music performers the census found that the majority of performers were APRA members and had at least one commercial recording. This finding reflects Algorithm B’s talent variable. Second, the census reports that musicians promote their music via the street press or online, for example, SoundCloud or YouTube (Newton, 2012). This second finding highlights Algorithm B’s technology variable. As Florida (2002) claims, technology supports a creative city. Third, to measure audience participation and social and cultural impacts from live music gigs, the census also surveyed 560 music fans (Newton, 2012; Table 7). The census found that the average music fan was a full-time worker or a university student, aged in their mid- to late-20s, who listened to rock music and sourced the music gig guide from the alternative press such as community radio (Triple R [RRR], 10 Progressive Broadcasting Service [PBS] 106.7 FM 11 ) or street press (Beat and Inpress magazines 12 ) (Newton, 2012). This final finding supports Algorithm B’s territorial assets variable because it highlights that Melbourne music scene was associated with a “sense of place,” and helped to create a music “community” and cultural “identity” (Cohen, 2007, p. 38). Despite having no comparable national or international empirical evidence, and making use of Algorithms A and B, in the Victorian census, Newton (2012) claims that “Melbourne is Australia’s centre of popular music live performance” (p. 10).
A precursor to the 2012 Census, the Economic, Social and Cultural Contribution of Venue-Based Live Music in Victoria, was released in June 2011 and conducted by Deloitte Access Economics (Table 7). Similar to the 2012 Census, the report applied Algorithms A and B in its survey analysis but had fewer respondents (477) than the census (818). In regard to Algorithm A, the report was associated with three findings. First, in regard to economic values, it surveyed 103 venues (“the intermediary”), which were registered with APRA such as hotels, bars, cafes, restaurants, and nightclubs (Economic, Social and Cultural Contribution of Venue-Based Live Music in Victoria, 2011, p. 4; Table 6). Despite the difference in survey numbers, the Deloitte report (Economic, Social and Cultural Contribution of Venue-Based Live Music in Victoria, 2011) and the 2012 Census (Newton, 2012) both agreed that Melbourne had about 465 venues, which play a crucial role in developing music careers and incubating talent. Second, building on the economic impact, the the Deloitte report said that full-time employment figures increased by about 17,200 staff per year but did not provide original employment figures prior to that increase. Therefore, it is hard to compare its employment figures with the 2012 Census, which stated that the local music industry employed 116,000 full-time persons per year (Newton, 2012; Table 7). Finally, in relation to financial profits, and like the census, the report says that the Melbourne music scene generated more than Aus$1 billion of great music cities such as Austin in Texas (Rowling, 2015).
In regard to Algorithm B, the 2011 Economic, Social and Cultural Contribution of Venue-Based Live Music in Victoria report offers more insightful than the census because it undercovered three additional findings, which reflect Florida’s (2002) creative index of talent, tolerance, and territorial assets. First, in regard to the talent and territorial assets variables, its survey of fifty-one live music performers, noted as “the upstream supplier” (p. 3) highlights that live music venues nurture creativity by providing a space for musicians to perform original music (p. 26). This finding reflects what Elbourne (2013) and Connell and Gibson (2003) say in regards to drawing and keeping musical talent are critical to any city’s music status. As Connell and Gibson (2003) note, a city with a vibrant live music culture can serve as a “cultural anchor” for musicians (p. 29). It implies that Melbourne’s live music scene possess territorial assets that are highly valued by musicians and others migrating to the city from interstate. Second, extending on the territorial assets index, the report notes that a nurturing media (community radio such as RRR and PBS and the street press), local community cohesion, such as the Save Live Australian Music (SLAM) 13 rally in 2010 helps to protect the live music industry (Economic, Social and Cultural Contribution of Venue-Based Live Music in Victoria, 2011). Finally, in regard to the tolerance variable, the report surveyed 427 music fans, called “the downstream consumers” (p. 3) and found that live music venues provide an opportunity for music fans to develop “social connectedness” and a “sense of belonging,” particularly among young adults (pp. 38-39). The report’s findings linkage to Algorithm B suggest that music plays a role “in the production of individual, collective and local identify” of Melbourne (Cohen, 2007, p. 38).
The two Victorian reports (Economic, Social and Cultural Contribution of Venue-Based Live Music in Victoria, 2011; Newton, 2012) suggest that music is an expression of Melbourne’s urban life because it plays a key role “in the production of individual, collective and local identify” of the city (Cohen, 2007, p. 2). The reports claim that no city in Australia matched Melbourne’s music activity, depth or diversity. However, these proclamations are problematic because they are associated with two key limitations. First, similar to The Mastering of a Music City (Terrill et al., 2015) report, the investigations fail to examine all genres of music and offer national or international comparable figures, by only focusing on Melbourne’s rock and pop music scene (Economic, Social and Cultural Contribution of Venue-Based Live Music in Victoria, 2011; Table 7). Second, they fail to make concrete national or international comparisons. As Madrid (cited in Garrett & Oja, 2011, p. 700) highlights, music is affected by the ongoing economic and spatial restructuring of the industry. However, these investigations also acknowledge, “The economic, social and cultural contribution of live music in Victoria” is still in need of more in-depth study (Economic, Social and Cultural Contribution of Venue-Based Live Music in Victoria, 2011, p. 36). Analysis of these two local investigations illustrates that “music and cities . . . can mean different things to different people,” and are “not impartial to crude generalizations” (Cohen, 2007, p.68).
Counterclaims to Melbourne’s Live Music Capital Title: Algorithm A (Live Music Activity, Financial Profits, Employment, and Audience Participation)
Four investigations (one national academic study, 2015; two national industry reports, 2014 and 2011; and one Sydney report, 2013) exploring the Australian music landscape are based on Algorithm A (Economics; Table 8). These reports suggest that, based on the number of venues (live performance activity) and economic impact (financial profits, employment, and audience participation), New South Wales (NSW), not Victoria, has the most music activity in Australia. The first investigation is a national academic study titled the Economic and Cultural Value of Live Music in Australia (2015), which released in August 2015 but based on 2014 figures. It surveyed thirty-eight venues spread across six states (NSW, Victoria, Queensland [QLD], South Australia, Western Australia, and Tasmania) and two territories (Northern Territory and Australian Capital Territory), and is associated with two key findings. First, this 2015 study reports that NSW’s live music scene (revenue, festivals, and attendance rates) had a marginally greater economic and cultural impact than Victoria (Economic and Cultural Value of Live Music in Australia, 2015). Second, it notes that NSW had the highest live music attendance (35.9%) in Australia, while Victoria was second (31.3%) (Economic and Cultural Value of Live Music in Australia, 2015, p. 17; Table 8).
Sydney, Music Capital of Australia (2011-2015).
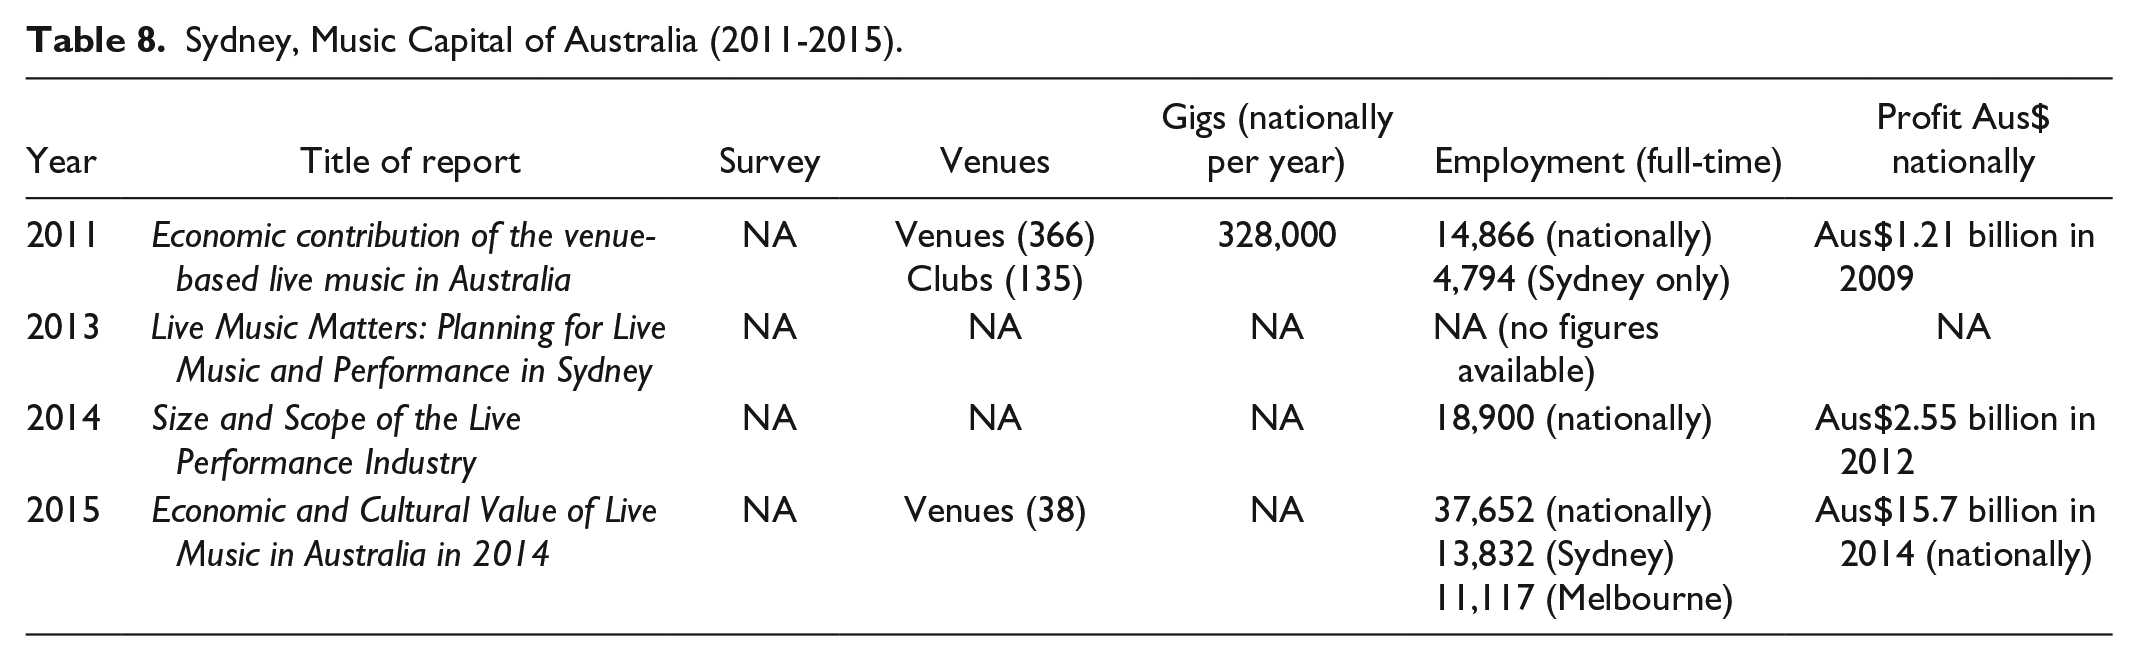
The second investigation is a national industry report by Ernst and Young, titled Size and Scope of the Live Performance Industry report 14 . Released in February 2014 and based on 2012 figures, it uncovers two key findings. First, the reports reveals that NSW has the highest number (38.4%) of live performance production and attendance nationally; Victoria was second (27.6%), while QLD (15.5%) was third (2015; Table 8). Second, it highlights that the music economic impact was greater than other aligned Australian industries such as film, television, and digital games.
The third investigation, a city report from 2013 titled Live Music Matters: Planning for Live Music and Performance in Sydney, says that “NSW was the largest contributor to the venue-based live music industry” in Australia because it accounted for 32% of the nation’s music output (p. 7). These statistics are derived from the fourth (and final) investigation, a September 2011 report by Ernst and Young titled Economic Contribution of the Venue-Based Live Music in Australia, which contends that NSW had the most live music in Australia (32%), QLD came second (23.6%), while Victoria was third (22%). While these four investigations dispute the claim that Melbourne is the music capital of Australia, they only paint a half picture of the music scene because they rely on the mathematical flowchart of Algorithm A (Economics). As scholars (Hutter & Throsby, 2008; Jackson, 2009; Pratt, 2009) argue, the economization of culture needs to give way to draw on more holistic, social and cultural interpretative investigation of the music landscape.
Benchmark: Algorithm D (Music Cities Definition)
Tables 6 to 8 illustrate that there are limitations, missing gaps, and discrepancies in the three algorithms (A-C) used to examine music cities. For example, using a variety of quantitative and qualitative research methods and applying Algorithm A (Economics) and Algorithm B (Four T’s creative index), four of the seven investigations examined in this article suggest that Sydney, not Melbourne, is the music capital of Australia. These discrepancies (and deficits reflect) the need for a fourth (benchmark) algorithm, such as Algorithm D (Music Cities definition), is needed to comprehensively assess music activity in any urban context (Table 1). Algorithm D has three main components in relation to methodology, music genres, and scope. First, in regard to methodology, its outcomes will be based on a “mixed methods research,” that is, a combination of quantitative and qualitative data (Creswell, 2009, p. 2). Second, the algorithm assesses, a key variable, all music genres (live and recorded). Finally, concerning scope, it synergizes Algorithms A to C’s thirteen variables, ranging from economics (financial impact, number of venues, and audience participation), Four T’s creative index (technology, tolerance, talent, territorial assets), and music heritage (background in music-making, education, community involvement, regular high-profile music events of local and international importance) into one conglomerate. In total, fourteen variables associated with Algorithm D offer a more holistic definition of music cities because of two reasons. First, it emphasizes the importance “of place (the physical environment through which we move) and space (the practice and lived experience of place)” (Fink cited in Garrett & Oja, 2011, p. 709). Second, it illustrates that music cities are also influenced by “cultures, economics, politics, and technology of the changing structure and geographies of music at local and global levels” (Connell & Gibson, 2003, p. 1).
Conclusion
This article highlights that debates about whether Melbourne is Australia’s music capital remain contestable because, for example, Algorithms A to C used to assess music activity only paint a half picture of this “music cities paradigm” (Baker, 2016, p.334). Given there are many drivers of organizations commissioning various music investigations, the article proposes a benchmark Algorithm D to review and analyze music activity in an urban context. Algorithm D is based on a mixed methods research approach. This algorithm is associated with fourteen variables (Table 1) includes all genres of music and the conglomeration of 13 variables from Algorithms A to C. Algorithm D offer a holistic view of music cities, because it emphasizes the importance of place and space in music production across the globe (S. Cohen, 2007; Connell & Gibson, 2003; Garrett & Oja, 2011). Algorithm D also builds on an interdisciplinary framework, from economic sociology, musicology, and urban studies, which is critical to any discussion of music cities. As economic sociologists (Hutter & Throsby, 2008; Jackson, 2009; Pratt, 2009; Throsby, 2010) note, culture is a multilayered activity, which is beyond a price tag. Musicologists (Cohen 2007; DeNora, 2000; Hesmondhalgh & Negus, 2002, Madrid cited in Garrett & Oja, 2011) contend that failing to investigate all genres of music across the globe offers a reductive representation of music cities’ sounds. In the case of Melbourne, if this city wants to claim its status as the music capital of Australia, consistent data mining using fourteen variables, outlined in Algorithm D, offers a benchmark for further investigation. Until then, ambient claims that Melbourne is Australia’s music capital remains an abstract notion coined by cultural groups that have a vested interest in pursuing a policy agenda, to sell their city as a national and global music city.
Footnotes
Declaration of Conflicting Interests
The author(s) declared no potential conflicts of interest with respect to the research, authorship, and/or publication of this article.
Funding
The author(s) disclosed receipt of the following financial support for the research, authorship, and/or publication of this article: The author receivedfinancial support during a sabbatical from Monash University for the research and authorship of this article.