
Abstract
With more than 3 million participants per year, the Advanced Placement (AP) program is one of the most popular programs in the United States for exposing high-achieving high school students to advanced academic content. Sponsored by the College Board, the AP program provides a framework in which high school teachers can teach introductory college-level courses to high school students. These students then take one of 34 standardized tests at the end of the year, and students who score well on their course’s AP test can receive college credit from their university in which they later enroll. Despite the popularity of the AP program, remarkably little independent research has been conducted on the academic benefits of AP. In this article, I summarize the state of knowledge about the academic benefits of AP. Previous research and descriptive data indicate that AP students outperform non-AP students on a variety of academic measures, but many other aspects of the program are poorly understood, partially due to variability across AP subjects. These aspects include the causal impact of AP, which components of the program are most effective in boosting academic achievement, and how students engage with the AP program. I also conclude by making suggestions for researchers to use new methodologies to investigate new scientific and policy questions and new student populations to improve the educational scholars’ and practitioners’ understanding of the AP program.
Keywords
The Advanced Placement (AP) program is an academic program in which high school students can learn college-level material from their high school teachers and then take a standardized exam at the end of the school year. Students who perform well on their course’s AP test may be granted credit by their university and/or be exempted from taking introductory courses in college. Started by the College Board in the late 1950s, today the AP program is one of the most common ways for American high schools to provide advanced academic content to high-achieving high school students. In recent years, more than 2 million high American school students have taken more than 3 million AP tests annually (College Board, 2015).
Despite the widespread popularity of the AP program, there is remarkably little independent research on its academic benefits. (The College Board has numerous publications in this area.) The purpose of this article is to summarize the empirical research on the academic benefits of the AP program and to create a list of several scientific and policy questions that remain unanswered about the AP program. My overall goal with this article is to take stock of the AP program by looking back—through an examination of prior research—and looking forward—through new research questions—to the future of AP research. I will accomplish this by discussing previous research and data and discussing the results. In this way, I hope to give readers a strong understanding of the empirical research on the functioning and benefits of the AP program and to suggest avenues of research to improve understanding of AP.
Looking Back . . . at Prior AP Research
College Board Research
For decades, the College Board has had an impressive research program investigating the AP program. Some of the College Board’s studies are psychometric in nature, including research related to the validity of AP test scores (e.g., Gray, Hildebrant, & Strauss, 2006; Melican, Debebe, & Morgan, 1997; Wimmers & Morgan, 1990), AP test construction (e.g., Lukhele, Thissen, & Wainer, 1994), and test item bias (e.g., Stricker & Emmerich, 1999). This research uniformly shows that AP tests are developed in accordance with the highest professional standards of test development and interpretation. This research also shows that recent developments in test construction are often quickly incorporated into AP tests when they are revised by College Board staff (Brennan, 2010; Ewing, Huff, & Kaliski, 2010).
A line of research related to the College Board’s psychometric work is the noteworthy number of non-experimental group comparison studies of the academic performance of non-AP students and AP students. College Board studies have shown that AP students score higher on standardized test scores than non-AP students (Ewing, Camara, & Millsap, 2006; Mattern, Shaw, & Xiong, 2009; McKillip & Rawls, 2013). AP students also attend college at higher rates (Chajewski, Mattern, & Shaw, 2011; Wyatt & Mattern, 2011), earn higher grades in college (Keng & Dodd, 2008; Morgan & Klaric, 2007; Murphy & Dodd, 2009; Patterson, Packman, & Kobrin, 2011; Shaw, Marini, & Mattern, 2013), are less likely to drop out of college (Mattern et al., 2009; Wyatt & Mattern, 2011), and graduate from college at higher rates than non-AP students (Mattern, Marini, & Shaw, 2013). AP students also hold more favorable attitudes toward the same academic material that their AP course covered (Patterson, 2009) and are more likely to major in a field related to their AP course than non-AP students are (Keng & Dodd, 2008; Mattern, Shaw, & Ewing, 2011; Morgan & Klaric, 2007).
Although the College Board’s body of research concerning the AP program is impressive, there is a potential for the conflict of interest in College Board scientists or consultants studying the benefits of a College Board program. From an outsider’s perspective, it seems convenient that much of the College Board’s research on the AP program indicates that the program is beneficial for high school students. Therefore, independent research on the College Board’s program is vital (Warne & Anderson, 2015).
Non–College Board Research
It has only been in recent years that the AP program has attracted the interest of non–College Board researchers. Before the 21st century, most peer-reviewed articles on the AP program were merely descriptive (e.g., Barnett & Durden, 1993; Pushkin, 1995). These and other articles (e.g., Blagaich, 1999; Cone, 1992; Meckna, 1999) were written under the assumptions that the AP program is beneficial and that success in the program was prima facie a good thing for students (Tai, 2008). Yet, no independent researchers tested this assumption until recently.
Lichten (2000) was the first scientific author to question the efficacy of the AP program. He had several criticisms, including the claim that less able and/or less prepared group of students were participating in AP than previous years, as shown by falling AP exam passing rates. Lichten also had concerns about the potential misalignment between the college introductory curriculum and the AP curriculum and exams. In the years since Lichten’s work, other education scholars have questioned the premise that AP is a beneficial program for students, including Tai (2008), Farkas and Duffett (2009), and Gallagher (2009), with Lichten (2010) revisiting the issue a decade later.
The first non–College Board study that examined the academic impact of AP program participation was Geiser and Santelices’s (2004) study of the relationship between students’ high school records and their performance at college. The authors found that neither AP course participation nor AP exam scores had any predictive power for students’ college grade point average (GPA) or for college persistence after controlling for demographic variables, SAT scores, high school GPA, and other variables. Even though Geiser and Santelices’s (2004) study was a technical report for the University of California system—and not published in a peer-reviewed scientific journal—it has accumulated more than 200 citations (according to Google Scholar) and even prompted the College Board to issue an official response (Camara & Michaelides, 2005) and conduct a similar study on the same research questions (Shaw et al., 2013).
Lichten’s (2000) and Geiser and Santelices’s (2004) work has since prompted an avalanche of independent research on the AP program in which other researchers have investigated the claims of the College Board and the widespread beliefs about the academic benefits of the AP program. These researchers have produced results that question the belief that AP is beneficial for students, high schools, and universities.
Academic Benefits From AP
Perhaps the most vexing unanswered questions about the AP program are the most basic questions of all: Does AP provide academic benefits? And if so, what are these benefits? How large are they? Early non–College Board efforts to answer this question use basic quasi-experimental methodologies comparing AP students with non-AP students. These efforts to compare non-AP students with AP students have produced findings indicating that AP students outperform their peers in a variety of measures of academic achievement, including college entrance exam scores (Ackerman, Kanfer, & Calderwood, 2013; Flowers, 2008; Mo, Yang, Hu, Calaway, & Nickey, 2011), college GPAs (Ackerman et al., 2013; Flowers, 2008), measures of writing ability in college (Hansen et al., 2006), college graduation rates (Ackerman et al., 2013; Klopfenstein, 2010; Tai, Liu, Almarode, & Fan, 2010), and rates of obtaining advanced degrees (Bleske-Rechek, Lubinski, & Benbow, 2004; Flowers, 2008). These findings support similar results in College Board studies.
Yet, these studies tell educators little about the actual effectiveness of the AP program because these authors controlled for few or no confounding variables. Participation and success in the AP program are the results of non-random processes. Therefore, AP students and non-AP students differ from one another in many ways. AP students tend to be from higher income families, are more likely to be White and attend suburban schools, and have better academic preparation for high school than non-AP students (Cisneros, Holloway-Libell, Gomez, Corley, & Powers, 2014; Dougherty & Mellor, 2010; Jeong, 2009; Moore & Slate, 2008). Therefore, making simple comparisons between AP students and non-AP students without controlling for confounding variables is problematic. Klopfenstein and Thomas (2010) summarized this issue best by saying,
While there is evidence of a correlation between AP experience and college success (because AP students tend to be capable and highly motivated), there is no evidence from methodologically rigorous studies that AP experience causes students to be successful in college. . . If the relationship between AP experience and college success is not causal, then policies that broaden AP-taking will not improve rates of college success for nontraditional AP students. (p. 170)
In response to these concerns, more researchers are controlling for confounding variables to ascertain the causal impact of the AP program. Most authors have found that controlling for covariates reduces the apparent impact of the AP program on academic achievement (e.g., Klopfenstein & Thomas, 2010; McKillip & Rawls, 2013; Sadler & Sonnert, 2010; Warne, Larsen, Anderson, & Odasso, 2015) or makes the impact of AP participation vanish completely (e.g., Geiser & Santelices, 2004; Schumacker, 2014).
The tendency for the AP program to appear to be less effective after controlling for covariates is particularly apparent in one of the largest non–College Board studies ever to investigate the AP program (Warne et al., 2015). In this study, the researchers used marginal mean weighting through stratification (MMW-S) to control for 71 confounding variables in a sample of 45,558 students, which was the entire population of the Utah public schools’ graduating class of 2010. Warne et al. (2015). divided their sample into four groups: (a) students who never took an AP English course, (b) students enrolled in AP English who never took an AP exam, (c) AP English students who took an AP English exam but did not pass because they obtained a score of 1 or 2, and (d) AP English students who passed an AP English exam because they obtained a score of 3 through 5. The researchers labeled these groups “non-AP students,” “exam non-participants,” “exam non-passers,” and “exam passers,” respectively. The academic achievement of these groups was measured with ACT scores. Table 1 shows that, before controlling for any covariates, the ANOVA effect sizes measuring the impact of participation of AP on ACT scores ranged from η2 = 6.21% to η2 = 13.04%. However, after controlling for the 71 covariates, the effect sizes were much smaller, ranging from η2 = 1.72% to η2 = 5.92%. All these effect sizes were reduced by 53.1% to 72.3%.
Descriptive Statistics and Effect Sizes for the AP Program, Before and After Controlling for Covariates.

Source. Data taken from Warne, Larsen, Anderson, and Odasso (2015).
Note. AP English analysis on data from the high school graduating class of 2010 in Utah. AP = Advanced Placement.
This example shows rather dramatically the statistical bias of most estimates of the academic benefits of the AP program and the importance of controlling for covariates. Researchers who fail to control for confounding variables may be grossly overestimating the impact of the AP program on academic achievement. Yet, even after controlling for so many variables, Warne et al. (2015) recognized that there were still likely covariates that they failed to control, and they stated, “. . . the results in this article should be considered upper limits of the effectiveness of the AP program” (p. 414).
To sum up, researchers working independently of the College Board have also generally found that AP participation is associated with higher academic achievement. Yet, these results are more nuanced and less uniformly positive than the College Board’s research. Researchers who have controlled for confounding variables generally find weaker effect sizes than researchers who do not make any attempt to control for pre-existing group differences among AP and non-AP students. Therefore, the AP program might still provide academic benefits for students, but the magnitude of these benefits is not clear.
Economic Costs and Benefits of AP
The academic benefits of AP courses cannot be considered in isolation, though; it is important to consider the economic costs and benefits of the program, as some educational policy scholars have done. The costs and benefits of AP may be unevenly distributed among stakeholders, including students, their families, school districts, and taxpayers.
One widespread belief is that earning credits via AP will reduce a student’s time to earn a college degree and therefore save his or her money in college tuition (Klopfenstein, 2010). In addition, government education agencies—such as school districts, public universities, and state governments—pay for the AP program in various ways believing that these investments will reduce the expense of educating former AP students in college. Many agencies provide incentives for AP participation, such as exam fee subsidies for low-income students, financial bonuses for teachers who have large number of students succeed, and merit college scholarships for students who achieve at high levels in AP courses (e.g., Dendy, Graf, Hartley, & Smith, 2006; Klopfenstein, 2010; Kramer, 2016). However, there are few studies showing the cost-effectiveness of these programs—and what few studies exist do not show that these incentives result in lower education spending for governments. For example, analyses in Florida and Texas have shown that generous state incentives to encourage AP participation are not cost-effective for taxpayers or families (Dendy et al., 2006; Klopfenstein, 2010; Sikes, Underhill, & West, 2009). It is possible that more modest spending on the AP program, such as the most common state incentive of providing AP exam fee subsidies to students, are also not cost-effective. Klopfenstein and Thomas (2010, p. 181) found that “A large fraction of AP exam subsidies go to students who fail the AP exam,” and it seems difficult to argue that paying money for students to take an AP exam for which they will likely receive no college credit will somehow save a state money later in the student’s educational career.
Other researchers have investigated whether students who participate in the AP program save money by graduating from college more quickly—a widespread belief that the College Board itself propagates (e.g., Mattern et al., 2013). The research verifying this claim is mixed, with College Board researchers finding that AP participation increases 4-year college graduation rates (Mattern et al., 2013) and non–College Board researchers finding that concurrent enrollment was more effective than AP at reducing graduation time for students (Klopfenstein, 2010). On the contrary, Ackerman et al. (2013) found that time to graduation was reduced only for AP exam passers. However, non-participants in the AP program had higher graduation rates than AP students who took and failed their AP exams (Ackerman et al., 2013).
Although financial benefits of the AP program have been studied, students may receive non-financial benefits from AP participation. The College Board (2014c) argues that the challenge of AP is itself a benefit because it builds college-level study skills and provides opportunities for academic rigor. Other researchers have mentioned that students receive benefits from merely enrolling in AP courses because their schools weight their GPA (Geiser & Santelices, 2004; Jackson, 2010; Klopfenstein & Lively, 2016; Warne, Nagaishi, Slade, Hermesmeyer, & Peck, 2014) or because students believe that having an AP course on their transcript increases their chances of acceptance to college (Geiser & Santelices, 2004). However, there are also non-financial costs that schools accrue from providing AP courses: These include diverting resources away from other academic programs (such as remediation to improve basic skills for students), larger non-AP classes, and diverting better teachers away from non-AP students (many of whom would receive academic benefits from having high-quality teachers). These non-financial opportunity costs of the AP program are largely unexplored (Klopfenstein & Thomas, 2010).
Looking Forward . . . to Future AP Research
With this background and understanding of prior AP research, it is now my goal to look forward to the future of AP research. I have identified five ways that educational scholars can advance the body of literature on the AP program: (a) methodologically, (b) with an awareness of AP course variability, (c) through examining new student populations, (d) with new purposes for research, and (e) with new scientific and policy questions.
Looking Forward Methodologically
Controlling for covariates
The example in Table 1 shows the importance of controlling for confounding variables to reduce the magnitude of statistical bias in effect sizes. Recent methodological advances have made it more feasible than ever to control for confounding variables and reduce statistical bias. One major methodological advancement is propensity score analysis (Guo & Fraser, 2010), which allows researchers to control for a greater number of covariates than traditional methods, such as matching (e.g., Chamberlain, Pugh, & Schellhammer, 1978; Schumacker, 2014) or ANCOVA (e.g., Mattern, Shaw, & Kobrin, 2011). Researchers who use propensity score analysis use covariate variable values to calculate a probability that a student will belong to a subgroup within the sample (e.g., non-AP students, or AP exam passers). Instead of matching subjects on exact values of all covariate values (as in traditional methods), the researcher only matches on the propensity scores (Fan & Nowell, 2011; Guo & Fraser, 2010; Yanovitzky, Zanutto, & Hornik, 2005). Researchers studying the AP program have begun to embrace propensity score modeling, both within the College Board (McKillip & Rawls, 2013) and among independent researchers (Jackson, 2010; Long, Conger, & Iatarola, 2012; Sadler & Sonnert, 2010; Warne et al., 2015). The results of studies using propensity score analysis are promising, and these studies bring scholars to a more realistic understanding of the actual benefits of the AP program.
Yet, there is still progress to be made in the use of propensity score analysis in AP program research. One fundamental challenge is that creating accurate causal models requires knowledge of how students get assigned to a particular AP group (i.e., non-AP students, AP exam non-participants, AP exam passers, and AP exam passers). Steiner, Cook, Shadish, and Clark (2010) showed that controlling for non-random assignment to groups requires controlling for covariates that either have a causal impact on group assignment or are strongly correlated with group assignment processes. Controlling for the wrong combination of covariates frequently leads to failure to accurately measure the causal impact of the intervention. In these cases, the statistical model tends to overestimate the effectiveness of a program, though the overestimates are not as large as in studies in which researchers do not control for any covariates.
With the AP program, though, the assignment process is complex, as shown in Figure 1. Rather than a simple one-time selection process, there are three stages of non-random assignment that determine the level of a student’s participation in the AP program. First, school personnel must choose whether to offer an AP course. Second, if the child’s school offers a particular AP course, then the child must choose to enroll in the course. Finally, if a student is enrolled in an AP course, he or she must choose whether to participate in the AP exam.

The three stages of non-random assignment to the AP program.
These three stages of non-random assignment in the AP program are not well understood. Table 2 shows a summary of the literature examining the correlates of the assignment process at each stage. There are two aspects of Table 2 that are striking. First, they are almost surely incomplete; only a limited number of covariates have been discovered to relate to each assignment stage. Second, no covariates appear in all three lists. In fact, there is no reason to believe that the same variables are relevant in each stage of the assignment process. For example, school variables—such as the percentage of students from low-income families—seem very important in the first stage of non-random assignment (e.g., Barnard-Brak, McGaha-Garnett, & Burley, 2011). Yet, other research shows that when AP courses are offered in high-poverty schools, low-income students seem to enroll eagerly in AP courses (Hallett & Venegas, 2011).
Variables Associated With Each Stage of the Three-Stage Non-Random Assignment Process to an AP Course.

Note. AP = Advanced Placement; GPA = grade point average.
The point of this discussion is to emphasize that the methodological strides made controlling covariates in AP research are inadequate until researchers understand the assignment process at each of the three stages in Figure 1. This requires more research on how each of these processes works and what measurable covariates are related to each decision point. Understanding each assignment stage is a requirement to untangling the impact of the AP program from that of confounding variables. Although without a true experiment in which students are randomly assigned to AP courses, it may be impossible to completely isolate the academic impact of AP courses in non-experimental research studies; it is nonetheless imperative to understand the AP enrollment process to create statistical models that reduce the amount of statistical bias as much as possible. A study with less statistical bias is better than a study with a large amount of bias—or no study at all.
Clustering effects
In addition to ignoring the influence of confounding variables (and therefore producing positively biased estimates of the impact of the AP program), much of the research on the AP program also produces distorted estimates of the accuracy of parameter estimates, as quantified by standard errors. Most AP research is based on traditional statistics, which are based on the independence assumption that the sample data are drawn randomly from a defined population. Yet, in many educational data sets members of the sample belong to pre-existing groups (e.g., classrooms, high schools), which is a violation of the independence assumption.
For many years methodologists and educational researchers have known about the challenges in dealing with clustered data. The prime problem is that using traditional statistics with clustered data underestimate the standard errors of parameter estimates, which inflate Type I error (Hox, 2002; Warne et al., 2012). There are corrections available (e.g., McCoach & Adelson, 2010) for standard errors when researchers use traditional statistics with clustered data. However, these corrections do not handle an additional problem of traditional statistics, which is that they do not permit the accurate estimates of cluster-level variable relationships, such as the impact of cluster variables (e.g., school quality) on individual outcomes (e.g., AP test scores; Hox, 2002; McCoach, 2010). For these reasons hierarchical linear modeling (HLM)—also called multilevel modeling—has been developed to handle clustered data (Warne et al., 2012).
AP data are almost always clustered in some way. Students are clustered in classrooms, which are in turn clustered into schools, districts, and states. As a result, school-level variables, district and state policies, and student variables can all exert an effect or combine to form interactions. But the use of traditional statistics in most studies prevents the proper investigation of these types of variable relationships. Some researchers have used HLM to study the impact of the AP program (e.g., Burney, 2010; McKillip & Rawls, 2013; Shaw et al., 2013). For example, Klugman (2013) found that even though AP participation increased in most public schools in California from 1997 to 2006, participation grew faster in schools with a higher percentage of middle-class students. Klugman used this information (about school-level variables) to draw conclusions about an “Advanced Placement arms race” (p. 115) among public schools, driven mostly by the demands of groups of constituents (e.g., middle-class families) more than the demands or characteristics of individual students. The result was an increase in inequality of AP offerings across schools. Following the logic in Figure 1, this cluster-level behavior puts pressure on school personnel to offer AP courses.
Like the efforts to incorporate propensity score modeling into AP research, the incorporation of HLM into AP research is incomplete. One issue is that most research is with two-level models, usually with students clustered into schools—thus preventing the investigation of the impact of classroom variables (e.g., teacher characteristics), district variables, and state policies on dependent variables. Incorporating all these clusters would require a five-level model, which is an extraordinarily complex HLM model. There are a few isolated examples of four-level HLM models in the social science research literature, but I am unable to find an example of a five-level model in any peer-reviewed journal. 1
In addition, many clusters are not mutually exclusive, which introduces more complexity to HLM models. A traditional HLM model has clusters nested within clusters, and a student belonging to a particular classroom also automatically belongs to a particular school, district, state, and so forth. But clustering becomes more complex later in students’ educational careers as AP students go on to college. When students graduate from high school and attend college, they leave one set of clusters (i.e., classrooms, schools, etc.) and move into new clusters (i.e., college majors, universities, etc.), with the newer clusters no longer being mutually exclusive with old clusters. Modeling these non-exclusive clusters requires a cross-classified model (see Goldstein, 1994; Luo & Kwok, 2012). To date, only one study on the AP program has used a cross-classified model to take into account non-exclusive clusters of AP students (Patterson et al., 2011), which showed that AP examinees had higher college GPAs in classes related to their AP course than students who never took an AP test in that subject.
In sum, the potential for HLM to improve the quality of AP research—through improved estimates of standard errors and the investigation of cross-level interactions—has been largely unrealized. I urge researchers to incorporate HLM and cross-classified models into their investigations of the AP program. However, given the possibilities of cross-classified/HLM models with up to five levels of clustering, it is unlikely that any one study could incorporate all the ways that AP data could be clustered. In this way, the discussion of the problem of inaccurate standard errors is not unlike the previous section’s discussion of positively biased estimates of the effectiveness of AP. And—again—even though incorporating every aspect of data clustering into a statistical model may be impossible, if using HLM models to investigate the AP program became commonplace among researchers, then educational scholars would have more accurate estimates of standard errors and a better ability to investigate cross-level variable relationships. These two benefits of HLM models are often not realized in current AP research studies.
Cluster-level randomized control trials (RCT)
Although statistically controlling for covariates and managing clustered data would improve the quality of AP research, neither strategy would fully establish cause-and-effect relationships between AP participation and academic outcomes. Rather, the “gold standard” of educational research is the RCT, which involves randomly assigning research subjects to a treatment and a control group. This randomization equalizes the groups, and any differences in the dependent variable would be due solely to the impact of the intervention (Gall, Gall, & Borg, 2007; Skidmore & Thompson, 2012). Research on the AP program could greatly benefit from the use of RCTs.
Considering the non-random assignment process shown in Figure 1, it is clear that forcing AP students to take (or not take) the AP test would be infeasible, and perhaps unethical. However, the first two stages of AP participation—offering an AP course and enrolling in an AP course—could be part of a cluster-level RCT. For example, in a sample of participating schools, some campuses could be randomly assigned to receive funds and training to offer a new AP course, while remaining schools would continue to offer their regular curriculum. Any later mean differences in student outcomes between schools would be due to the differences in curriculum. Although this sort of design would not answer all questions about the AP program’s effectiveness, it would help school personnel and scholars understand the likely impact of offering an AP course and whether adding new AP courses to the curriculum would be an effective policy.
Likewise, an RCT could be designed in which some groups of students are forced to enroll in an AP or a non-AP course. This could happen, for example, if randomly selected schools convert all their English courses into AP English courses. This design would provide stronger information about the impact of enrolling in an AP course than is available now from published studies (e.g., Warne et al., 2015). Unfortunately, the cluster-level RCT has never been implemented in any research on the AP program—a fact that I would like to see changed.
Looking Forward With an Eye on Course Variability
The College Board offers 34 AP exams in a wide variety of topics. What all these exams have in common is an instruction format where, (a) high school students learn college material from high school teachers and (b) an opportunity for students to earn college credit by performing well on the AP exam (usually a score of 3, 4, or 5). But nearly everything else about AP courses are heterogeneous. There are immense differences among these courses in incentives, availability, exam and course content, examinee demographics, and more.
Skills needed to succeed on an AP test
One of the most striking examples of the variability across AP exams comes from a College Board study where the authors found the correlation between PSAT scores in students’ sophomore year and the AP exam scores in their junior or senior years. The correlations range from a low of r = .033 for the AP Spanish Language and Culture test to a high of r = .695 for the AP English Language and Composition, with a median correlation of r = .541 (Ewing et al., 2006, p. 8). The distribution of these correlations is shown in Figure 2. Because the PSAT is an excellent measure of academic reasoning skills (Camara & Millsap, 1998), it is apparent that the degree of academic skill needed to succeed in AP exams varies across courses (Warne, 2016).

Histogram showing the distribution of correlation coefficients between students’ PSAT scores and AP exam scores.
Although the PSAT data from the College Board (Ewing et al., 2006) is interesting, it is important to note that the PSAT measures global academic aptitude via two subtests: a verbal subtest and a mathematics subtest. The College Board has created a tool called AP Potential (at http://www.collegeboard.com/counselors/app/expectancy.html) that uses PSAT scores to predict a student’s probability of passing a particular AP exam. Beyond general academic skills in math and language arts, nothing is known about more specific academic skills or knowledge (e.g., writing skills, mastery of trigonometry, previous knowledge of American history) for particular tests. Therefore, school personnel have little guidance in deciding whether a particular AP course is appropriate for their school or whether they should require pre-requisites for students who hope to enter an AP course. Research on the skills needed to succeed in AP courses is vital so that the program can operate more efficiently and so that students can maximize their chances for success when taking AP exams.
AP exam and class participation
Participation is another area where there is high variability in the AP program. This variability is important because it means that researchers need to investigate each AP subject separately. After all, students do not enroll in the entire AP program. Rather, they enroll in individual courses and decide on a test-by-test basis whether to take an AP exam.
In 2014, the least popular AP test was the AP Japanese Language and Culture exam, with 1,942 examinees. The most popular test was the AP English Language and Composition exam, which had 256 times more examinees: 497,416. In total, there were 3,567,207 AP exams administered in the United States in 2014; just 3 tests (AP English Language and Composition, AP U.S. History, and AP Literature and Composition) accounted for one third of all tests (for a total of 1.18 million tests). Six tests accounted for over half of all AP exams administered in 2014 (College Board, 2014b). In addition to the numbers of students participating in AP exams, passing rates (as defined by a score of 3 or higher) show high variability. In 2014, the lowest passing rate was for the AP Environmental Science test (47.2%), and the highest passing rate was for the AP Chinese Language & Culture test (93.4%). The weighted mean passing rate was 58.7%, with a median passing rate of 63.15% (College Board, 2014b).
This information about participation numbers and passing rates is based on College Board data, which only includes AP examinees. But the College Board does not collect data on students enrolled in AP courses who do not take AP exams. Therefore, no one really knows exactly the percentage of AP students who actually take AP exams. Estimates from previous studies vary somewhat. In Geiser and Santelices’s (2004) sample of students in the University of California system, approximately 55% to 60% of AP students enrolled in AP classes take their course’s AP exam. On the contrary, Sadler and Tai (2007b) cited a National Research Council report in which it was estimated that 60% to 70% of AP students take their course’s AP exam. The College Board’s (2001, p. 3) own estimate is that approximately 66% of students in AP courses take the corresponding AP exam.
It has recently become clear, though, that these estimations of overall participation rates mask the variability in participation rates across AP examinations. The first clue to this variability is found in a study from Sadler, Sonnert, Hazari, and Tai (2014) in which the participation rates for four AP tests were 57.7% for biology, 52.7% for chemistry, 53.6% for physics, and 77.4% for calculus. Data on a wider variety of courses, though, require tracking each student enrolled in an AP course to identify whether that particular student took an AP exam. These data are usually only available from state education agencies. Only the West Virginia Department of Education (n.d.) publishes information on the number of students enrolled publicly in AP courses, which can then be used in combination with College Board data to estimate participation rates in AP exams. Private raw data from the Warne et al. (2015) study, though, can be used to calculate this information also. The results for both states are displayed in Table 3.
Participation Rates for Various AP Exams in Utah and West Virginia.
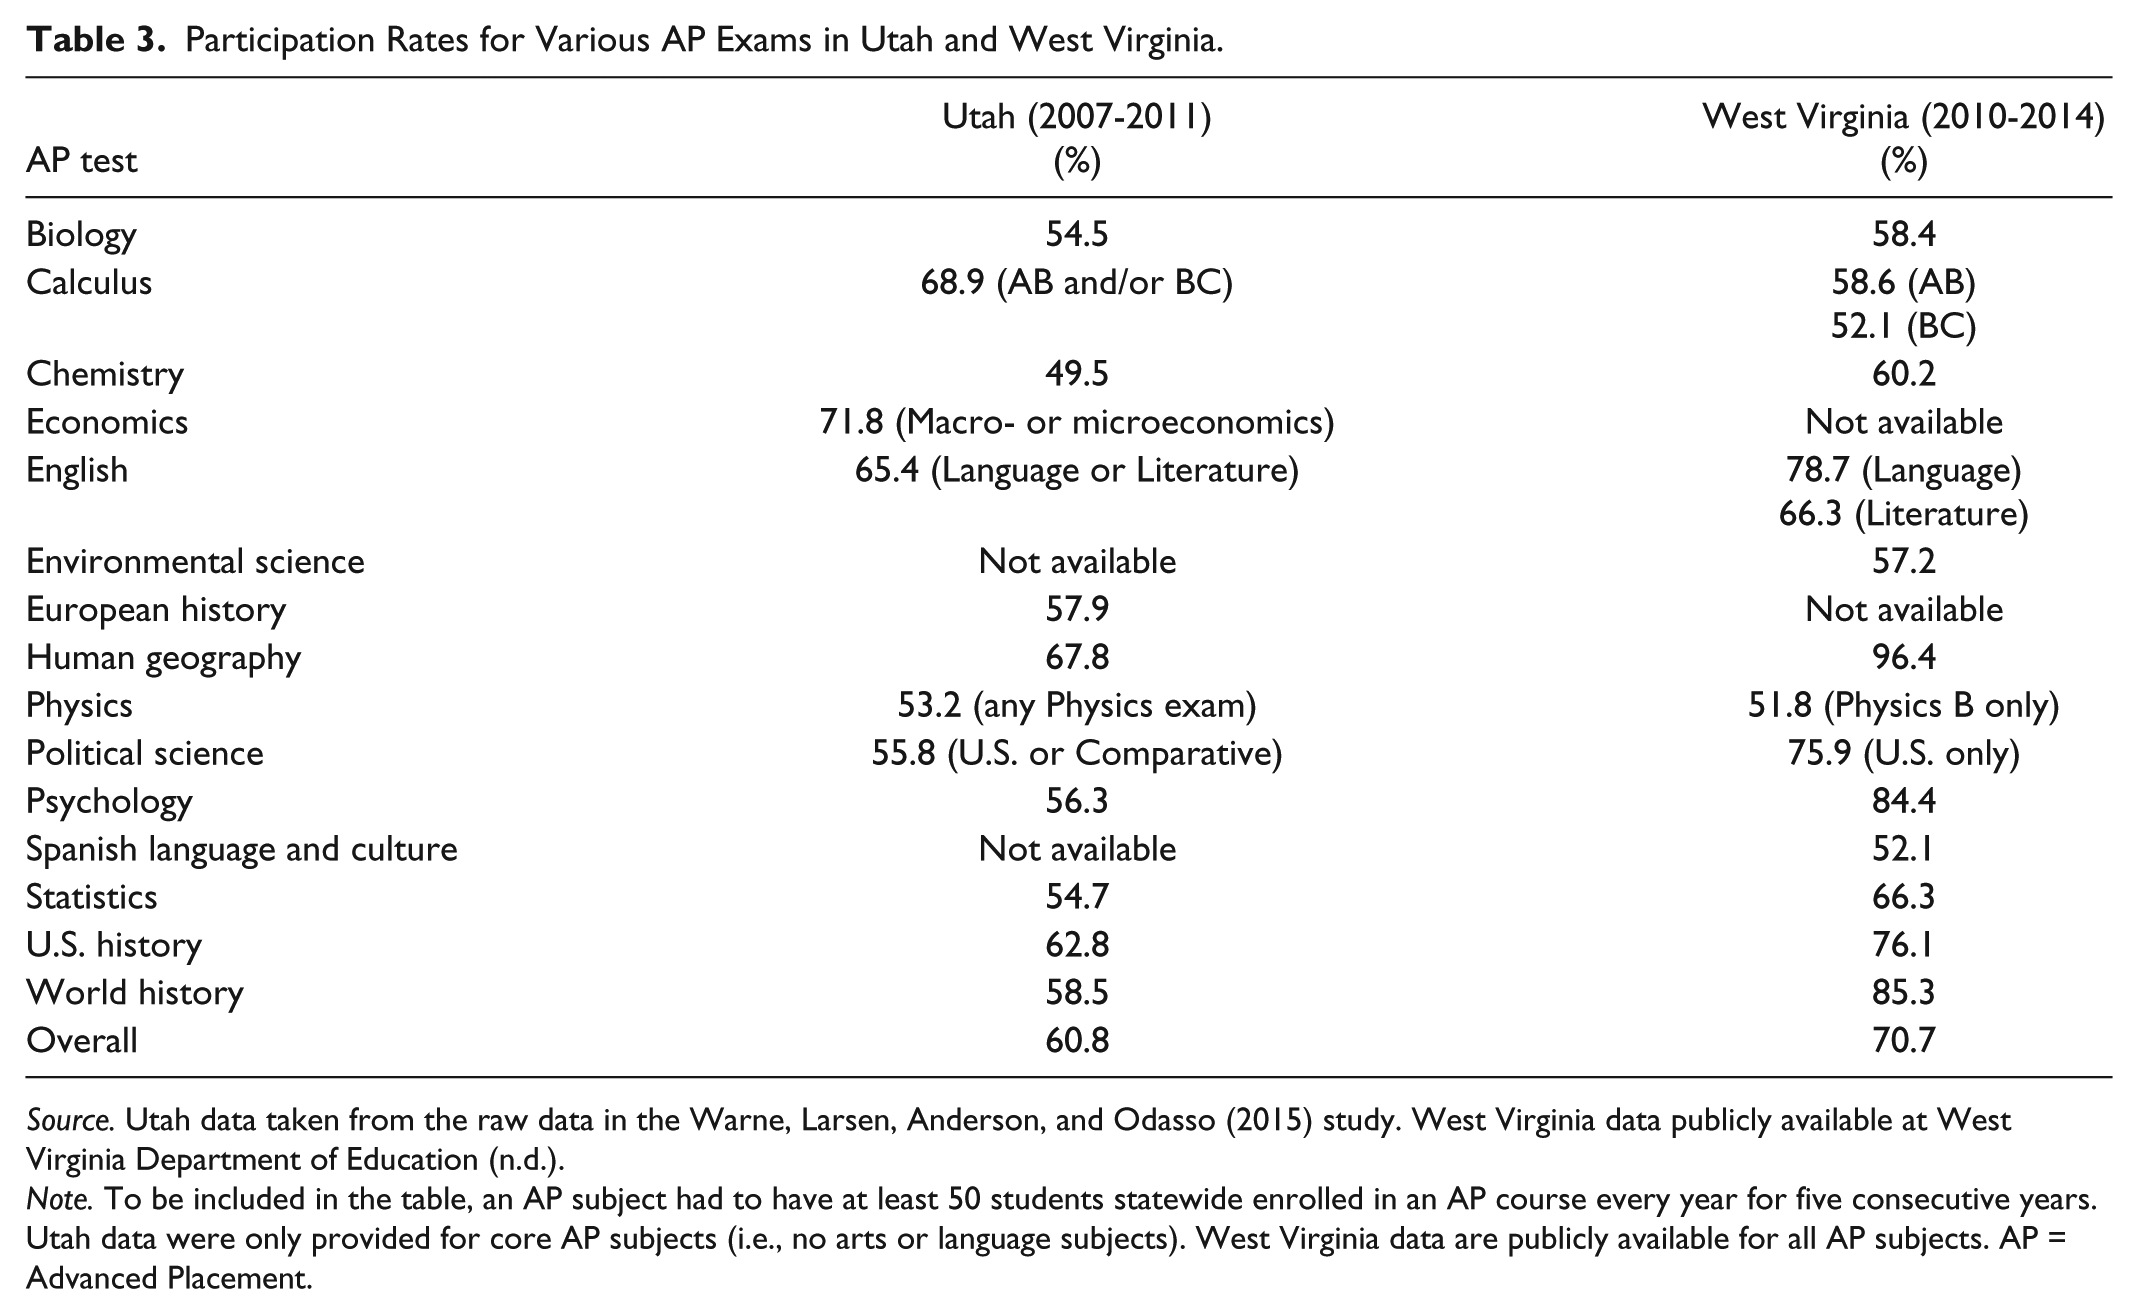
Source. Utah data taken from the raw data in the Warne, Larsen, Anderson, and Odasso (2015) study. West Virginia data publicly available at West Virginia Department of Education (n.d.).
Note. To be included in the table, an AP subject had to have at least 50 students statewide enrolled in an AP course every year for five consecutive years. Utah data were only provided for core AP subjects (i.e., no arts or language subjects). West Virginia data are publicly available for all AP subjects. AP = Advanced Placement.
Table 3 shows that natural sciences courses seem to have lower AP exam participation rates, while humanities and social science courses (especially U.S. History and English) tend to have higher exam participation rates. Comparing the AP participation rates in Table 3 with the participation rates from Sadler et al. (2014) shows that the natural science test participation rates all hover in roughly the mid-50% range. On the contrary, calculus participation rates tend to be higher than for participation rates in science courses. Yet, the differences between the two states are also enticing, such as West Virginia’s extremely high AP Human Geography participation rate. This may indicate some variability across state lines. Indeed, West Virginia mandates that every public high school offer AP courses, which alone may indicate a greater support for the program and therefore higher participation rates. 2
Table 3 also makes it clear that because students self-select whether they will take a particular AP test, the examinee population differ across tests. Therefore, it is unclear whether the variability in mean AP scores across tests is a result of differences in difficulty of AP exams or differences in the student examinee populations. A clue to this issue is found in the relationship between AP exam participation rates and AP exam mean scores in the 2014 national College Board data. My analysis indicates that the rank correlation between these two variables is ρ = −.65. At the state level, the correlations were r = −.22 in Utah and r = −.24 in West Virginia, indicating that the most popular tests are also the tests that students score lowest on. This supports Lichten’s (2000, 2010) claim that the AP program has become less academically elite as it has grown in popularity. 3 This information about the variability in participation rates and passing rates across AP tests shows that likely the decision process of whether to take a test probably varies from one test to another.
As the data in Table 3 indicate, lumping data from all AP courses together hides how each individual course functions and oversimplifies the nature of AP. In a way it may be inaccurate to talk about “the AP program” at all. Thinking about “the AP program” as a collection of advanced curricular options would better reflect how AP functions and how students participate in AP courses and tests. Researchers who produce overall “average” results of AP participation and do not consider courses may produce results that do not apply to any course (or any student) well.
Looking Forward With an Eye on Subpopulations
Researchers have become increasingly interested in issues of equity and fairness in relationship to the AP program. This is seen, for example, in the College Board’s (2014c) state reports on equity of access and the recent efforts of independent scholars investigating how subgroups of students interact with the program, including rural students (Barbour & Mulcahy, 2006; Cisneros et al., 2014; de la Varre, Irvin, Jordan, Hannum, & Farmer, 2014), English language learners (Kanno & Kangas, 2014), diverse students (Cisneros et al., 2014; Flowers, 2008; Griffith, 2010), low-income students (Hallett & Venegas, 2011; Moore & Slate, 2008), female students (Ackerman et al., 2013; Campbell, Brown, & Perry, 2009; Griffith, 2010), and urban students (Lichten, 2010). Although these efforts are preliminary, they still reveal clues about the special challenges these subpopulations experience. For example, Kanno and Kangas (2014) showed that school personnel often steer language learners away from AP courses, except for the AP language course that corresponds to their native language. It is possible that the self-selection process in Figure 1 may differ for various student populations. Therefore, researchers who attempt to understand how the AP program functions may need to model the process separately for each student population, just as they likely will need to understand the process separately for each AP class.
Although research on the subpopulations mentioned above should continue, I encourage researchers to investigate other subpopulations. For example, College Board (2014a, 2014c) data indicate that most AP examinees are in their junior or senior years of high school. Yet, there is a subset of AP examinees who are younger than the typical examinee. Two tests (AP European History and AP World History) have a majority of examinees in the 10th grade, and one AP test (AP Human Geography) is taken by more students in the ninth grade than any other grade. This raises a series of questions about how these tests function. For example, is a 14-year-old’s high school coursework truly equivalent of an introductory college course? Because these tests have some of the lower passing rates, does failing an AP test in the early high school years have consequences in students’ junior or senior years? However, the College Board (2014a) states that the grade level with the highest passing rate is for students who are not yet in the ninth grade. Virtually nothing is known about students who take AP exams before their high school years.
Rural students are another subpopulation about whom researchers know little. Previous research has shown that the massive growth nationwide in AP offerings at high school has largely bypassed rural schools (Klopfenstein, 2004). What little is known about rural students and the AP program is enticing, though. For example, two separate studies on rural students enrolled in online AP courses showed that these students have attrition rates that are higher than classroom-based face-to-face AP courses (Barbour & Mulcahy, 2006; de la Varre et al., 2014).
There has also been little research on gender differences across AP tests—either in participation rates or in average test scores. The few studies concerning this issue have been focused on female students’ participation in science and mathematics AP tests (Ackerman et al., 2013; Campbell et al., 2009; Griffith, 2010). But, this ignores the complexity of the relationship between gender and AP examination rates and test passing rates. For example, data from the 2014 testing year show that females took 54.5% of AP tests, and of the 34 AP tests administered that year, the number of female examinees exceeded the number of male examinees for 22 AP tests (College Board, 2014b). However, the passing rate for females was higher for only 11 AP tests. In addition, the gender ratio among examinees is much more discrepant among tests than the gender ratio among AP exam passers. Among examinees, the male-to-female ratio ranges from 0.30:1 (for AP Studio Art:Drawing) to 4.0:1 (for AP Computer Science A). Yet, the gender male-to-female gender ratio among students who pass AP tests has a much narrower range, from 0.87:1 (for AP Studio Art:Drawing) to 1.34:1 (for AP Environmental Science). It is not clear why some AP tests have a very marked gender imbalance among examinees while also having near-parity between males and females among students who pass.
Looking Forward With New Uses for AP Data
The College Board designs AP tests to be used by colleges deciding whether to give students college credit for high school work. The efforts of scientists and researchers affiliated with the College Board supporting this use for AP test scores are remarkable and supported by empirical data (Gray et al., 2006; Melican et al., 1997; Wimmers & Morgan, 1990), though some outsiders and universities question whether a score of 3 should be considered “passing” for some AP tests (e.g., Lichten, 2010). Increasingly AP data are being used for other purposes, such as making college admissions decisions or calculating high school GPAs—uses that the College Board neither advocates nor prohibits. However, modern standards of professional test use require that test users validate test scores for new uses (American Educational Research Association, American Psychological Association, & National Council on Measurement in Education, 2014). Few—if any—of these other uses of AP scores have been subject to validation research.
One way that AP data are being used is in the weighting of high school GPAs. In most American high schools, administrators give to students taking advanced courses—such as honors or AP classes—on their GPA (Lang, 2007). This incentivizes students to challenge themselves academically because otherwise some students could avoid taking challenging classes to preserve a high GPA (Klopfenstein & Lively, 2016). Most schools give this bonus for merely enrolling in an advanced course, though in some areas (e.g., Arkansas), weighted course credit is only given if the student also takes the AP test (see Education Commission of the States, 2015). This could create a strong incentive for students to participate in the AP program because high school GPAs are often used as a determining factor in college admissions, scholarship decisions, and academic honors (Warne et al., 2014). The research on using AP enrollment and test score data for the purpose of calculating a high school GPA is preliminary and contradictory (e.g., compare Warne et al., 2014 with Sadler & Tai, 2007b). Further psychometric research is needed before personnel can confidently use AP course and test data for the purpose of adjusting students’ high school GPAs.
More research exists supporting using AP data in the college admission process. But, as Tai (2008) explained,
The AP program was not originally intended for use in the college admissions process. . . . Decades later, however, the circumstances and the program both have changed. It would be naïve to expect college admissions officers to overlook or ignore the tendency of high-achieving students to seek out these courses in high school. (p. 40)
Indeed, advanced coursework is highly important in the college admissions process. In one recent study, college admissions counselors stated that the two most important aspects of a student’s application were—grades in college preparation courses and the degree of rigor of an applicant’s high school curriculum—surpassing in importance even college admission test scores and overall GPA (Clinedinst, Hurley, & Hawkins, 2012). What is not clear is which pieces of AP data are relevant and how college personnel should use them in the admissions decision process. Researchers investigating this question have used the average AP test score, highest AP test score, lowest AP test score, the number of college credits earned through AP, the number of passing AP scores, and nominal variables indicating that a student had taken AP courses or tests or had passed an AP test (Ackerman et al., 2013; Geiser & Santelices, 2004; Patterson et al., 2011; Sadler & Tai, 2007a; Shaw et al., 2013). These studies show that some variables are better predictors of college success than others; the mean AP score seems to have a strong correlation with college performance measures (Ackerman et al., 2013; Patterson et al., 2011). However, the number of AP courses that a student takes seem unrelated to college performance, indicating that college admissions committees should give preference to students with AP exam scores over students who merely enrolled in a course (Ackerman et al., 2013; Geiser & Santelices, 2004).
There are still empirical and practical questions about using AP data for college admissions decisions. It is possible that some AP test scores are more predictive of college success than others, though few researchers have investigated this possibility (see Ackerman et al., 2013, for an exception). Even if scholars reach a consensus about which AP variable can help college admissions personnel make better decisions, it is not clear how to practically implement this information because students may take differing combinations of AP courses and tests. Finding a consistent and fair system for taking AP work into account in admissions will require further work.
Other uses of AP data—such as how to incorporate AP data into student, teacher, and school accountability systems—remain almost completely uninvestigated. Some research indicates that merely offering AP courses to students does not turn a poor school into an excellent school (Lichten, 2010; Warne & Anderson, 2015). In addition, because success on an AP test seems to be correlated with student-level variables like PSAT score and family income (Ewing et al., 2006; Wyatt & Mattern, 2011), it is not clear how to isolate the school-level influence and demographics from the student’s efforts. Research into value-added accountability measures (e.g., Winters & Cowen, 2013) may be relevant.
Looking Forward With New Scientific and Policy Questions
Throughout this article, I have suggested possible avenues of research on the way that the AP program functions. In this section of the article, I provide a list of further research questions. Most of these research questions are based on prior research, but some are based on the data reported in this article. I have divided these questions into two categories: descriptive questions and causal questions.
Descriptive questions
Although studies of descriptive questions do not provide definite information about the benefits of the AP program, they can lay the foundation necessary to ask questions about causes. These questions include the following.
The College Board recommends that students receive college credit for earning a score of 3, 4, or 5 on an AP test. But there is no evidence that scores are equivalent across tests. Are some tests easier than others? Do universities’ AP policies on AP credit reflect the actual relative difficulty of AP tests and the work needed to pass them?
As AP grows in popularity, passing rates for most tests have dropped (Tai, 2008; Warne & Anderson, 2015), possibly indicating that the AP program is reaching a saturation point and that most new populations of AP students are not well prepared for AP exams (Lichten, 2010). Large numbers of unqualified students enrolling in AP are an inefficient use of time and school resources. What variables (including non-cognitive variables) should be considered when permitting a student to enroll in an AP course or take an AP test?
Attrition rates seem to be higher in online AP courses than in face-to-face AP courses (Barbour & Mulcahy, 2006; de la Varre et al., 2014). Under what conditions is an online delivery system effective for an AP course? Does the AP curriculum or the student population creates special barriers to successful online learning, or can online AP courses be as successful as face-to-face courses? What conditions and teacher training are necessary for a successful online AP experience?
There are already inequalities in access to AP programs to students, with students in suburban and middle- and upper-socioeconomic classes generally having the most access to AP course offerings. How should college admissions personnel use the information on student participation in the AP program without exacerbating inequalities in AP offerings (Klugman, 2013)?
Given evidence that English language learners sometimes take the AP test that corresponds to their native language (College Board, 2014b; Kanno & Kangas, 2014; Warne, 2016), do English language learners taking these AP language tests receive any academic benefits? Should state education agencies or universities incentivize this behavior by granting credit or subsidizing exam fees?
Who are the students who take AP exams before the ninth grade? Are they similar to students who take the SAT and ACT in their early adolescence (see Olszewski-Kubilius & Lee, 2011; Warne, 2014; Warne et al., 2016)? Why do they take AP exams before enrolling in high school? How do they gain access to AP courses and tests outside of a high school setting?
Why is the female-to-male ratio of examinees so imbalanced for some AP exams, while the same tests have a more equal sex ratio among students who earn a score of 3 or higher? What variables predict males’ and females’ decision to self-select in sex stereotyped AP courses and to choose to take AP exams?
Causal questions
Armed with the information derived from descriptive questions, researchers are better able to investigate causal questions to learn information about the magnitude of the benefits of the AP program. These questions include the following.
Some researchers have found that students do not receive academic benefits from an AP course unless they take the AP test (Ackerman et al., 2013; Geiser & Santelices, 2004; Sadler & Sonnert, 2010; Warne et al., 2015). But, do students in AP courses who do not take the AP test gain some benefits from their AP courses? How does this compare to what students learn in non-AP courses? Are there perhaps improvements in study skills and other non-achievement variables that may make enrolling in an AP course valuable to students?
Ackerman et al. (2013) investigated whether certain combinations of AP tests (called “portfolios”) are better predictors of college success than others. Are some portfolios more helpful for preparing students for college than other portfolios? Do complementary portfolios (e.g., a mix of science and humanities courses) increase students’ chances of college success, or do students receive better college preparation with portfolios of AP courses/tests that are more focused on their college major?
Jeong (2009) found that state policies that provide AP exam fee subsidies to low-income students encouraged more of these students to take AP exams. The impact of other state policies, though, is unclear. How do government policies—such as mandating that state universities accept AP credit, or that public high schools offer AP courses, or the use of AP data for accountability—impact student behavior?
In states with generous AP fee subsidies, the AP program is not cost-effective for taxpayers (Dendy et al., 2006; Klopfenstein, 2010; Sikes et al., 2009). Are the more common, modest financial incentives (e.g., only paying AP exam fees for low-income students or for students who have a high probability of passing the AP exam) cost-effective? Educational economists should also perform a comprehensive cost-benefit analysis to determine whether the economic and non-economic benefits of AP outweigh the financial and opportunity costs of the program.
The policy of offering a large number of AP courses to all students who wish to take them is highly popular, but this “AP for all” policy has critics (Blagaich, 1999; Dougherty & Mellor, 2010; Klopfenstein & Thomas, 2009, 2010; Lichten, 2000, 2010; Moore & Slate, 2008; Sadler, 2010; Warne et al., 2015). What alternative policies (such a structured sequence of courses, or a merit-based financial aid) could serve as models for AP policies that would improve the efficiency and the effectiveness of the AP program?
Concluding Thoughts
Since the 1950s, AP has grown from an obscure program serving a small number of elite high schools to the most common way that high school students receive an advanced curriculum (Lacy, 2010; Schneider, 2009). Yet, the body of independent educational research on the AP program is preliminary and mostly undeveloped. In this article, I took stock of the past research on the AP program by presenting information on the high-quality psychometrics behind AP tests, the more positive academic outcomes for AP students (compared with non-AP students), and recent progress that researchers have made toward estimating the causal impact of the AP program.
In this article, I also looked forward to future research by showing readers the many potential avenues of research that are available to educational scholars trying to understand the AP program better. There are five ways that I have suggested that researchers look forward in their research: (a) methodologically, (b) with an eye on course variability, (c) by examining new student populations, (d) studying the AP program for new purposes, and (e) with new research questions. It is my hope that more researchers study the AP program so that students, teachers, parents, school personnel, and university personnel can make more informed decisions about AP classes and tests.
Nevertheless, it is important to recognize that using this article as a blueprint for future AP research will not fix all the scientific, policy, and educational problems associated with the AP program. I am particularly cognizant, for example, of the tension between reducing the inequality of access to AP courses and the suggestions I have made about pre-requisites for AP courses or steering resources into non-AP remediation programs. And, methodologically, there is no guarantee that incorporating propensity score modeling, HLM, cluster-level RCTs, or other sophisticated statistical models will cure the problems that have plagued AP research. One anonymous reviewer of the article suggested that these methodologies could merely replace old problems in AP research with new problems. She or he may be right. Despite these shortcomings, I believe that moving researchers to recognize variability among AP courses, investigating new populations and new questions, and using new methodologies will at least advance the knowledge about the AP program beyond its current state. There is so much about this highly popular academic program that researchers, parents, students, and school personnel do not understand. If researchers implement some of these suggestions, then perhaps America’s national ignorance about AP’s effectiveness can be reduced. I believe that it is certainly worth trying, and I look forward to the new research that educational scholars produce in the next few decades.
Footnotes
Declaration of Conflicting Interests
The author(s) declared no potential conflicts of interest with respect to the research, authorship, and/or publication of this article.
Funding
The author(s) disclosed receipt of the following financial support for the research, authorship, and/or publication of this article: The article processing charge for this article was paid by the College of Humanities and Social Sciences, Utah Valley University.